


Smart Surfaces Market Synopsis
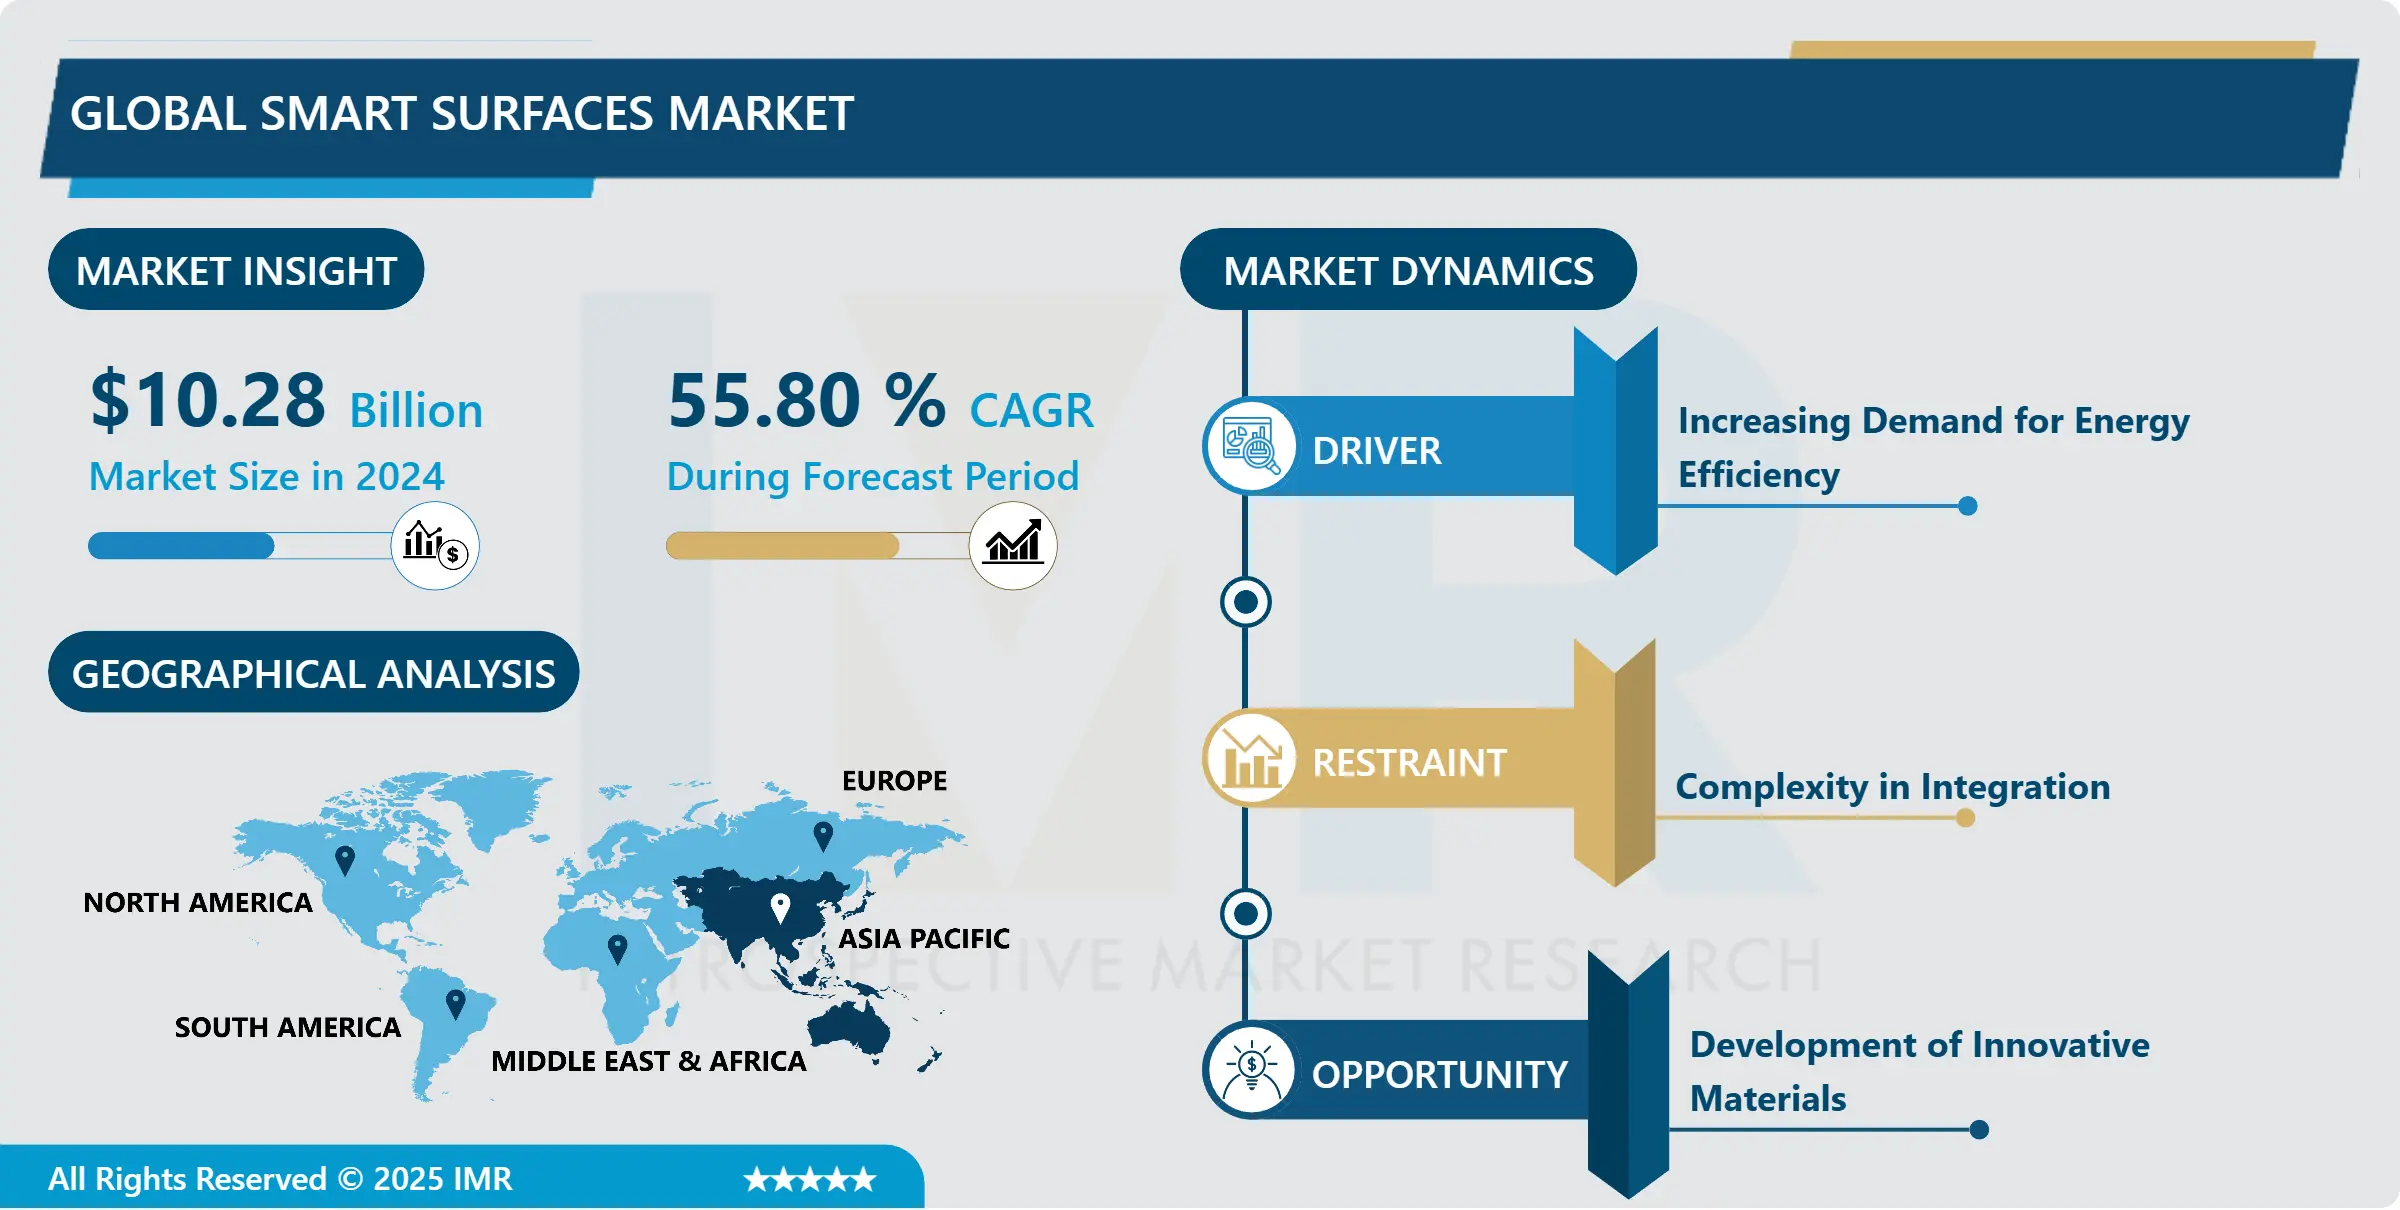
Smart Surfaces Market Size Was Valued at USD 10.28 Billion in 2024 and is Projected to Reach USD 356.89 Billion by 2032, Growing at a CAGR of 55.80% From 2025-2032.
Smart surfaces market is growing significantly due to the development of material sciences, IoT devices, and rising concerns over energy efficiency and environmental issues. Smart surfaces have been designed to exhibit characteristics that go beyond the conventional surface, incorporating such features as sensors, actuators, and data processing. These surfaces can respond to environmental conditions, control temperature, or provide information, having application potential in construction, automotive, health care, and electronics industries. Key trends include the demand for higher safety and cleanliness in public places, the increasing rate of urbanization and the subsequent creation of smart cities, and the popularity of connected products. The market includes a diverse variety of products like self-cleaning coatings, smart windows, and interactive displays.
The smart surfaces market has shown tremendous growth in the past few years owing to the growing popularity of innovative solutions in various industries like building and construction, automotive, healthcare, and consumer goods. This growth is facilitated by the development of new materials, nanotechnology, and the Internet of Things (IoT), which allowed surfaces to become smarter, more sensitive, and more versatile.
Smart surfaces use a combination of technologies to provide the desired functions. This includes self-cleaning coatings, thermochromic and photochromic materials for temperature and light regulation, conductive materials for touch and gesture control, and sensors for monitoring parameters like temperature, humidity, and pressure. Smart surfaces can be integrated with the AI and machine learning algorithms for better performance and training capabilities.
Smart surfaces are used in various industries. They are employed in the construction industry for energy-efficient building envelopes, adaptive lighting solutions, and interactive installations. Smart surfaces are applied to vehicle interiors in automotive to provide touch-sensitive controls, heads-up displays, and vehicle safety systems. Examples of healthcare applications include coatings with antimicrobial properties for hygiene, smart textiles for monitoring patients, and medical devices that contain sensors. Smart surfaces are also used in consumer electronics for foldable displays, smartwatches, and connected household gadgets.
The smart surfaces market is driven by factors like rising population and urbanization, rising awareness regarding sustainability, and rising demand for efficient resource use. But factors like high production costs, tough integration issues, and privacy and security worries are barriers to market expansion. These challenges can be overcome through the collective efforts of material scientists, engineers, designers, and policymakers to develop new technologies and institute legal and social frameworks for the safe and effective use of smart surface technologies.
Smart Surfaces Market Trend Analysis
Rise in IoT and Connected Devices
- There has been tremendous development in the IoT landscape with devices such as smart thermostats and wearables to connected cars and industrial sensors. This includes the development in wireless communication, electronics, miniaturization and escalating demand for automation and connectivity.
- IIoT involves the use of connectivity in common objects and surfaces to convert them into nodes that can process and communicate data. For example, smart mirrors may show weather changes and personal health information, while smart countertops can identify food products that are put on them.
- Smart surfaces focus on the interaction and services that smart environments offer users. They can become more personalized to the needs of the users, streamline repetitive tasks, and provide feedback and analytics in real-time. For example, smart desks in offices can be programmed to raise or lower depending on user input and send prompts to get up and stretch for healthier working postures.
- Smart surfaces are driving the development of a niche market segment. Manufacturers are developing materials and technologies to make surfaces smart and interactive. This market includes the home automation, healthcare, retail, and transportation industries.
Energy Efficiency and Sustainability
- Smart surfaces are important in improving energy efficiency because they use sensors and actuators to manage energy consumption. For instance, intelligent building facades can respond to the intensity of sunlight and automatically become transparent or opaque to reduce the use of artificial light and heating or cooling systems. These surfaces help reduce energy use and overall facility costs and have less of an effect on the environment.
- Smart surfaces also employ renewable energy technologies like solar panels and thermoelectric generators. These technologies make use of natural resources such as sunlight and heat to produce electricity, thus encouraging sustainability and combating climate change. Sustainable smart surfaces generate renewable energy to power themselves and even export electricity to the grid.
- Smart surfaces are equipped with numerous sensors that generate significant amounts of data on energy consumption and environmental conditions. Understanding these trends helps businesses and building managers to recognize the potential for additional energy efficiency and sustainability gains. For instance, real-time monitoring of water consumption on smart surfaces can result in water-saving techniques in agriculture, such as more efficient irrigation.
- The applications of smart surface materials for sustainability focus on the use of recyclable materials. Researchers are also trying new and environmentally friendly materials like biodegradable polymers and sustainable composites for smart surfaces to minimize the surface’s carbon footprint. Moreover, nanotechnology allows producing highly durable and long-lasting surfaces that are easy to maintain and require only occasional cleaning and repair.
Smart Surfaces Market Segment Analysis:
Smart Surfaces Market is segmented on the basis of Type, and Application.
By Type, Self-Healing Materials segment is expected to dominate the market during the forecast period.
- This category includes surfaces with materials that are able to heal themselves in the occurrence of damage to further increase their life span and decrease maintenance expenses. Examples include self-healing paints for cars and trucks to self-healing concrete for buildings and roads.
- Self-cleaning surfaces use systems such as photocatalysis or super-hydrophobicity to reduce dirt and bacterial accumulation on treated objects. These surfaces are used in hospitals, buses, and building exteriors to encourage hygiene and save cleaning time.
- In addition to self-healing and self-cleaning abilities, future smart surfaces may include other features, including antimicrobial agents, thermoregulation, or interactive interfaces. These features address the specific needs of industries where such products are used and provide better performance and user experience in various applications.
By Application, Construction segment held the largest share in 2024
- In the built environment, smart surfaces improve the efficiency, comfort, and performance of buildings. Examples include smart facades with controllable shading for energy efficiency and self-healing concrete for infrastructure applications.
- Smart surfaces are important in energy production, management and saving. The building façades and roads are converted into solar panels to produce renewable energy while smart grids are used to reduce energy consumption.
- Smart surfaces find several applications in the transportation industry like the self-cleaning coatings for airplane exteriors, energy-generating roadways for EV charging, and traffic management infrastructure equipped with sensors.
- Examples of smart surfaces in healthcare include antimicrobial coatings and patient monitoring systems. In electronics, there are new interactions with flexible displays and touch-sensitive surfaces. In addition, they are used in agriculture for intelligent agricultural coatings, and in retail for interactive advertising media, which indicates the potential for using intelligent surfaces in various areas of life.
Smart Surfaces Market Regional Insights:
Asia Pacific region, the smart surfaces market is poised to dominate in 2024
- The first major driver is rapid urbanization across countries such as China, Japan, and India, which causes increased construction and infrastructure activities. With the continued growth of cities and increased density in urban areas, there is a crucial demand for new solutions that make better use of the available space and improve the functionality of urban environments.
- Technologies such as sensors and actuators installed in smart surfaces provide an efficient means of controlling energy usage, indoor and outdoor air quality, and general urban living.
- In addition, the emphasis on smart cities and the development of intelligent transportation systems is promoting the use of advanced surface technologies in the Asia Pacific region. The governments and the urban planners are focusing on investing in infrastructure that can support digital transformation and the sustainable development goals. Smart surfaces are particularly useful in this context by providing an all-in-one approach for buildings, public places, and transportation facilities.
- For example, intelligent surfaces on roads that can sense the traffic passing over them and the conditions around them can help create safer and more efficient transport systems. This makes the smart surfaces market in Asia Pacific dominated by the major trends of urbanization, technology, and sustainability with prospects spread across numerous domains such as real estate, transport, and public infrastructure.
Active Key Players in the Smart Surfaces Market
- 3M Company (USA)
- Clariant AG (Switzerland)
- Debiotech SA (Switzerland)
- DowDuPont Inc. (USA)
- Gentex Corporation (USA)
- HZO Inc. (USA)
- NanoShine Ltd. (South Korea)
- Nanotron Technologies GmbH (Germany)
- P2i Ltd. (UK)
- Other Active Players
|
Global Smart Surfaces Market |
|||
|
Base Year: |
2024 |
Forecast Period: |
2025-2032 |
|
Historical Data: |
2018 to 2023 |
Market Size in 2024: |
USD 10.28 Bn. |
|
Forecast Period 2024-32 CAGR: |
55.80 % |
Market Size in 2032: |
USD 356.89 Bn. |
|
Segments Covered: |
By Type |
|
|
|
By Application |
|
||
|
By Region |
|
||
|
Key Market Drivers: |
|
||
|
Key Market Restraints: |
|
||
|
Key Opportunities: |
|
||
|
Companies Covered in the report: |
|
||
Chapter 1: Introduction
1.1 Scope and Coverage
Chapter 2:Executive Summary
Chapter 3: Market Landscape
3.1 Market Dynamics
3.1.1 Drivers
3.1.2 Restraints
3.1.3 Opportunities
3.1.4 Challenges
3.2 Market Trend Analysis
3.3 PESTLE Analysis
3.4 Porter's Five Forces Analysis
3.5 Industry Value Chain Analysis
3.6 Ecosystem
3.7 Regulatory Landscape
3.8 Price Trend Analysis
3.9 Patent Analysis
3.10 Technology Evolution
3.11 Investment Pockets
3.12 Import-Export Analysis
Chapter 4: Smart Surfaces Market by Type (2018-2032)
4.1 Smart Surfaces Market Snapshot and Growth Engine
4.2 Market Overview
4.3 Self-Healing Materials
4.3.1 Introduction and Market Overview
4.3.2 Historic and Forecasted Market Size in Value USD and Volume Units
4.3.3 Key Market Trends, Growth Factors, and Opportunities
4.3.4 Geographic Segmentation Analysis
4.4 Self-Cleaning
4.5 Others
Chapter 5: Smart Surfaces Market by Application (2018-2032)
5.1 Smart Surfaces Market Snapshot and Growth Engine
5.2 Market Overview
5.3 Construction
5.3.1 Introduction and Market Overview
5.3.2 Historic and Forecasted Market Size in Value USD and Volume Units
5.3.3 Key Market Trends, Growth Factors, and Opportunities
5.3.4 Geographic Segmentation Analysis
5.4 Energy
5.5 Transportation
5.6 Healthcare
5.7 Electronics
5.8 Others
Chapter 6: Company Profiles and Competitive Analysis
6.1 Competitive Landscape
6.1.1 Competitive Benchmarking
6.1.2 Smart Surfaces Market Share by Manufacturer (2024)
6.1.3 Industry BCG Matrix
6.1.4 Heat Map Analysis
6.1.5 Mergers and Acquisitions
6.2 ENERPAC TOOL GROUP (U.S.)
6.2.1 Company Overview
6.2.2 Key Executives
6.2.3 Company Snapshot
6.2.4 Role of the Company in the Market
6.2.5 Sustainability and Social Responsibility
6.2.6 Operating Business Segments
6.2.7 Product Portfolio
6.2.8 Business Performance
6.2.9 Key Strategic Moves and Recent Developments
6.2.10 SWOT Analysis
6.3 CLIPPER WINDPOWER (U.S.)
6.4 NORDEX GROUP (GERMANY)
6.5 ENERCON GMBH (GERMANY)
6.6 KENERSYS GMBH (GERMANY)
6.7 SENVION GMBH (GERMANY)
6.8 SIEMENS GAMESA RENEWABLE ENERGY (SPAIN)
6.9 GENERAL ELECTRIC (FRANCE)
6.10 EWT WIND TURBINES (NETHERLANDS)
6.11 VESTAS WIND SYSTEMS (DENMARK)
6.12 GOLDWIND SCIENCE & TECHNOLOGY COLTD (CHINA)
6.13 ENVISION ENERGY (CHINA)
6.14 MINGYANG SMART ENERGY GROUP COLTD (CHINA)
6.15 SINOVEL WIND GROUP COLTD
6.16 XEMC WINDPOWER COLTD
6.17 MITSUBISHI POWER (JAPAN)
6.18 TOSHIBA ENERGY SYSTEMS & SOLUTIONS CORPORATION (JAPAN)
6.19 SUZLON (INDIA)
6.20
Chapter 7: Global Smart Surfaces Market By Region
7.1 Overview
7.2. North America Smart Surfaces Market
7.2.1 Key Market Trends, Growth Factors and Opportunities
7.2.2 Top Key Companies
7.2.3 Historic and Forecasted Market Size by Segments
7.2.4 Historic and Forecasted Market Size by Type
7.2.4.1 Self-Healing Materials
7.2.4.2 Self-Cleaning
7.2.4.3 Others
7.2.5 Historic and Forecasted Market Size by Application
7.2.5.1 Construction
7.2.5.2 Energy
7.2.5.3 Transportation
7.2.5.4 Healthcare
7.2.5.5 Electronics
7.2.5.6 Others
7.2.6 Historic and Forecast Market Size by Country
7.2.6.1 US
7.2.6.2 Canada
7.2.6.3 Mexico
7.3. Eastern Europe Smart Surfaces Market
7.3.1 Key Market Trends, Growth Factors and Opportunities
7.3.2 Top Key Companies
7.3.3 Historic and Forecasted Market Size by Segments
7.3.4 Historic and Forecasted Market Size by Type
7.3.4.1 Self-Healing Materials
7.3.4.2 Self-Cleaning
7.3.4.3 Others
7.3.5 Historic and Forecasted Market Size by Application
7.3.5.1 Construction
7.3.5.2 Energy
7.3.5.3 Transportation
7.3.5.4 Healthcare
7.3.5.5 Electronics
7.3.5.6 Others
7.3.6 Historic and Forecast Market Size by Country
7.3.6.1 Russia
7.3.6.2 Bulgaria
7.3.6.3 The Czech Republic
7.3.6.4 Hungary
7.3.6.5 Poland
7.3.6.6 Romania
7.3.6.7 Rest of Eastern Europe
7.4. Western Europe Smart Surfaces Market
7.4.1 Key Market Trends, Growth Factors and Opportunities
7.4.2 Top Key Companies
7.4.3 Historic and Forecasted Market Size by Segments
7.4.4 Historic and Forecasted Market Size by Type
7.4.4.1 Self-Healing Materials
7.4.4.2 Self-Cleaning
7.4.4.3 Others
7.4.5 Historic and Forecasted Market Size by Application
7.4.5.1 Construction
7.4.5.2 Energy
7.4.5.3 Transportation
7.4.5.4 Healthcare
7.4.5.5 Electronics
7.4.5.6 Others
7.4.6 Historic and Forecast Market Size by Country
7.4.6.1 Germany
7.4.6.2 UK
7.4.6.3 France
7.4.6.4 The Netherlands
7.4.6.5 Italy
7.4.6.6 Spain
7.4.6.7 Rest of Western Europe
7.5. Asia Pacific Smart Surfaces Market
7.5.1 Key Market Trends, Growth Factors and Opportunities
7.5.2 Top Key Companies
7.5.3 Historic and Forecasted Market Size by Segments
7.5.4 Historic and Forecasted Market Size by Type
7.5.4.1 Self-Healing Materials
7.5.4.2 Self-Cleaning
7.5.4.3 Others
7.5.5 Historic and Forecasted Market Size by Application
7.5.5.1 Construction
7.5.5.2 Energy
7.5.5.3 Transportation
7.5.5.4 Healthcare
7.5.5.5 Electronics
7.5.5.6 Others
7.5.6 Historic and Forecast Market Size by Country
7.5.6.1 China
7.5.6.2 India
7.5.6.3 Japan
7.5.6.4 South Korea
7.5.6.5 Malaysia
7.5.6.6 Thailand
7.5.6.7 Vietnam
7.5.6.8 The Philippines
7.5.6.9 Australia
7.5.6.10 New Zealand
7.5.6.11 Rest of APAC
7.6. Middle East & Africa Smart Surfaces Market
7.6.1 Key Market Trends, Growth Factors and Opportunities
7.6.2 Top Key Companies
7.6.3 Historic and Forecasted Market Size by Segments
7.6.4 Historic and Forecasted Market Size by Type
7.6.4.1 Self-Healing Materials
7.6.4.2 Self-Cleaning
7.6.4.3 Others
7.6.5 Historic and Forecasted Market Size by Application
7.6.5.1 Construction
7.6.5.2 Energy
7.6.5.3 Transportation
7.6.5.4 Healthcare
7.6.5.5 Electronics
7.6.5.6 Others
7.6.6 Historic and Forecast Market Size by Country
7.6.6.1 Turkiye
7.6.6.2 Bahrain
7.6.6.3 Kuwait
7.6.6.4 Saudi Arabia
7.6.6.5 Qatar
7.6.6.6 UAE
7.6.6.7 Israel
7.6.6.8 South Africa
7.7. South America Smart Surfaces Market
7.7.1 Key Market Trends, Growth Factors and Opportunities
7.7.2 Top Key Companies
7.7.3 Historic and Forecasted Market Size by Segments
7.7.4 Historic and Forecasted Market Size by Type
7.7.4.1 Self-Healing Materials
7.7.4.2 Self-Cleaning
7.7.4.3 Others
7.7.5 Historic and Forecasted Market Size by Application
7.7.5.1 Construction
7.7.5.2 Energy
7.7.5.3 Transportation
7.7.5.4 Healthcare
7.7.5.5 Electronics
7.7.5.6 Others
7.7.6 Historic and Forecast Market Size by Country
7.7.6.1 Brazil
7.7.6.2 Argentina
7.7.6.3 Rest of SA
Chapter 8 Analyst Viewpoint and Conclusion
8.1 Recommendations and Concluding Analysis
8.2 Potential Market Strategies
Chapter 9 Research Methodology
9.1 Research Process
9.2 Primary Research
9.3 Secondary Research
|
Global Smart Surfaces Market |
|||
|
Base Year: |
2024 |
Forecast Period: |
2025-2032 |
|
Historical Data: |
2018 to 2023 |
Market Size in 2024: |
USD 10.28 Bn. |
|
Forecast Period 2024-32 CAGR: |
55.80 % |
Market Size in 2032: |
USD 356.89 Bn. |
|
Segments Covered: |
By Type |
|
|
|
By Application |
|
||
|
By Region |
|
||
|
Key Market Drivers: |
|
||
|
Key Market Restraints: |
|
||
|
Key Opportunities: |
|
||
|
Companies Covered in the report: |
|
||


