


Virtual Network Interface Market Synopsis
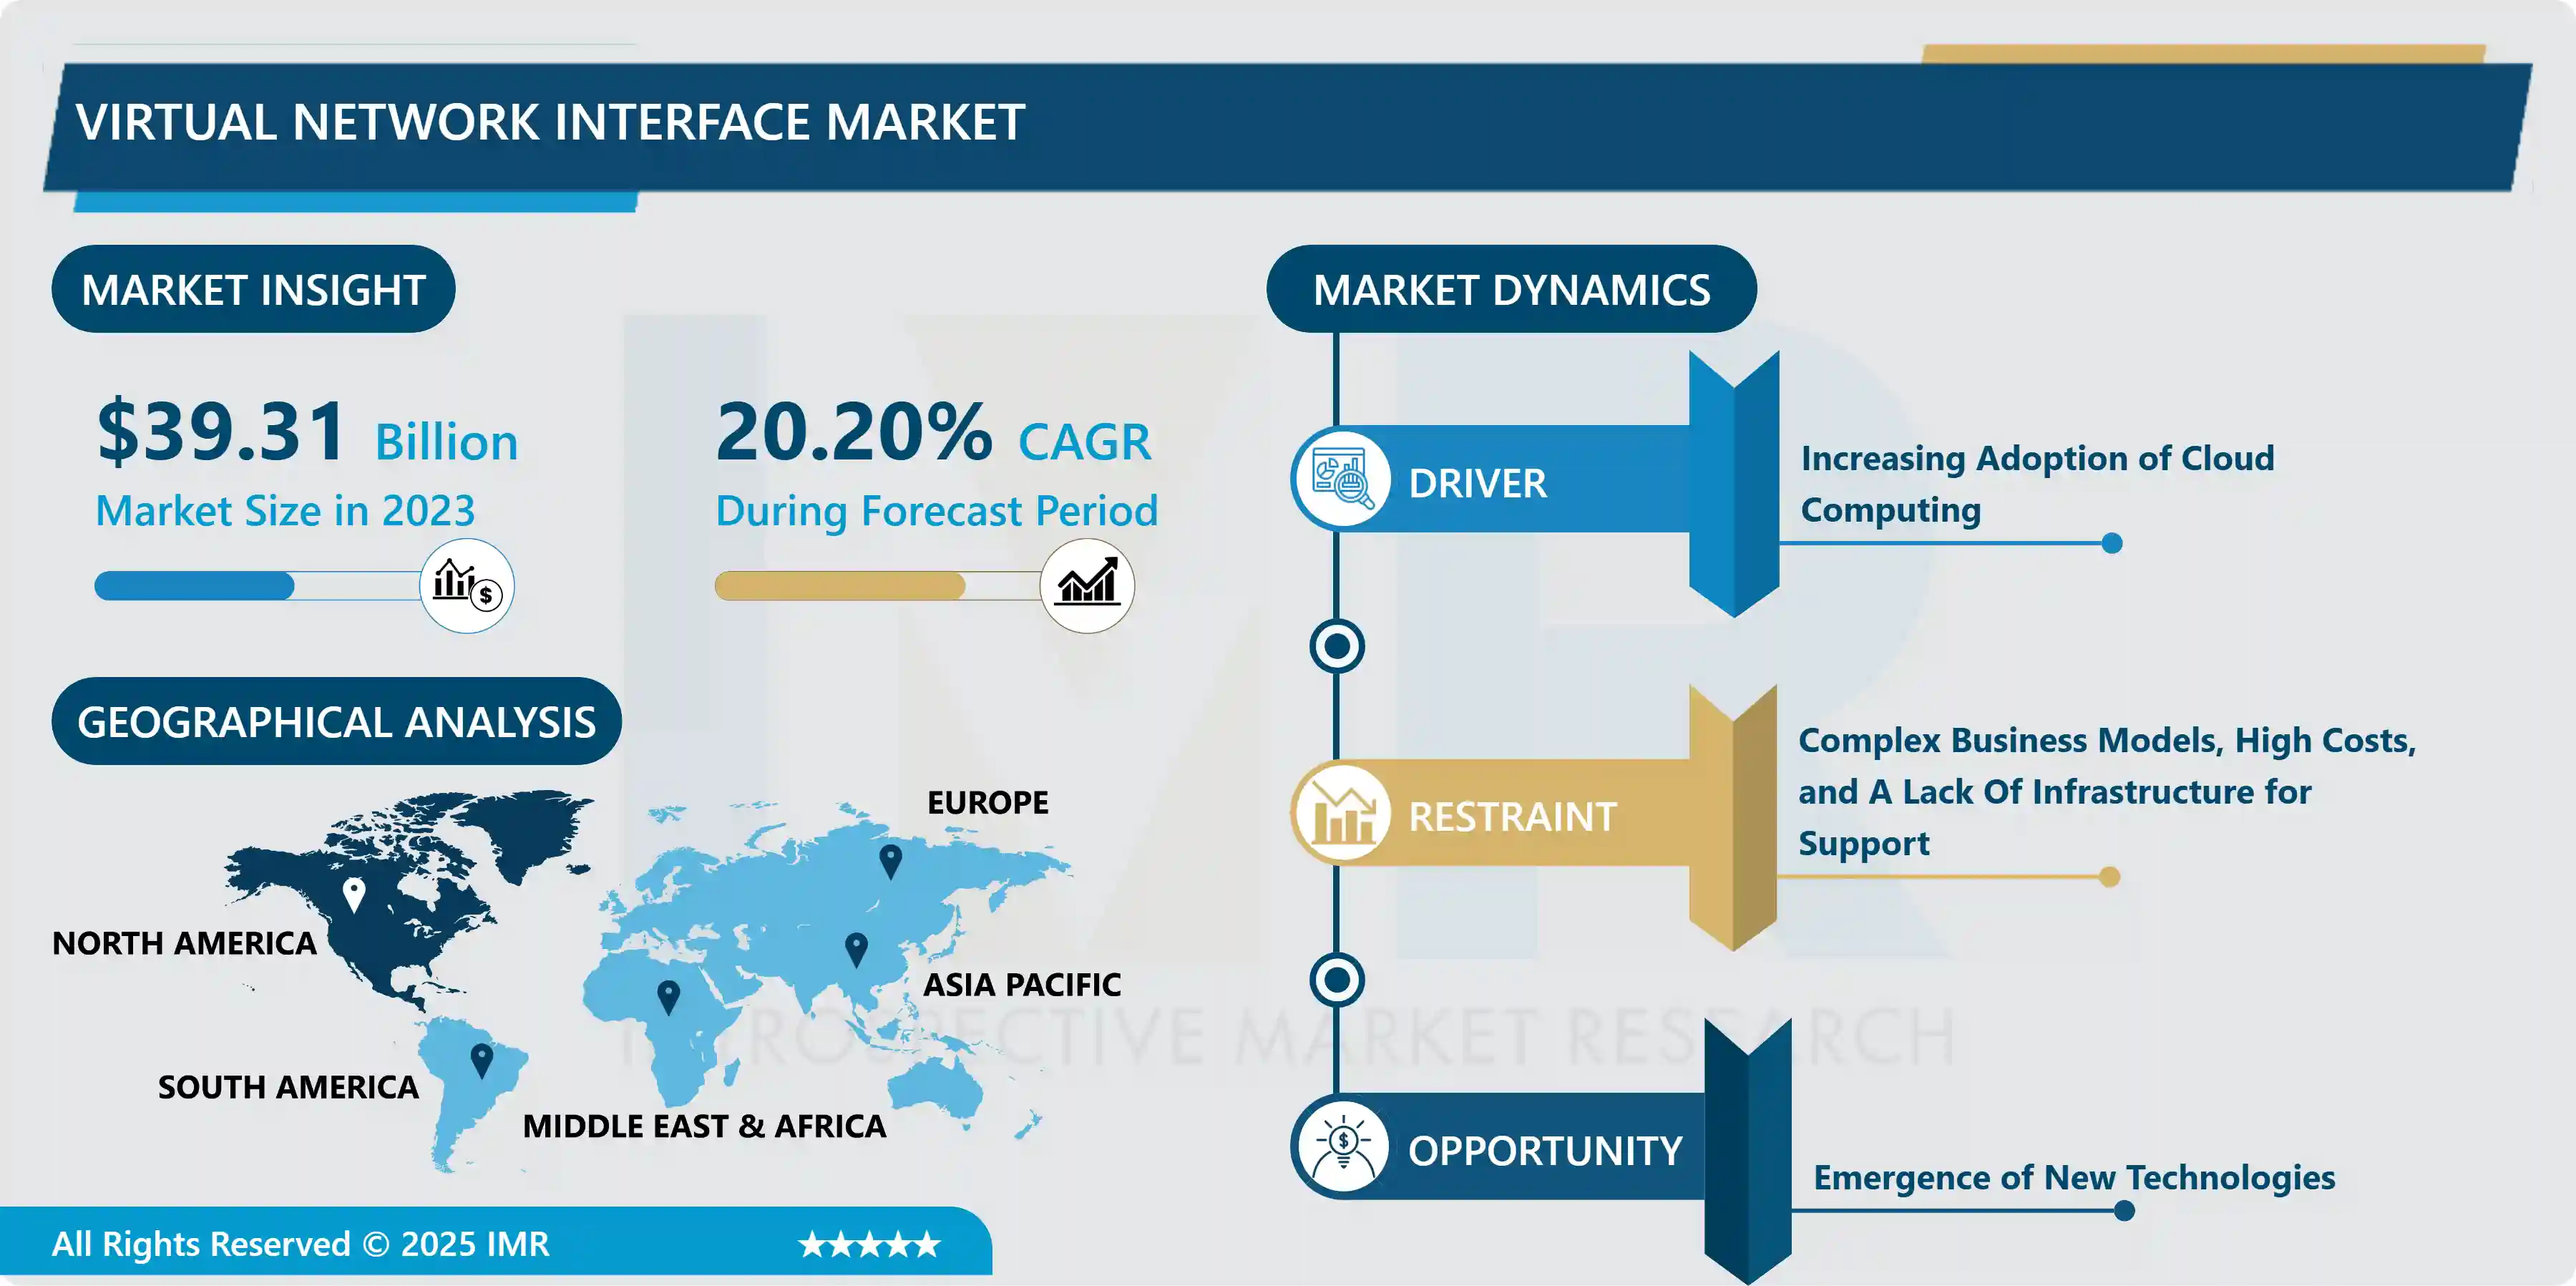
Virtual Network Interface market size was valued at USD 39.31 Billion in 2023, and is projected to reach USD 205.89 Billion by 2032, registering a CAGR of 20.2% from 2024 to 2032.
A Virtual Network Interface is a software-based representation of a network interface card (NIC) that enables virtual machines or containers to connect to a network. It allows multiple instances to share a single physical network interface, facilitating communication between virtualized environments and the external network while providing isolation and flexibility in managing network resources.
The flexibility in configuration and management is a key benefit of virtual network interfaces. In contrast to physical NICs, virtual interfaces offer ease in creation, modification, and deletion, enabling swift adaptation to evolving network needs. This versatility facilitates efficient resource utilization and the dynamic allocation of network resources in virtualized environments.
When seamlessly integrated with applications, virtual network interfaces play a pivotal role in elevating the overall efficiency and scalability of software systems. Utilizing these interfaces, applications operating on virtual machines can establish secure and isolated communication channels. This becomes especially crucial in cloud computing scenarios characterized by multi-tenancy.
Moreover, virtual network interfaces perform a significant role in constructing intricate network topologies, facilitating the incorporation of functionalities like load balancing, fault tolerance, and network segmentation.
 Virtual Network Interface Market Trend Analysis:
Increasing Adoption of Cloud Computing
- The market is experiencing significant growth, primarily driven by the widespread adoption of cloud computing. Businesses worldwide are increasingly acknowledging the transformative potential of cloud technologies in improving operational efficiency, scalability, and cost-effectiveness. Cloud computing offers a platform for organizations to delegate their computing and storage requirements to external service providers, relieving them of the responsibility of managing on-premises infrastructure. In this cloud-centric landscape, virtual network interfaces play a crucial role by facilitating smooth communication among virtual machines, applications, and the cloud infrastructure.
- Furthermore, the dynamic nature of cloud environments necessitates flexible and agile networking solutions, fueling the demand for virtual network interfaces. These interfaces empower organizations to create, modify, and delete network connections on the fly, aligning with the dynamic resource provisioning characteristic of cloud computing. As businesses embrace Infrastructure as a Service (IaaS), Platform as a Service (PaaS), and Software as a Service (SaaS) models within the cloud, the virtual network interface market is poised for further expansion, addressing the intricate networking needs of diverse cloud-based applications.
- The global reach and accessibility of the cloud also contribute to the market's growth, enabling businesses to establish a presence and connect seamlessly across geographical boundaries. This worldwide connectivity, combined with the ability to scale resources dynamically, positions virtual network interfaces as essential components in the cloud computing ecosystem. They solidify their role as key facilitators of modern, scalable, and efficient IT infrastructures.
Emergence of New Technologies
- The market is experiencing substantial growth opportunities with the advent of new technologies that continuously shape the networking and connectivity landscape. Innovations like 5G, edge computing, and the Internet of Things (IoT) are driving a fundamental change in networking needs, creating a demand for advanced solutions, including virtual network interfaces. The deployment of 5G networks has escalated the requirement for agile and flexible networking infrastructures to support the high-speed, low-latency connectivity promised by 5G. Virtual network interfaces seamlessly adapt to the dynamic and distributed nature of 5G environments, providing essential connectivity for a diverse range of applications.
- Edge computing, characterized by decentralized data processing at the network edge, is another technological trend creating opportunities for virtual network interfaces. As computing resources move closer to the point of data generation, the demand for efficient and scalable networking solutions intensifies. Virtual network interfaces play a crucial role in connecting and orchestrating communication between edge devices, ensuring seamless data flow and real-time responsiveness in distributed computing environments.
- Moreover, the widespread adoption of IoT devices across various industries opens new horizons for virtual network interfaces. The ability to create and manage virtual connections becomes crucial in handling the diverse and massive data flows generated by IoT devices. Virtual network interfaces provide the flexibility and scalability required to address the complex networking requirements of interconnected IoT ecosystems, presenting a lucrative opportunity for market growth in the era of pervasive connectivity and intelligent devices.
Virtual Network Interface Market Segment Analysis:
Virtual Network Interface Market Segmented on the basis of Component, Deployment, Enterprise Size and Application.
By Deployment, Cloud segment is expected to dominate the market during the forecast period
- The market is witnessing the ascendance of the cloud segment, driven by the widespread adoption of cloud computing across diverse industries. Organizations are increasingly acknowledging the benefits of migrating to the cloud, including improved scalability, cost-efficiency, and access to advanced computing resources. As businesses shift from traditional on-premises infrastructure to cloud-based solutions, the demand for virtual network interfaces rises. Cloud environments, whether public, private, or hybrid, heavily rely on virtual network interfaces to facilitate smooth communication between virtual machines and support dynamic resource allocation. This critical role positions the cloud segment as a primary catalyst for the market's growth, reflecting the ongoing digital transformation initiatives and the strategic move towards cloud-centric IT architectures.
- Furthermore, the global reach of the cloud and its ability to offer services on a pay-as-you-go basis contribute to its dominance. With the increasing adoption of Infrastructure as a Service (IaaS), Platform as a Service (PaaS), and Software as a Service (SaaS) models, virtual network interfaces become essential components, empowering organizations to construct agile, scalable, and interconnected infrastructures within the cloud ecosystem. As cloud adoption continues to surge, the dominance of the cloud segment in the virtual network interface market is anticipated to persist, shaping the trajectory of the industry's evolution.
By Enterprise Size, Large Enterprises segment held the largest share of 65.40% in 2022
- The largest market share was observed in the Large Enterprises segment, emphasizing the crucial role of virtual network interfaces in meeting the intricate networking requirements of sizable organizations. Large enterprises, equipped with extensive and complex IT infrastructures, utilize virtual network interfaces to improve operational efficiency, scalability, and resource utilization. Given the diverse applications and services operated within their networks, these organizations demand flexible and adaptable networking solutions, with virtual network interfaces playing a pivotal role in facilitating seamless communication among various components of their intricate networks to support the dynamic nature of large-scale operations.
- Moreover, the adoption of virtual network interfaces by large enterprises is motivated by the need to optimize costs and enhance the overall performance of their IT ecosystems. The scalability, agility, and cost-effectiveness offered by virtual network interfaces align with the strategic objectives of large enterprises aiming to streamline their networking capabilities. As these organizations continue to invest in the modernization of their IT infrastructure, the dominance of the Large Enterprises segment in the virtual network interface market is anticipated to endure, reflecting the evolving needs of expansive and dynamic business environments.
Virtual Network Interface Market Regional Insights:
North America is Expected to Dominate the Market Over the Forecast period
- North America is expected to lead the market, propelled by a robust technological infrastructure, widespread adoption of advanced networking solutions, and a thriving ecosystem of innovative enterprises. The region's mature IT landscape, combined with significant cloud adoption and digital transformation initiatives, positions it as a key market leader for virtual network interfaces. Across various industries, large-scale enterprises in North America leverage these interfaces to optimize network efficiency, ensure seamless communication in virtualized environments, and adapt to dynamic business requirements.
- Furthermore, the presence of major technology hubs and cloud service providers contributes to North America's prominence in the virtual network interface market. The region's inclination for early technology adoption and continuous innovation solidifies its position as a frontrunner. As businesses prioritize connectivity, scalability, and security, North America is expected to maintain its dominance, supported by ongoing investments in networking technologies and the widespread integration of virtual network interfaces across diverse industry verticals.
Key Players Covered in The Virtual Network Interface Market:
- Cisco Systems (U.S.)
- Adobe Systems (U.S.)
- Apple (U.S.)
- Hewlett Packard Enterprise Development LP (U.S.)
- VMware, Inc. (U.S.)
- Microsoft Corporation (U.S.)
- IBM Corporation (U.S.)
- Citrix Systems, Inc. (U.S.)
- Juniper Networks, Inc. (U.S.)
- Oracle (U.S.)
- Verizon Communications Inc. (U.S.)
- FireEye (U.S.)
- Zscaler (U.S.)
- Nutanix (U.S.)
- Ciena (U.S.)
- Radware (Israel)
- Palo Alto Networks (U.S.)
- Riverbed Technology (U.S.)
- Extreme Networks (U.S.)
- Huawei Technologies Co., Ltd. (China)
- Snail Mobile. (China)
- Asahi Net Inc. (Japan)
- LG Corporation (South Korea)
- Check Point Software Technologies (Israel)
- Radware (Israel)
- Exetel Pty Ltd (Australia) and Other Major Players
Key Industry Developments in the Virtual Network Interface Market:
- In January 2023, Huawei Technologies and the telecom company Etisalat UAE (e&) partnered. The 5G Portable Private Network MEC deployment and testing are the main goals of the collaboration. The business wants to offer Etisalat UAE consumers smart connectivity and cutting-edge digitalized solutions.
- In September 2023, a leading provider of cyber security solutions globally announced the acquisition of Atmosec. An early-stage start-up, Atmosec specializes in the rapid discovery and disconnection of malicious SaaS applications, preventing risky 3rd party SaaS communications, and rectifying SaaS misconfigurations. The move reinforces Check Point ‘s commitment to enhance its SaaS security offering and address the security gaps and blind spots in SaaS applications.
|
Virtual Network Interface Market |
|||
|
Base Year: |
2023 |
Forecast Period: |
2024-2032 |
|
Historical Data: |
2017 to 2023 |
Market Size in 2023: |
USD 39.31 Bn. |
|
Forecast Period 2024-32 CAGR: |
20.2% |
Market Size in 2032: |
USD 205.89 Bn. |
|
Segments Covered: |
By Component |
|
|
|
By Deployment |
|
||
|
By Enterprise Size |
|
||
|
By Application |
|
||
|
By Region |
|
||
|
Key Market Drivers: |
|
||
|
Key Market Restraints: |
|
||
|
Key Opportunities: |
|
||
|
Companies Covered in the report: |
|
||
Chapter 1: Introduction
1.1 Scope and Coverage
Chapter 2:Executive Summary
Chapter 3: Market Landscape
3.1 Market Dynamics
3.1.1 Drivers
3.1.2 Restraints
3.1.3 Opportunities
3.1.4 Challenges
3.2 Market Trend Analysis
3.3 PESTLE Analysis
3.4 Porter's Five Forces Analysis
3.5 Industry Value Chain Analysis
3.6 Ecosystem
3.7 Regulatory Landscape
3.8 Price Trend Analysis
3.9 Patent Analysis
3.10 Technology Evolution
3.11 Investment Pockets
3.12 Import-Export Analysis
Chapter 4: Virtual Network Interface Market by Component (2018-2032)
4.1 Virtual Network Interface Market Snapshot and Growth Engine
4.2 Market Overview
4.3 Hardware
4.3.1 Introduction and Market Overview
4.3.2 Historic and Forecasted Market Size in Value USD and Volume Units
4.3.3 Key Market Trends, Growth Factors, and Opportunities
4.3.4 Geographic Segmentation Analysis
4.4 Software
4.5 Services
Chapter 5: Virtual Network Interface Market by Deployment (2018-2032)
5.1 Virtual Network Interface Market Snapshot and Growth Engine
5.2 Market Overview
5.3 On-Premise
5.3.1 Introduction and Market Overview
5.3.2 Historic and Forecasted Market Size in Value USD and Volume Units
5.3.3 Key Market Trends, Growth Factors, and Opportunities
5.3.4 Geographic Segmentation Analysis
5.4 Cloud
Chapter 6: Virtual Network Interface Market by Enterprise Size (2018-2032)
6.1 Virtual Network Interface Market Snapshot and Growth Engine
6.2 Market Overview
6.3 Large Enterprises
6.3.1 Introduction and Market Overview
6.3.2 Historic and Forecasted Market Size in Value USD and Volume Units
6.3.3 Key Market Trends, Growth Factors, and Opportunities
6.3.4 Geographic Segmentation Analysis
6.4 Small & Medium Enterprises
Chapter 7: Virtual Network Interface Market by Application (2018-2032)
7.1 Virtual Network Interface Market Snapshot and Growth Engine
7.2 Market Overview
7.3 BFSI
7.3.1 Introduction and Market Overview
7.3.2 Historic and Forecasted Market Size in Value USD and Volume Units
7.3.3 Key Market Trends, Growth Factors, and Opportunities
7.3.4 Geographic Segmentation Analysis
7.4 Public Sector
7.5 Manufacturing
7.6 Media & Entertainment
7.7 Aerospace & Defense
Chapter 8: Company Profiles and Competitive Analysis
8.1 Competitive Landscape
8.1.1 Competitive Benchmarking
8.1.2 Virtual Network Interface Market Share by Manufacturer (2024)
8.1.3 Industry BCG Matrix
8.1.4 Heat Map Analysis
8.1.5 Mergers and Acquisitions
8.2 BOSE CORPORATION (U.S.)
8.2.1 Company Overview
8.2.2 Key Executives
8.2.3 Company Snapshot
8.2.4 Role of the Company in the Market
8.2.5 Sustainability and Social Responsibility
8.2.6 Operating Business Segments
8.2.7 Product Portfolio
8.2.8 Business Performance
8.2.9 Key Strategic Moves and Recent Developments
8.2.10 SWOT Analysis
8.3 APPLE INC. (U.S.)
8.4 HARMAN INTERNATIONAL (U.S.)
8.5 SONOS INC.(US)
8.6 MASIMO (US)
8.7 VOXX INTERNATIONAL CORP. (US)
8.8 SUPERSONIC (U.S.)
8.9 JAWBONE (U.S.)
8.10 BRAVEN (U.S.)
8.11 DENON ELECTRONICS (U.S.)
8.12 BEATS ELECTRONICS (U.S.)
8.13 LOGITECH INTERNATIONAL S.A. (SWITZERLAND)
8.14 BANG & OLUFSEN (DENMARK)
8.15 BOWERS & WILKINS (UK)
8.16 KONINKLIJKE PHILIPS N.V. (NETHERLAND)
8.17 SENNHEISER (GERMANY)
8.18 HUAWEI INVESTMENT & HOLDING COLTD. (CHINA)
8.19 SONY CORPORATION (JAPAN)
8.20 PANASONIC HOLDINGS CORPORATION (JAPAN)
8.21 PIONEER CORPORATION (JAPAN)
8.22 JVC KENWOOD (JAPAN)
8.23 SAMSUNG ELECTRONICS COLTD. (SOUTH KOREA)
8.24 LG ELECTRONICS (SOUTH KOREA)
8.25 CREATIVE TECHNOLOGY (SINGAPORE)
8.26
Chapter 9: Global Virtual Network Interface Market By Region
9.1 Overview
9.2. North America Virtual Network Interface Market
9.2.1 Key Market Trends, Growth Factors and Opportunities
9.2.2 Top Key Companies
9.2.3 Historic and Forecasted Market Size by Segments
9.2.4 Historic and Forecasted Market Size by Component
9.2.4.1 Hardware
9.2.4.2 Software
9.2.4.3 Services
9.2.5 Historic and Forecasted Market Size by Deployment
9.2.5.1 On-Premise
9.2.5.2 Cloud
9.2.6 Historic and Forecasted Market Size by Enterprise Size
9.2.6.1 Large Enterprises
9.2.6.2 Small & Medium Enterprises
9.2.7 Historic and Forecasted Market Size by Application
9.2.7.1 BFSI
9.2.7.2 Public Sector
9.2.7.3 Manufacturing
9.2.7.4 Media & Entertainment
9.2.7.5 Aerospace & Defense
9.2.8 Historic and Forecast Market Size by Country
9.2.8.1 US
9.2.8.2 Canada
9.2.8.3 Mexico
9.3. Eastern Europe Virtual Network Interface Market
9.3.1 Key Market Trends, Growth Factors and Opportunities
9.3.2 Top Key Companies
9.3.3 Historic and Forecasted Market Size by Segments
9.3.4 Historic and Forecasted Market Size by Component
9.3.4.1 Hardware
9.3.4.2 Software
9.3.4.3 Services
9.3.5 Historic and Forecasted Market Size by Deployment
9.3.5.1 On-Premise
9.3.5.2 Cloud
9.3.6 Historic and Forecasted Market Size by Enterprise Size
9.3.6.1 Large Enterprises
9.3.6.2 Small & Medium Enterprises
9.3.7 Historic and Forecasted Market Size by Application
9.3.7.1 BFSI
9.3.7.2 Public Sector
9.3.7.3 Manufacturing
9.3.7.4 Media & Entertainment
9.3.7.5 Aerospace & Defense
9.3.8 Historic and Forecast Market Size by Country
9.3.8.1 Russia
9.3.8.2 Bulgaria
9.3.8.3 The Czech Republic
9.3.8.4 Hungary
9.3.8.5 Poland
9.3.8.6 Romania
9.3.8.7 Rest of Eastern Europe
9.4. Western Europe Virtual Network Interface Market
9.4.1 Key Market Trends, Growth Factors and Opportunities
9.4.2 Top Key Companies
9.4.3 Historic and Forecasted Market Size by Segments
9.4.4 Historic and Forecasted Market Size by Component
9.4.4.1 Hardware
9.4.4.2 Software
9.4.4.3 Services
9.4.5 Historic and Forecasted Market Size by Deployment
9.4.5.1 On-Premise
9.4.5.2 Cloud
9.4.6 Historic and Forecasted Market Size by Enterprise Size
9.4.6.1 Large Enterprises
9.4.6.2 Small & Medium Enterprises
9.4.7 Historic and Forecasted Market Size by Application
9.4.7.1 BFSI
9.4.7.2 Public Sector
9.4.7.3 Manufacturing
9.4.7.4 Media & Entertainment
9.4.7.5 Aerospace & Defense
9.4.8 Historic and Forecast Market Size by Country
9.4.8.1 Germany
9.4.8.2 UK
9.4.8.3 France
9.4.8.4 The Netherlands
9.4.8.5 Italy
9.4.8.6 Spain
9.4.8.7 Rest of Western Europe
9.5. Asia Pacific Virtual Network Interface Market
9.5.1 Key Market Trends, Growth Factors and Opportunities
9.5.2 Top Key Companies
9.5.3 Historic and Forecasted Market Size by Segments
9.5.4 Historic and Forecasted Market Size by Component
9.5.4.1 Hardware
9.5.4.2 Software
9.5.4.3 Services
9.5.5 Historic and Forecasted Market Size by Deployment
9.5.5.1 On-Premise
9.5.5.2 Cloud
9.5.6 Historic and Forecasted Market Size by Enterprise Size
9.5.6.1 Large Enterprises
9.5.6.2 Small & Medium Enterprises
9.5.7 Historic and Forecasted Market Size by Application
9.5.7.1 BFSI
9.5.7.2 Public Sector
9.5.7.3 Manufacturing
9.5.7.4 Media & Entertainment
9.5.7.5 Aerospace & Defense
9.5.8 Historic and Forecast Market Size by Country
9.5.8.1 China
9.5.8.2 India
9.5.8.3 Japan
9.5.8.4 South Korea
9.5.8.5 Malaysia
9.5.8.6 Thailand
9.5.8.7 Vietnam
9.5.8.8 The Philippines
9.5.8.9 Australia
9.5.8.10 New Zealand
9.5.8.11 Rest of APAC
9.6. Middle East & Africa Virtual Network Interface Market
9.6.1 Key Market Trends, Growth Factors and Opportunities
9.6.2 Top Key Companies
9.6.3 Historic and Forecasted Market Size by Segments
9.6.4 Historic and Forecasted Market Size by Component
9.6.4.1 Hardware
9.6.4.2 Software
9.6.4.3 Services
9.6.5 Historic and Forecasted Market Size by Deployment
9.6.5.1 On-Premise
9.6.5.2 Cloud
9.6.6 Historic and Forecasted Market Size by Enterprise Size
9.6.6.1 Large Enterprises
9.6.6.2 Small & Medium Enterprises
9.6.7 Historic and Forecasted Market Size by Application
9.6.7.1 BFSI
9.6.7.2 Public Sector
9.6.7.3 Manufacturing
9.6.7.4 Media & Entertainment
9.6.7.5 Aerospace & Defense
9.6.8 Historic and Forecast Market Size by Country
9.6.8.1 Turkiye
9.6.8.2 Bahrain
9.6.8.3 Kuwait
9.6.8.4 Saudi Arabia
9.6.8.5 Qatar
9.6.8.6 UAE
9.6.8.7 Israel
9.6.8.8 South Africa
9.7. South America Virtual Network Interface Market
9.7.1 Key Market Trends, Growth Factors and Opportunities
9.7.2 Top Key Companies
9.7.3 Historic and Forecasted Market Size by Segments
9.7.4 Historic and Forecasted Market Size by Component
9.7.4.1 Hardware
9.7.4.2 Software
9.7.4.3 Services
9.7.5 Historic and Forecasted Market Size by Deployment
9.7.5.1 On-Premise
9.7.5.2 Cloud
9.7.6 Historic and Forecasted Market Size by Enterprise Size
9.7.6.1 Large Enterprises
9.7.6.2 Small & Medium Enterprises
9.7.7 Historic and Forecasted Market Size by Application
9.7.7.1 BFSI
9.7.7.2 Public Sector
9.7.7.3 Manufacturing
9.7.7.4 Media & Entertainment
9.7.7.5 Aerospace & Defense
9.7.8 Historic and Forecast Market Size by Country
9.7.8.1 Brazil
9.7.8.2 Argentina
9.7.8.3 Rest of SA
Chapter 10 Analyst Viewpoint and Conclusion
10.1 Recommendations and Concluding Analysis
10.2 Potential Market Strategies
Chapter 11 Research Methodology
11.1 Research Process
11.2 Primary Research
11.3 Secondary Research
|
Virtual Network Interface Market |
|||
|
Base Year: |
2023 |
Forecast Period: |
2024-2032 |
|
Historical Data: |
2017 to 2023 |
Market Size in 2023: |
USD 39.31 Bn. |
|
Forecast Period 2024-32 CAGR: |
20.2% |
Market Size in 2032: |
USD 205.89 Bn. |
|
Segments Covered: |
By Component |
|
|
|
By Deployment |
|
||
|
By Enterprise Size |
|
||
|
By Application |
|
||
|
By Region |
|
||
|
Key Market Drivers: |
|
||
|
Key Market Restraints: |
|
||
|
Key Opportunities: |
|
||
|
Companies Covered in the report: |
|
||


