


Sustainable Tourism Market Synopsis
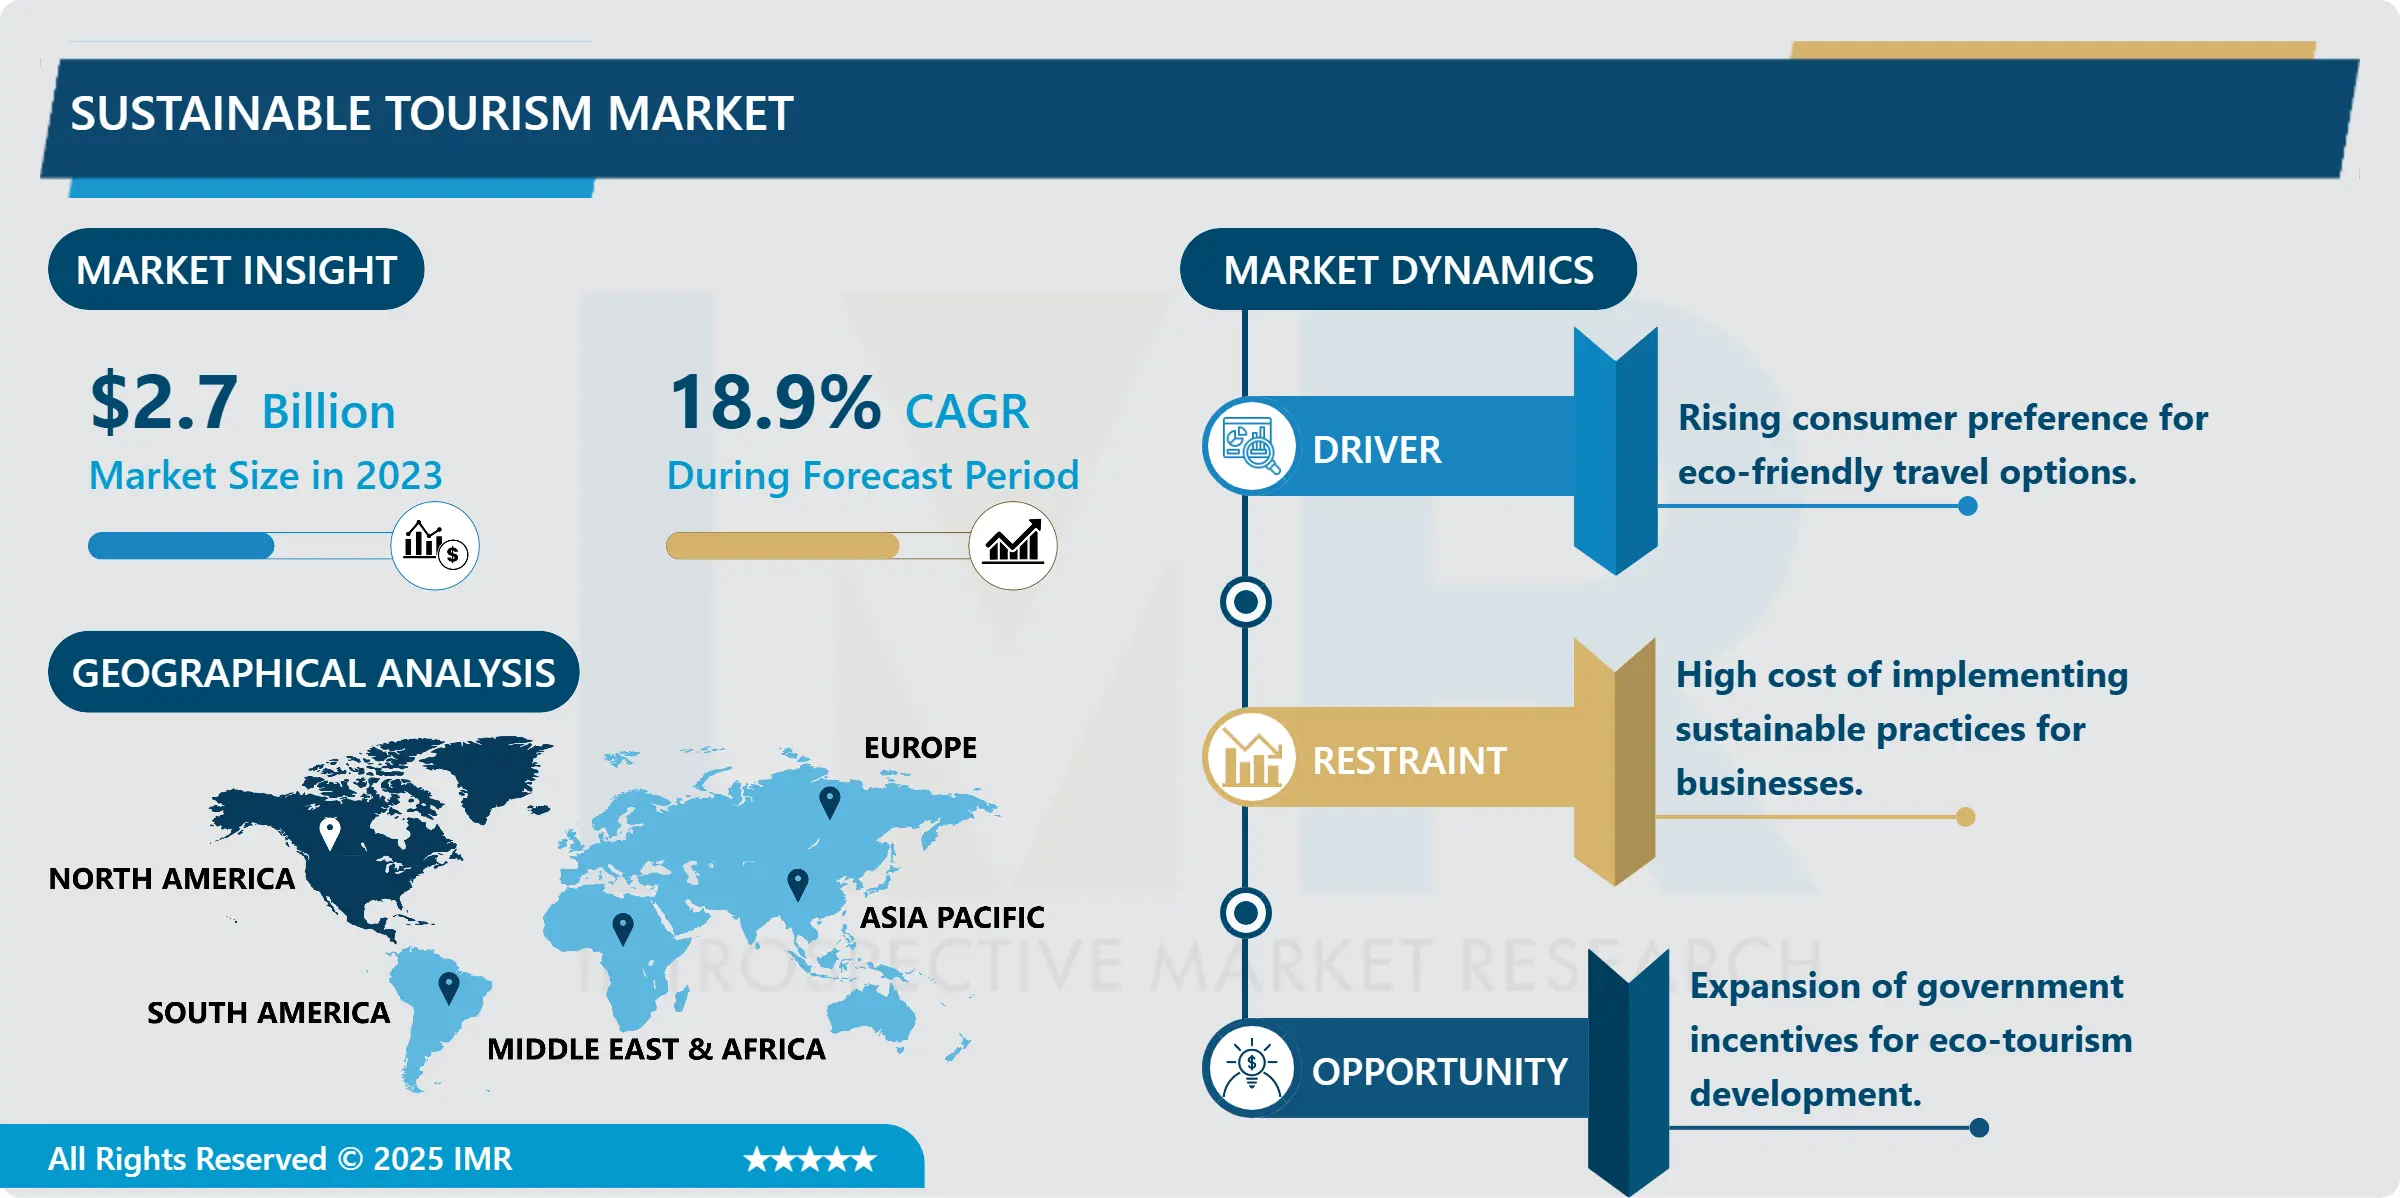
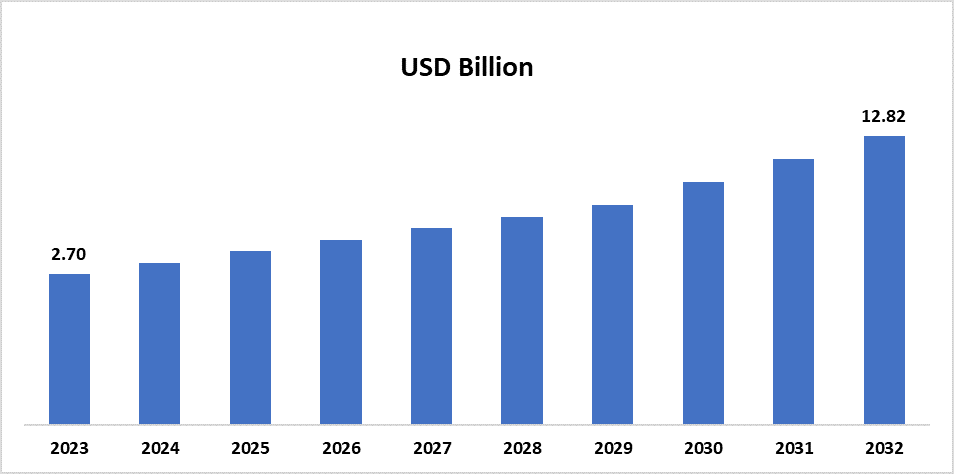
Sustainable Tourism Market Size Was Valued at USD 2.70 Billion in 2023 and is Projected to Reach USD 12.82 Billion by 2032, Growing at a CAGR of 18.9 % From 2024-2032.
The Sustainable Tourism Market keeps tourists’ activities which enhance the sustainable use of natural and cultural resources without negatively impacting the tourist attractions. This market promotes sustainable travel, local consumption, green products during tourism renewable resources and energy, minimal rubbish, and support of the local community.
The sustainable tourism market remains the only possible market and is growing at a high pace as concerns about environmental impacts continue to grow and more travelers want to be responsible tourists. Local governments and organizational institutions all over the globe are focusing on sustainability and anti-collution hence bringing new policies and certifications on Sustainable tourism. Sustainable tourism transformations are being implemented in different kinds of tourists, including adventure, luxury, family, etc., to develop new transportation, hotels, and tourist activities.
It also seems that tourists are focusing on social values for their trips include the likes of eco-tourism, cultural tourism, and wildlife conservation tourism. Firms are adapting activities tailored to this need through green lodging, low-carbon travel and educational tours. This is has been compounded by the use of social media platform which the traveler uses to share their experiences thus encouraging others to use sustainable means of transport.
Sustainable Tourism Market Trend Analysis
Integration of Smart Technology in Sustainable Tourism
-
Advanced solutions are transforming the SST by enhancing market opportunity. Alongside products to reduce carbon emissions to gizmos that map out the greenest of routes in terms of travel, technology is making it easier for the traveler to make sustainable choices. Currently, destinations are using IoT devices to understand the environment outcomes, and resource consumption while accessing ways to control the tourist crowd. Ky hotels and restaurants are incorporating smart energy and water management systems, technologies that save water, and environmental management to increase guest convenience and reduce environmental impact. This trend is in line with the increasing demand for convenience more so when designing and developing products that will be friendly to the environment.
Rise of Community-Based Tourism
-
The travel industry is one of many significant opportunities as far as sustainable tourism is concerned. People tend to travel for experiences and for such experiences to be real, they need to share experiences with and from people, their culture, and/or economy. Through inclusive tourism, there are opportunities such as hosting, product sales that areCraft Villages, and Cultural & Historical Tours. Governments and non-profits are also using handsome amounts to build the required infrastructure and train local communities making it a win-win situation for travelers, locals, and the environment.
Sustainable Tourism Market Outlook, 2023 and 2032: Future Outlook
Sustainable Tourism Market Segment Analysis:
Sustainable Tourism Market Segmented on the basis of type, traveller type, and age group.
By Type, Coastal tourism segment is expected to dominate the market during the forecast period
-
It is expected that the coastal tourism segment will have the largest market share in the sustainable tourism market during the forecasting period. The coastal region is important to people because they are scenic, provides recreation and is biologically productive. However, the enhancement on sustainable development has altered coastal tourism in particular with aspects such as coral reef conservation programs, marine conservation, and pollution control. Many resorts and tour operators are adopting green practices to contribute to the protection and sustainability including renewable energy, responsible diving, and limiting the use of plastics. That is why coastal tourism can be regarded as a key segment that has a powerful influence on further economic growth and development.
By Traveller Type, the family segment is expected to hold the largest share
-
Regarding the segmentation of the sustainable tourism market, the **family segment** will be a leader and expect to have the maximum share of the market. They decided that families more and more choose either places or activities that are educational, not destructive to the environment, and that reflect cultural heritage. Families are met by eco-lodges, national parks, and community-based tourism experiences that can create memorable experiences when a child and parent or sibling are together. Travel agents are planning family-oriented programs where kids are offered simple interests including nature walks, wildlife watching, and cultural troupes. This segment is also more resilient to the vagaries of income and geographical location because it targets many people.
Sustainable Tourism Market Regional Insights:
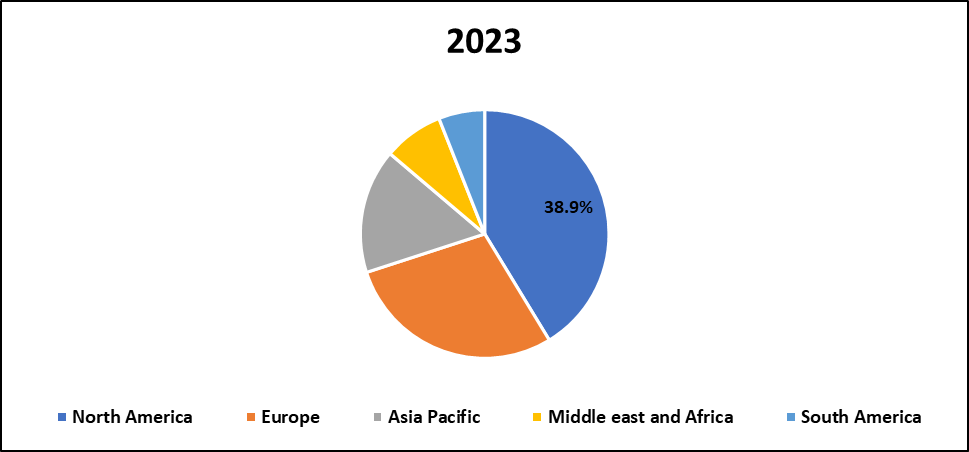
North America is Expected to Dominate the Market Over the Forecast period
-
It is also estimated that during the same period, North America will remain the largest market for sustainable tourism due to perfect environmental protection policies, well-developed tourism facilities, and enhanced customers demand. The United States and specifically Canada take one of the leading positions in the development of eco-tourism and certification programs for travel and hospitality industries. These countries have developed their parks and reserves, used local conservation, and developed travel-friendly green transport systems. Also, North America boasts of natural and culture-related tourist attractions as a sustainable form of tourism.
- Other supporting technologies for this market in North America include carbon offset platforms as well as digital travel guides which make this market even more competitive. Grant plans for the development of sustainability in the tourist environments and cooperation that has been established with private companies have aided the advancement of novel concepts and adaptability. Furthermore, the sources established that North American traveling consumers are also demanding sustainably made services and products thus hastening the setting of world standards.
Sustainable Tourism Market Share, by Geography, 2023 (%)
Active Key Players in the Sustainable Tourism Market
-
Accor (France)
- Airbnb (United States)
- Banyan Tree Holdings (Singapore)
- Carnival Corporation (United States)
- Expedia Group (United States)
- G Adventures (Canada)
- Hilton Worldwide (United States)
- Intrepid Group (Australia)
- Marriott International (United States)
- Responsible Travel (United Kingdom)
- Royal Caribbean Cruises Ltd. (United States)
- The Travel Corporation (United Kingdom)
- TUI Group (Germany)
- Virgin Holidays (United Kingdom)
- Wyndham Destinations (United States)
- Other key Players
|
Global Sustainable Tourism Market |
|||
|
Base Year: |
2023 |
Forecast Period: |
2024-2032 |
|
Historical Data: |
2017 to 2023 |
Market Size in 2023: |
USD 2.70 Billion |
|
Forecast Period 2024-32 CAGR: |
18.9 % |
Market Size in 2032: |
USD 12.82 Billion |
|
Segments Covered: |
By Type |
|
|
|
By Traveler Type |
|
||
|
By Age Group |
|
||
|
By Region |
|
||
|
Key Market Drivers: |
|
||
|
Key Market Restraints: |
|
||
|
Key Opportunities: |
|
||
|
Companies Covered in the report: |
|
||
Chapter 1: Introduction
1.1 Scope and Coverage
Chapter 2:Executive Summary
Chapter 3: Market Landscape
3.1 Market Dynamics
3.1.1 Drivers
3.1.2 Restraints
3.1.3 Opportunities
3.1.4 Challenges
3.2 Market Trend Analysis
3.3 PESTLE Analysis
3.4 Porter's Five Forces Analysis
3.5 Industry Value Chain Analysis
3.6 Ecosystem
3.7 Regulatory Landscape
3.8 Price Trend Analysis
3.9 Patent Analysis
3.10 Technology Evolution
3.11 Investment Pockets
3.12 Import-Export Analysis
Chapter 4: Sustainable Tourism Market by Material Type
4.1 Sustainable Tourism Market Snapshot and Growth Engine
4.2 Sustainable Tourism Market Overview
4.3 Polyvinyl & Cellulose Acetate Ethyl & Methyl Cellulose Methacrylic Acid Polyethylene Glycol Others
4.3.1 Introduction and Market Overview
4.3.2 Historic and Forecasted Market Size in Value USD and Volume Units (2017-2032F)
4.3.3 Key Market Trends, Growth Factors and Opportunities
4.3.4 Polyvinyl & Cellulose Acetate Ethyl & Methyl Cellulose Methacrylic Acid Polyethylene Glycol Others: Geographic Segmentation Analysis
Chapter 5: Sustainable Tourism Market by Application
5.1 Sustainable Tourism Market Snapshot and Growth Engine
5.2 Sustainable Tourism Market Overview
5.3 In Vitro In Vivo
5.3.1 Introduction and Market Overview
5.3.2 Historic and Forecasted Market Size in Value USD and Volume Units (2017-2032F)
5.3.3 Key Market Trends, Growth Factors and Opportunities
5.3.4 In Vitro In Vivo: Geographic Segmentation Analysis
Chapter 6: Sustainable Tourism Market by Substrate
6.1 Sustainable Tourism Market Snapshot and Growth Engine
6.2 Sustainable Tourism Market Overview
6.3 Tablets Capsules Pills
6.3.1 Introduction and Market Overview
6.3.2 Historic and Forecasted Market Size in Value USD and Volume Units (2017-2032F)
6.3.3 Key Market Trends, Growth Factors and Opportunities
6.3.4 Tablets Capsules Pills: Geographic Segmentation Analysis
Chapter 7: Company Profiles and Competitive Analysis
7.1 Competitive Landscape
7.1.1 Competitive Benchmarking
7.1.2 Sustainable Tourism Market Share by Manufacturer (2023)
7.1.3 Industry BCG Matrix
7.1.4 Heat Map Analysis
7.1.5 Mergers and Acquisitions
7.2 ACCOR (FRANCE)
7.2.1 Company Overview
7.2.2 Key Executives
7.2.3 Company Snapshot
7.2.4 Role of the Company in the Market
7.2.5 Sustainability and Social Responsibility
7.2.6 Operating Business Segments
7.2.7 Product Portfolio
7.2.8 Business Performance
7.2.9 Key Strategic Moves and Recent Developments
7.2.10 SWOT Analysis
7.3 AIRBNB (UNITED STATES)
7.4 BANYAN TREE HOLDINGS (SINGAPORE)
7.5 CARNIVAL CORPORATION (UNITED STATES)
7.6 EXPEDIA GROUP (UNITED STATES)
7.7 G ADVENTURES (CANADA)
7.8 HILTON WORLDWIDE (UNITED STATES)
7.9 INTREPID GROUP (AUSTRALIA)
7.10 MARRIOTT INTERNATIONAL (UNITED STATES)
7.11 RESPONSIBLE TRAVEL (UNITED KINGDOM)
7.12 ROYAL CARIBBEAN CRUISES LTD. (UNITED STATES)
7.13 THE TRAVEL CORPORATION (UNITED KINGDOM)
7.14 TUI GROUP (GERMANY)
7.15 VIRGIN HOLIDAYS (UNITED KINGDOM)
7.16 WYNDHAM DESTINATIONS (UNITED STATES)
7.17 OTHER ACTIVE PLAYERS
Chapter 8: Global Sustainable Tourism Market By Region
8.1 Overview
8.2. North America Sustainable Tourism Market
8.2.1 Key Market Trends, Growth Factors and Opportunities
8.2.2 Top Key Companies
8.2.3 Historic and Forecasted Market Size by Segments
8.2.4 Historic and Forecasted Market Size By Material Type
8.2.4.1 Polyvinyl & Cellulose Acetate Ethyl & Methyl Cellulose Methacrylic Acid Polyethylene Glycol Others
8.2.5 Historic and Forecasted Market Size By Application
8.2.5.1 In Vitro In Vivo
8.2.6 Historic and Forecasted Market Size By Substrate
8.2.6.1 Tablets Capsules Pills
8.2.7 Historic and Forecast Market Size by Country
8.2.7.1 US
8.2.7.2 Canada
8.2.7.3 Mexico
8.3. Eastern Europe Sustainable Tourism Market
8.3.1 Key Market Trends, Growth Factors and Opportunities
8.3.2 Top Key Companies
8.3.3 Historic and Forecasted Market Size by Segments
8.3.4 Historic and Forecasted Market Size By Material Type
8.3.4.1 Polyvinyl & Cellulose Acetate Ethyl & Methyl Cellulose Methacrylic Acid Polyethylene Glycol Others
8.3.5 Historic and Forecasted Market Size By Application
8.3.5.1 In Vitro In Vivo
8.3.6 Historic and Forecasted Market Size By Substrate
8.3.6.1 Tablets Capsules Pills
8.3.7 Historic and Forecast Market Size by Country
8.3.7.1 Russia
8.3.7.2 Bulgaria
8.3.7.3 The Czech Republic
8.3.7.4 Hungary
8.3.7.5 Poland
8.3.7.6 Romania
8.3.7.7 Rest of Eastern Europe
8.4. Western Europe Sustainable Tourism Market
8.4.1 Key Market Trends, Growth Factors and Opportunities
8.4.2 Top Key Companies
8.4.3 Historic and Forecasted Market Size by Segments
8.4.4 Historic and Forecasted Market Size By Material Type
8.4.4.1 Polyvinyl & Cellulose Acetate Ethyl & Methyl Cellulose Methacrylic Acid Polyethylene Glycol Others
8.4.5 Historic and Forecasted Market Size By Application
8.4.5.1 In Vitro In Vivo
8.4.6 Historic and Forecasted Market Size By Substrate
8.4.6.1 Tablets Capsules Pills
8.4.7 Historic and Forecast Market Size by Country
8.4.7.1 Germany
8.4.7.2 UK
8.4.7.3 France
8.4.7.4 The Netherlands
8.4.7.5 Italy
8.4.7.6 Spain
8.4.7.7 Rest of Western Europe
8.5. Asia Pacific Sustainable Tourism Market
8.5.1 Key Market Trends, Growth Factors and Opportunities
8.5.2 Top Key Companies
8.5.3 Historic and Forecasted Market Size by Segments
8.5.4 Historic and Forecasted Market Size By Material Type
8.5.4.1 Polyvinyl & Cellulose Acetate Ethyl & Methyl Cellulose Methacrylic Acid Polyethylene Glycol Others
8.5.5 Historic and Forecasted Market Size By Application
8.5.5.1 In Vitro In Vivo
8.5.6 Historic and Forecasted Market Size By Substrate
8.5.6.1 Tablets Capsules Pills
8.5.7 Historic and Forecast Market Size by Country
8.5.7.1 China
8.5.7.2 India
8.5.7.3 Japan
8.5.7.4 South Korea
8.5.7.5 Malaysia
8.5.7.6 Thailand
8.5.7.7 Vietnam
8.5.7.8 The Philippines
8.5.7.9 Australia
8.5.7.10 New Zealand
8.5.7.11 Rest of APAC
8.6. Middle East & Africa Sustainable Tourism Market
8.6.1 Key Market Trends, Growth Factors and Opportunities
8.6.2 Top Key Companies
8.6.3 Historic and Forecasted Market Size by Segments
8.6.4 Historic and Forecasted Market Size By Material Type
8.6.4.1 Polyvinyl & Cellulose Acetate Ethyl & Methyl Cellulose Methacrylic Acid Polyethylene Glycol Others
8.6.5 Historic and Forecasted Market Size By Application
8.6.5.1 In Vitro In Vivo
8.6.6 Historic and Forecasted Market Size By Substrate
8.6.6.1 Tablets Capsules Pills
8.6.7 Historic and Forecast Market Size by Country
8.6.7.1 Turkiye
8.6.7.2 Bahrain
8.6.7.3 Kuwait
8.6.7.4 Saudi Arabia
8.6.7.5 Qatar
8.6.7.6 UAE
8.6.7.7 Israel
8.6.7.8 South Africa
8.7. South America Sustainable Tourism Market
8.7.1 Key Market Trends, Growth Factors and Opportunities
8.7.2 Top Key Companies
8.7.3 Historic and Forecasted Market Size by Segments
8.7.4 Historic and Forecasted Market Size By Material Type
8.7.4.1 Polyvinyl & Cellulose Acetate Ethyl & Methyl Cellulose Methacrylic Acid Polyethylene Glycol Others
8.7.5 Historic and Forecasted Market Size By Application
8.7.5.1 In Vitro In Vivo
8.7.6 Historic and Forecasted Market Size By Substrate
8.7.6.1 Tablets Capsules Pills
8.7.7 Historic and Forecast Market Size by Country
8.7.7.1 Brazil
8.7.7.2 Argentina
8.7.7.3 Rest of SA
Chapter 9 Analyst Viewpoint and Conclusion
9.1 Recommendations and Concluding Analysis
9.2 Potential Market Strategies
Chapter 10 Research Methodology
10.1 Research Process
10.2 Primary Research
10.3 Secondary Research
|
Global Sustainable Tourism Market |
|||
|
Base Year: |
2023 |
Forecast Period: |
2024-2032 |
|
Historical Data: |
2017 to 2023 |
Market Size in 2023: |
USD 2.70 Billion |
|
Forecast Period 2024-32 CAGR: |
18.9 % |
Market Size in 2032: |
USD 12.82 Billion |
|
Segments Covered: |
By Type |
|
|
|
By Traveler Type |
|
||
|
By Age Group |
|
||
|
By Region |
|
||
|
Key Market Drivers: |
|
||
|
Key Market Restraints: |
|
||
|
Key Opportunities: |
|
||
|
Companies Covered in the report: |
|
||


