


Smart Agriculture Solution Market Synopsis:
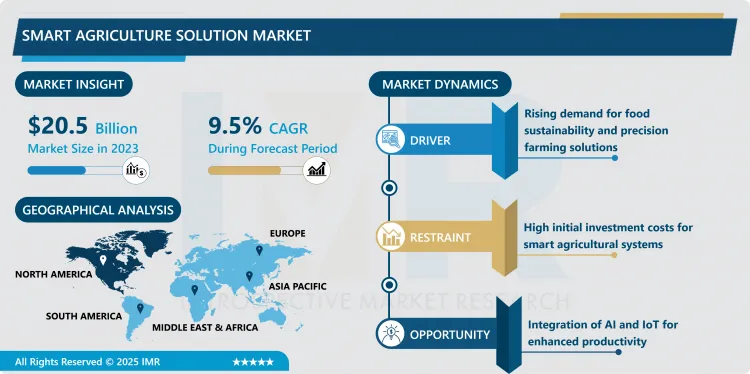
Smart Agriculture Solution Market Size Was Valued at USD 20.5 Billion in 2023, and is Projected to Reach USD 46.3 Billion by 2032, Growing at a CAGR of 9.5% From 2024-2032.
The Smart Agriculture Solution Market symbolizes the deployment of the Internet of Things, Artificial Intelligence, Data Analytics, Robotics, and Precision Agriculture Techniques to enhance Agriculture Operations, Quantity, and Quality. Such solutions range from hardware and software platforms to services whose amalgamation provides real-time management and control of farming activity – including crop growing, livestock tracking, irrigation, and pest control among others. With the help of real-time data, big data, and automatic machinery smart agriculture solutions facilitate the minimization of wastage and the increase of productivity, and the improvement of adaptation to climatic fluctuations.
The Smart Agriculture Solution Market has been growing greatly over the past few years due to the need to feed a fast-growing global population, the limited Available land for farming and the sustainability goals for smart farming. Predominantly, there is the use of GPS tractors, remote sensing, application, and internet of things devices to facilitate farmers in decision making for increased productivity. It also enjoys governmental supports including stimulus for precision farming and support for the application of high-tech solutions in agriculture.
In addition, the penetration of smart agriculture solutions is growing in the developed as well as developing nations. Modern industrialized farmers in developed markets are using modern technological innovation to boost their production, and smallholder farmers in developing nations are embracing these technologies to boost production against adversities from climate change. Therefore, the smart agriculture sector is placed at the forefront of innovation move in the supply chain for food in the global market.

Smart Smart Agriculture Solution Market Trend Analysis:
Adoption of AI and IoT in Farming
- AI and IoT merger is another trend in the Smart Agriculture Solution Market this being a fusion of artificial intelligence and IoT. Nowadays, there are more and more applications utilizing AI to monitor crop health and predict yields and diseases. At the same time, other internet-connected devices like soil moisture sensors, weather station and smart irrigation systems are relieving real data collection thus improving the decision-making process without wasting resources. It also propagates the integration of AI with IoT to enable farmers move from the labour intensive forms of farming to hi-tech farming that incorporates the use of technological machines and initiatives thus enhancing productivity and profitability of farming.
Rising Demand for Precision Farming
- Precision farming segment is a material prospect in the smart agriculture market due to the increasing trend towards high accuracy. Precision farming, therefore, encompasses the technical application of information technology in the control of key input such as water, fertilizers and pesticides at an infinitesimal level. Not only does this practice enhance an increase in yield and reduced yield gaps, but it also affords environmental gains because optimization does not involve overutilization of resources. Precision farming solutions are widely anticipated to serve as the backbone of modern agriculture amid growing global focus on food insecurity and sustainability, hence the increasing attraction to governments, agribusinesses, as well as technology suppliers.
Smart Agriculture Solution Market Segment Analysis:
Smart Agriculture Solution Market is Segmented on the basis of Component Type, application.
By Component Type, Hardware segment is expected to dominate the market during the forecast period
- Among the hardware solutions sector smart sensors, GPS devices, drones, and automated machinery are foreseen to have a significant impact on each segment of the Smart Agriculture Solution Market throughout the duration of the forecast period. Smart farming is supported by these devices that help collect requisite parameters like soil health, climate, and plant growth to help the farmers. The low cost of these devices is further encouraging their uptake in small and large farms across the world.
- And growth that has been driven by developing hardware technologies as drone imaging for aerial surveys and twine casing sensors for use in abrasive agri cultures. The requirement for the consumer hardware solutions is high in those areas where large amount of agricultural fields is available and in the areas where automation is replacing conventional farming.
By Application, Automated Machinery Guidance Control segment expected to held the largest share
- Automated Machinery Guidance Control segment is expected to be the largest market within the Smart Agriculture Solution Market. This application entails the use of self-driving and partial-driving equipment fitted with GPS, sensors as well as advanced mechanisms of artificial intelligence to plant, harvest and irrigate the crops with a lot of accuracy. This segment has turned out to attract farmers across the globe by offering other advantages such as low on labor cost, high operation efficiency and low on errors.
- Furthermore, as labour scarcities and increasing costs begin to impact on agriculture, automatic machinery guidance control system are unavoidable. They not only increase production but at the same time they increase the probabilities of being able to undertake farming activities regardless the state of the climate.
Smart Agriculture Solution Market Regional Insights:
North America is Expected to Dominate the Market Over the Forecast period
- However, in the year 2023, the North American region remained the largest spot in the Smart Agriculture Solution Market with around 35% of overall market share. This region leadership can be attributed to high technology innovation in farming, investments in technology and development and supportive government laws on precision farming. The United States has been at the forefront particularly due to the large scale application of smart devices IoT connected, drones and autonomous machinery in large scale commercial farms. In addition, there are significant big players in this market and advanced technological platforms in North America that locked this market’s place as World Leader.
Active Key Players in the Smart Agriculture Solution Market:
- AGCO Corporation (United States)
- Ag Leader Technology (United States)
- BASF SE (Germany)
- Bayer AG (Germany)
- CNH Industrial N.V. (United Kingdom)
- Deere & Company (United States)
- DICKEY-john Corporation (United States)
- Kubota Corporation (Japan)
- Raven Industries (United States)
- SemiosBio Technologies (Canada)
- SST Software (United States)
- Syngenta AG (Switzerland)
- Topcon Positioning Systems, Inc. (United States)
- Trimble Inc. (United States)
- Yara International ASA (Norway), and Other Active Players.
|
Global Smart Agriculture Solution Market |
|||
|
Base Year: |
2023 |
Forecast Period: |
2024-2032 |
|
Historical Data: |
2017 to 2023 |
Market Size in 2023: |
USD 20.5 Billion |
|
Forecast Period 2024-32 CAGR: |
9.5% |
Market Size in 2032: |
USD 46.3 Billion |
|
Segments Covered: |
By Component Type |
|
|
|
By Application |
|
||
|
By Region |
|
||
|
Key Market Drivers: |
|
||
|
Key Market Restraints: |
|
||
|
Key Opportunities: |
|
||
|
Companies Covered in the report: |
|
||
Chapter 1: Introduction
1.1 Scope and Coverage
Chapter 2:Executive Summary
Chapter 3: Market Landscape
3.1 Market Dynamics
3.1.1 Drivers
3.1.2 Restraints
3.1.3 Opportunities
3.1.4 Challenges
3.2 Market Trend Analysis
3.3 PESTLE Analysis
3.4 Porter's Five Forces Analysis
3.5 Industry Value Chain Analysis
3.6 Ecosystem
3.7 Regulatory Landscape
3.8 Price Trend Analysis
3.9 Patent Analysis
3.10 Technology Evolution
3.11 Investment Pockets
3.12 Import-Export Analysis
Chapter 4: Smart Agriculture Solution Market by Component Type (2018-2032)
4.1 Smart Agriculture Solution Market Snapshot and Growth Engine
4.2 Market Overview
4.3 Hardware
4.3.1 Introduction and Market Overview
4.3.2 Historic and Forecasted Market Size in Value USD and Volume Units
4.3.3 Key Market Trends, Growth Factors, and Opportunities
4.3.4 Geographic Segmentation Analysis
4.4 Software
4.5 Services
Chapter 5: Smart Agriculture Solution Market by Application (2018-2032)
5.1 Smart Agriculture Solution Market Snapshot and Growth Engine
5.2 Market Overview
5.3 Automated Machinery Guidance Control
5.3.1 Introduction and Market Overview
5.3.2 Historic and Forecasted Market Size in Value USD and Volume Units
5.3.3 Key Market Trends, Growth Factors, and Opportunities
5.3.4 Geographic Segmentation Analysis
5.4 Tractor Collision and Obstacle Detection
5.5 Machinery Safety and Parameter Monitoring
5.6 Variable Rate Technology
5.7 Building and Premises Surveillance
Chapter 6: Company Profiles and Competitive Analysis
6.1 Competitive Landscape
6.1.1 Competitive Benchmarking
6.1.2 Smart Agriculture Solution Market Share by Manufacturer (2024)
6.1.3 Industry BCG Matrix
6.1.4 Heat Map Analysis
6.1.5 Mergers and Acquisitions
6.2 AGCO CORPORATION (UNITED STATES)
6.2.1 Company Overview
6.2.2 Key Executives
6.2.3 Company Snapshot
6.2.4 Role of the Company in the Market
6.2.5 Sustainability and Social Responsibility
6.2.6 Operating Business Segments
6.2.7 Product Portfolio
6.2.8 Business Performance
6.2.9 Key Strategic Moves and Recent Developments
6.2.10 SWOT Analysis
6.3 AG LEADER TECHNOLOGY (UNITED STATES)
6.4 BASF SE (GERMANY)
6.5 BAYER AG (GERMANY)
6.6 CNH INDUSTRIAL N.V. (UNITED KINGDOM)
6.7 DEERE & COMPANY (UNITED STATES)
6.8 DICKEY-JOHN CORPORATION (UNITED STATES)
6.9 KUBOTA CORPORATION (JAPAN)
6.10 RAVEN INDUSTRIES (UNITED STATES)
6.11 SEMIOSBIO TECHNOLOGIES (CANADA)
6.12 SST SOFTWARE (UNITED STATES)
6.13 SYNGENTA AG (SWITZERLAND)
6.14 TOPCON POSITIONING SYSTEMS INC. (UNITED STATES)
6.15 TRIMBLE INC. (UNITED STATES)
6.16 YARA INTERNATIONAL ASA (NORWAY)
6.17 OTHER ACTIVE PLAYERS
Chapter 7: Global Smart Agriculture Solution Market By Region
7.1 Overview
7.2. North America Smart Agriculture Solution Market
7.2.1 Key Market Trends, Growth Factors and Opportunities
7.2.2 Top Key Companies
7.2.3 Historic and Forecasted Market Size by Segments
7.2.4 Historic and Forecasted Market Size by Component Type
7.2.4.1 Hardware
7.2.4.2 Software
7.2.4.3 Services
7.2.5 Historic and Forecasted Market Size by Application
7.2.5.1 Automated Machinery Guidance Control
7.2.5.2 Tractor Collision and Obstacle Detection
7.2.5.3 Machinery Safety and Parameter Monitoring
7.2.5.4 Variable Rate Technology
7.2.5.5 Building and Premises Surveillance
7.2.6 Historic and Forecast Market Size by Country
7.2.6.1 US
7.2.6.2 Canada
7.2.6.3 Mexico
7.3. Eastern Europe Smart Agriculture Solution Market
7.3.1 Key Market Trends, Growth Factors and Opportunities
7.3.2 Top Key Companies
7.3.3 Historic and Forecasted Market Size by Segments
7.3.4 Historic and Forecasted Market Size by Component Type
7.3.4.1 Hardware
7.3.4.2 Software
7.3.4.3 Services
7.3.5 Historic and Forecasted Market Size by Application
7.3.5.1 Automated Machinery Guidance Control
7.3.5.2 Tractor Collision and Obstacle Detection
7.3.5.3 Machinery Safety and Parameter Monitoring
7.3.5.4 Variable Rate Technology
7.3.5.5 Building and Premises Surveillance
7.3.6 Historic and Forecast Market Size by Country
7.3.6.1 Russia
7.3.6.2 Bulgaria
7.3.6.3 The Czech Republic
7.3.6.4 Hungary
7.3.6.5 Poland
7.3.6.6 Romania
7.3.6.7 Rest of Eastern Europe
7.4. Western Europe Smart Agriculture Solution Market
7.4.1 Key Market Trends, Growth Factors and Opportunities
7.4.2 Top Key Companies
7.4.3 Historic and Forecasted Market Size by Segments
7.4.4 Historic and Forecasted Market Size by Component Type
7.4.4.1 Hardware
7.4.4.2 Software
7.4.4.3 Services
7.4.5 Historic and Forecasted Market Size by Application
7.4.5.1 Automated Machinery Guidance Control
7.4.5.2 Tractor Collision and Obstacle Detection
7.4.5.3 Machinery Safety and Parameter Monitoring
7.4.5.4 Variable Rate Technology
7.4.5.5 Building and Premises Surveillance
7.4.6 Historic and Forecast Market Size by Country
7.4.6.1 Germany
7.4.6.2 UK
7.4.6.3 France
7.4.6.4 The Netherlands
7.4.6.5 Italy
7.4.6.6 Spain
7.4.6.7 Rest of Western Europe
7.5. Asia Pacific Smart Agriculture Solution Market
7.5.1 Key Market Trends, Growth Factors and Opportunities
7.5.2 Top Key Companies
7.5.3 Historic and Forecasted Market Size by Segments
7.5.4 Historic and Forecasted Market Size by Component Type
7.5.4.1 Hardware
7.5.4.2 Software
7.5.4.3 Services
7.5.5 Historic and Forecasted Market Size by Application
7.5.5.1 Automated Machinery Guidance Control
7.5.5.2 Tractor Collision and Obstacle Detection
7.5.5.3 Machinery Safety and Parameter Monitoring
7.5.5.4 Variable Rate Technology
7.5.5.5 Building and Premises Surveillance
7.5.6 Historic and Forecast Market Size by Country
7.5.6.1 China
7.5.6.2 India
7.5.6.3 Japan
7.5.6.4 South Korea
7.5.6.5 Malaysia
7.5.6.6 Thailand
7.5.6.7 Vietnam
7.5.6.8 The Philippines
7.5.6.9 Australia
7.5.6.10 New Zealand
7.5.6.11 Rest of APAC
7.6. Middle East & Africa Smart Agriculture Solution Market
7.6.1 Key Market Trends, Growth Factors and Opportunities
7.6.2 Top Key Companies
7.6.3 Historic and Forecasted Market Size by Segments
7.6.4 Historic and Forecasted Market Size by Component Type
7.6.4.1 Hardware
7.6.4.2 Software
7.6.4.3 Services
7.6.5 Historic and Forecasted Market Size by Application
7.6.5.1 Automated Machinery Guidance Control
7.6.5.2 Tractor Collision and Obstacle Detection
7.6.5.3 Machinery Safety and Parameter Monitoring
7.6.5.4 Variable Rate Technology
7.6.5.5 Building and Premises Surveillance
7.6.6 Historic and Forecast Market Size by Country
7.6.6.1 Turkiye
7.6.6.2 Bahrain
7.6.6.3 Kuwait
7.6.6.4 Saudi Arabia
7.6.6.5 Qatar
7.6.6.6 UAE
7.6.6.7 Israel
7.6.6.8 South Africa
7.7. South America Smart Agriculture Solution Market
7.7.1 Key Market Trends, Growth Factors and Opportunities
7.7.2 Top Key Companies
7.7.3 Historic and Forecasted Market Size by Segments
7.7.4 Historic and Forecasted Market Size by Component Type
7.7.4.1 Hardware
7.7.4.2 Software
7.7.4.3 Services
7.7.5 Historic and Forecasted Market Size by Application
7.7.5.1 Automated Machinery Guidance Control
7.7.5.2 Tractor Collision and Obstacle Detection
7.7.5.3 Machinery Safety and Parameter Monitoring
7.7.5.4 Variable Rate Technology
7.7.5.5 Building and Premises Surveillance
7.7.6 Historic and Forecast Market Size by Country
7.7.6.1 Brazil
7.7.6.2 Argentina
7.7.6.3 Rest of SA
Chapter 8 Analyst Viewpoint and Conclusion
8.1 Recommendations and Concluding Analysis
8.2 Potential Market Strategies
Chapter 9 Research Methodology
9.1 Research Process
9.2 Primary Research
9.3 Secondary Research
|
Global Smart Agriculture Solution Market |
|||
|
Base Year: |
2023 |
Forecast Period: |
2024-2032 |
|
Historical Data: |
2017 to 2023 |
Market Size in 2023: |
USD 20.5 Billion |
|
Forecast Period 2024-32 CAGR: |
9.5% |
Market Size in 2032: |
USD 46.3 Billion |
|
Segments Covered: |
By Component Type |
|
|
|
By Application |
|
||
|
By Region |
|
||
|
Key Market Drivers: |
|
||
|
Key Market Restraints: |
|
||
|
Key Opportunities: |
|
||
|
Companies Covered in the report: |
|
||


