


Dry Ice Engineering Service Market Synopsis
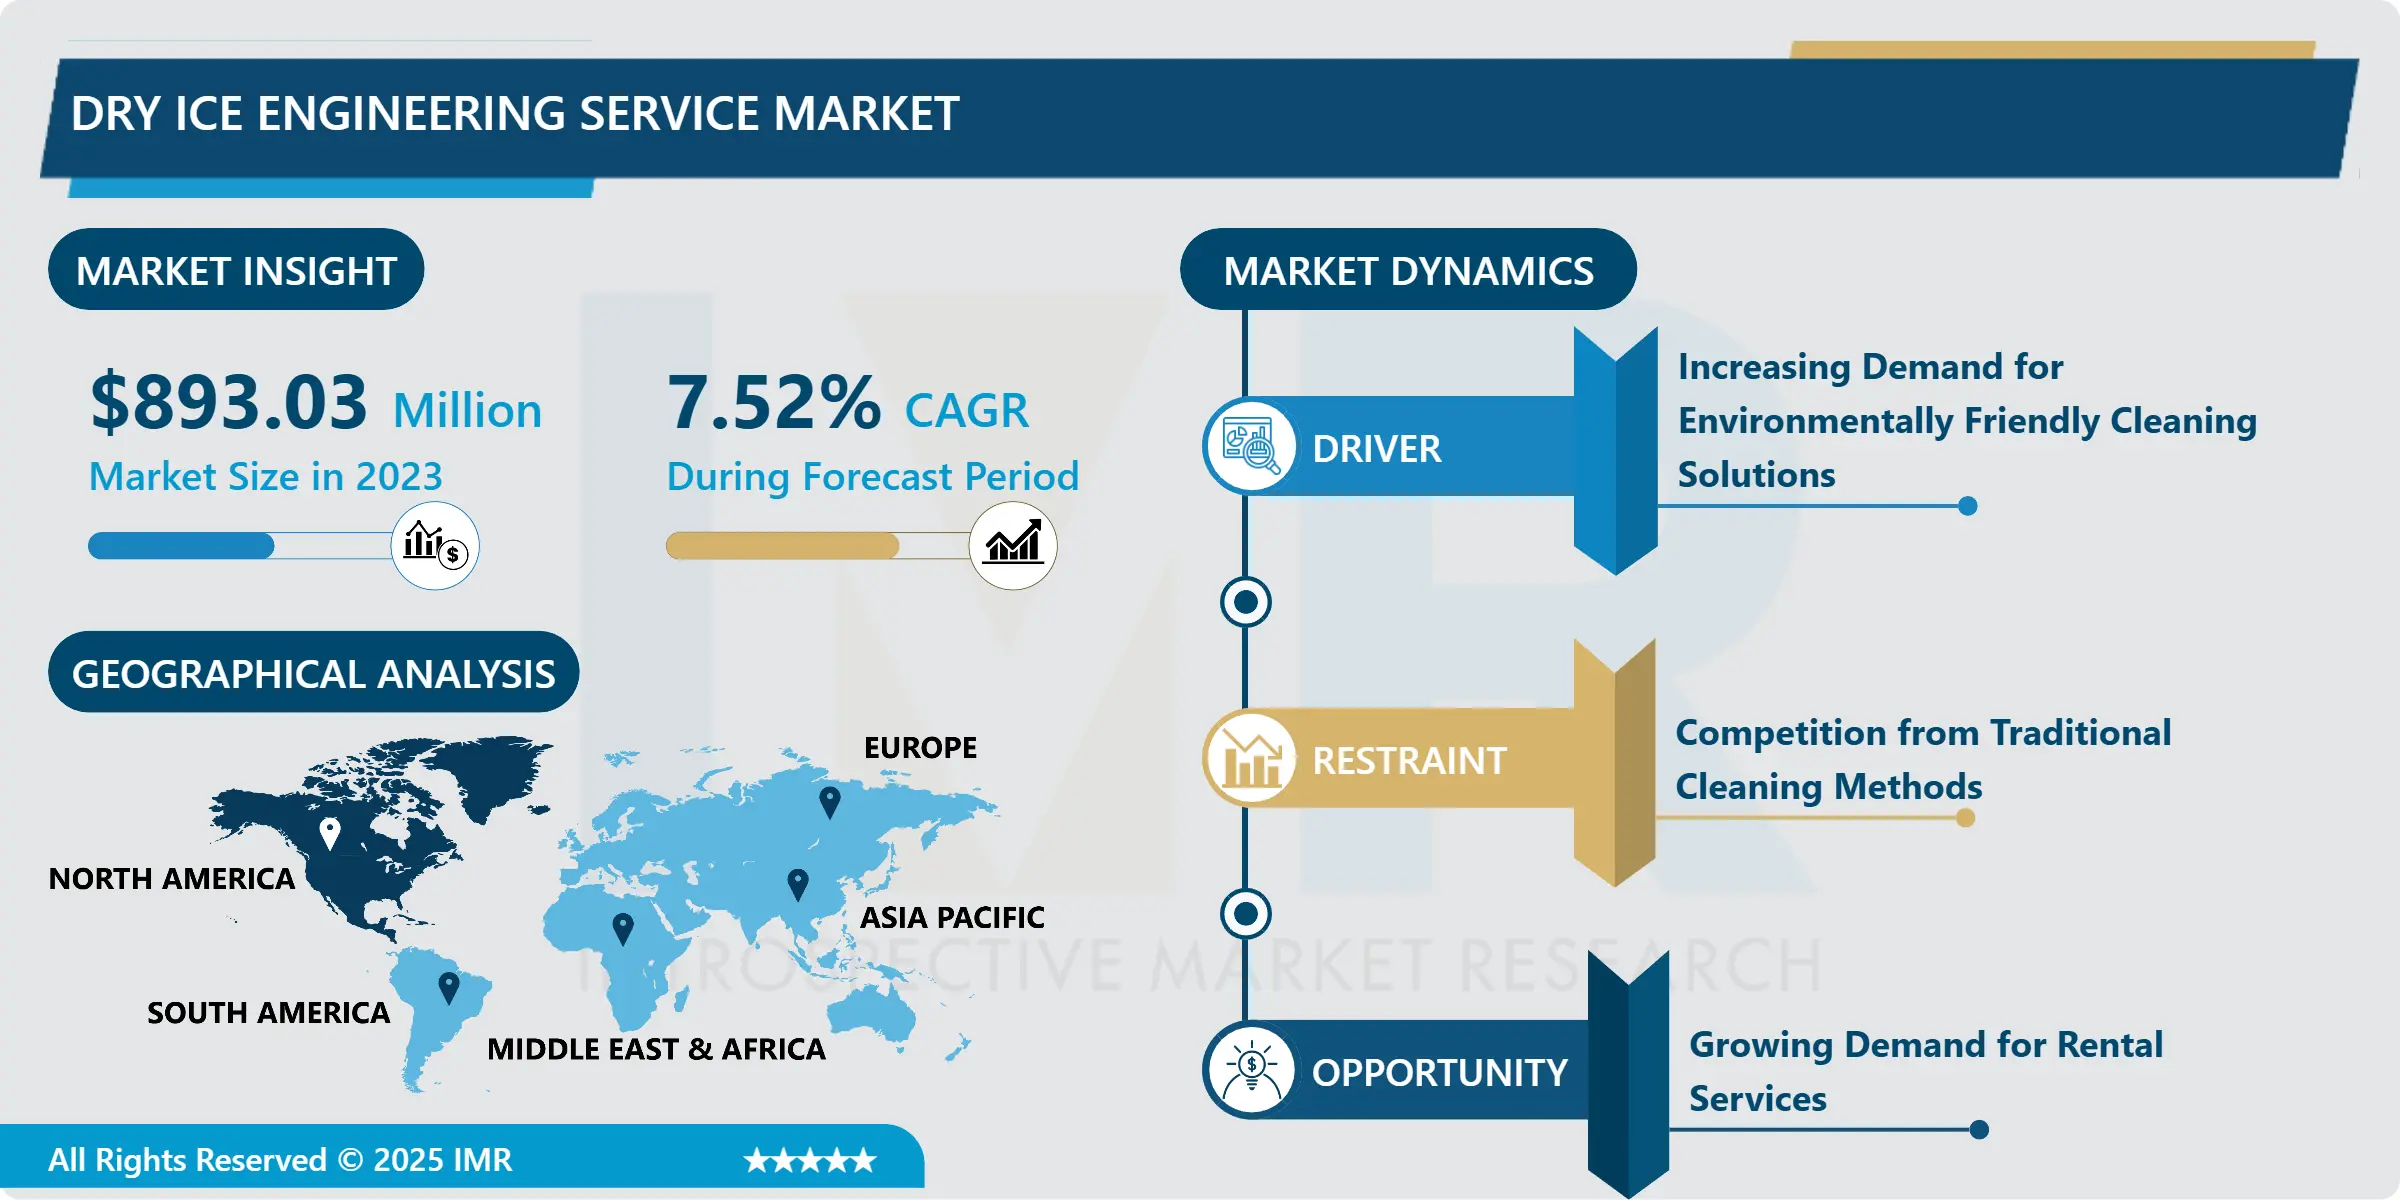
Global Dry Ice Engineering Service Market Size Was Valued at USD 960.19 Million in 2024 and is Projected to Reach USD 1715.03 Million by 2032, Growing at a CAGR of 7.52% From 2025-2032.
Dry Ice Engineering Services offers all-encompassing solutions for the handling, storage, and utilization of dry ice. Our team of experts develops and deploys cutting-edge systems customized to meet the unique requirements of our clients, guaranteeing the effective and secure use of dry ice across a range of applications including food preservation, medical transportation, and industrial cleaning.
Dry Ice Engineering Services are utilized across diverse industries due to their versatility and efficacy. In food transportation, dry ice preserves perishable goods, ensuring their freshness and safety. Additionally, in medical transport, it maintains the temperature of sensitive supplies like vaccines and organs, preserving their efficacy. In industrial cleaning, dry ice blasting removes contaminants without causing damage, providing an eco-friendly solution.
they offer a non-toxic and environmentally friendly alternative to traditional methods, reducing environmental impact. Dry ice is readily available and cost-effective, making it an economically sound choice. Moreover, it delivers superior performance, ensuring efficiency and reliability in various applications.
The future demand for Dry Ice Engineering Services is expected to soar. With growing concerns about environmental sustainability and stricter regulations on food safety, demand for dry ice solutions will rise. Additionally, technological advancements will enhance its efficiency and versatility, further fueling adoption. As businesses prioritize efficiency, cost reduction, and environmental consciousness, the demand for innovative dry ice engineering solutions is set to increase in the years ahead.

Dry Ice Engineering Service Market Trend Analysis:
Increasing Demand for Environmentally Friendly Cleaning Solutions
- The growing demand for eco-friendly cleaning solutions is a key driver propelling the expansion of the Dry Ice Engineering Service market. As businesses and industries heighten their awareness of environmental impact, they increasingly adopt sustainable practices. Dry ice cleaning presents a highly efficient and environmentally friendly alternative to traditional methods, devoid of harmful chemicals and secondary waste production. This renders it an appealing choice for firms seeking to reduce their environmental footprint while upholding cleanliness and hygiene standards.
- Moreover, stringent regulations and guidelines concerning environmental protection and workplace safety are boosting the uptake of dry ice cleaning services across diverse sectors. Governments are imposing stricter emissions standards and waste disposal regulations, prompting businesses to seek cleaner, more sustainable alternatives. Dry ice cleaning not only meets these regulatory mandates but also delivers superior cleaning efficacy, making it favored in industries spanning manufacturing to food processing.
- Additionally, the versatility and effectiveness of dry ice cleaning position it as a vital solution across various applications. It excels in removing stubborn contaminants from machinery and equipment while safely cleaning delicate surfaces without causing damage. As industries persist in prioritizing sustainability and efficiency, the demand for dry ice engineering services is anticipated to grow steadily. This growth stems from the necessity for environmentally conscious cleaning solutions that offer exceptional performance.
Growing Demand for Rental Services
- The rising need for rental services represents a significant opportunity for the expansion of the Dry Ice Engineering Service market. Businesses, in search of cost-effective options and flexible arrangements, are drawn to the rental model as a compelling means of accessing dry ice engineering services without substantial initial investments. This trend is particularly evident in industries where dry ice usage may be sporadic or seasonal, such as event management, construction, and transportation.
- Moreover, the rental model aligns closely with the increasing focus on sustainability and resource efficiency. Opting for rental services allows companies to minimize waste and resource utilization linked with equipment ownership and maintenance. This not only lowers operational expenses but also contributes to environmental preservation, appealing to environmentally-conscious businesses
- Additionally, the rental approach empowers businesses with enhanced agility and scalability to adapt to evolving market dynamics and operational needs. Companies can swiftly adjust their dry ice engineering services without the constraints associated with ownership, enabling more effective responses to demand fluctuations and resource optimization. As the demand for rental services continues to surge across industries, the Dry Ice Engineering Service market is well-positioned to leverage this trend, offering customized rental solutions to fulfill the diverse requirements of businesses seeking efficient and sustainable cleaning and cooling solutions.
Dry Ice Engineering Service Market Segment Analysis:
Dry Ice Engineering Service Market Segmented on the basis of Type, Deployment Model, Application, and Vertical.
By Type, Dry Ice Blasting Service segment is expected to dominate the market during the forecast period
- The Dry Ice Blasting Service sector is poised to lead the expansion of the Dry Ice Engineering Service Market. This expectation arises from the escalating demand for environmentally friendly and effective cleaning solutions across various industries. Dry ice blasting provides a highly efficient and eco-conscious alternative to conventional cleaning methods, eliminating the need for water, chemicals, or abrasive substances. Instead, it employs solid carbon dioxide pellets propelled at high velocities to cleanse surfaces without causing harm.
- Furthermore, dry ice blasting is recognized for its adaptability and capacity to effectively clean a diverse array of surfaces and equipment. Whether it's delicate machinery in manufacturing plants or heavy-duty equipment at construction sites, dry ice blasting adeptly addresses a multitude of cleaning challenges with precision. With industries increasingly emphasizing sustainability and seeking innovative cleaning solutions, the demand for dry ice blasting services is anticipated to surge, thereby propelling overall growth in the Dry Ice Engineering Service Market.
By Deployment Model, On-Site Services segment held the largest share in 2024
- The On-Site Services sector has emerged as the frontrunner, commanding the largest portion in propelling the expansion of the Dry Ice Engineering Service Market. This dominance stems from the convenience and efficacy inherent in on-site services, eliminating the necessity for clients to transport equipment or materials to off-site locations. By delivering services directly at the client's premises, On-Site Services ensure prompt deployment and minimize downtime, thereby enhancing operational efficiency.
- Furthermore, On-Site Services offer bespoke solutions that can be tailored to meet the specific demands of individual clients. Whether it involves equipment cleaning, perishable goods preservation, or specialized applications, on-site services provide personalized solutions that cater to the unique needs of businesses across diverse industries. This adaptability and customization significantly contribute to the segment's substantial market share, solidifying its position as a driving force behind the growth of the Dry Ice Engineering Service Market.
Dry Ice Engineering Service Market Regional Insights:
North America Expected to Dominate the Market Over the Forecast Period
- North America is expected to take the lead as the primary region in the expanding market for Ice Engineering Services. This projection stems from various factors, including the region's robust industrial infrastructure, advancements in technology, and the rising adoption of cutting-edge solutions. With its established presence across diverse sectors like food and beverage, automotive, pharmaceuticals, and manufacturing, North America provides a fertile environment for the growth of Ice Engineering Services.
- Moreover, stringent regulations concerning environmental sustainability and safety standards in the region drive the demand for eco-friendly and effective cleaning solutions, positioning ice engineering services as crucial. Additionally, the presence of key industry players and an increasing focus on research and development activities contribute to North America's expected dominance in the Ice Engineering Services market. As companies in the region continue to prioritize efficiency, sustainability, and regulatory compliance, North America is set to lead in advancing growth and innovation within the Ice Engineering Services sector.
Dry Ice Engineering Service Market Top Key Players:
- 3E Engineering (U.S.)
- Energy Management Corporation (U.S.)
- Alliancere Fractories (Canada)
- Horeco2 (China)
- Forgreen (Taiwan)
- Enotech Connected Services (UAE)
- Yateem Oxygen (UAE)
- Rb-Marine (UAE)
- Dry Ice Blasting Pty Ltd (South Africa)
- Aiis Solutions (India)
- Arudra Engineers (India)
- Ortech Engineering Services (India)
- Multilink Engineering Services (India), and Other Active Players
|
Dry Ice Engineering Service Market |
|||
|
Base Year: |
2024 |
Forecast Period: |
2025-2032 |
|
Historical Data: |
2018 to 2023 |
Market Size in 2024: |
USD 960.19 Mn. |
|
Forecast Period 2024-32 CAGR: |
7.52% |
Market Size in 2032: |
USD 1715.03 Mn. |
|
Segments Covered: |
By Type |
|
|
|
By Deployment Model |
|
||
|
By Application |
|
||
|
By Vertical |
|
||
|
By Region |
|
||
|
Key Market Drivers: |
|
||
|
Key Market Restraints: |
|
||
|
Key Opportunities: |
|
||
|
Companies Covered in the report: |
|
||
Chapter 1: Introduction
1.1 Scope and Coverage
Chapter 2:Executive Summary
Chapter 3: Market Landscape
3.1 Market Dynamics
3.1.1 Drivers
3.1.2 Restraints
3.1.3 Opportunities
3.1.4 Challenges
3.2 Market Trend Analysis
3.3 PESTLE Analysis
3.4 Porter's Five Forces Analysis
3.5 Industry Value Chain Analysis
3.6 Ecosystem
3.7 Regulatory Landscape
3.8 Price Trend Analysis
3.9 Patent Analysis
3.10 Technology Evolution
3.11 Investment Pockets
3.12 Import-Export Analysis
Chapter 4: Dry Ice Engineering Service Market by Type (2018-2032)
4.1 Dry Ice Engineering Service Market Snapshot and Growth Engine
4.2 Market Overview
4.3 Dry Ice Blasting Service
4.3.1 Introduction and Market Overview
4.3.2 Historic and Forecasted Market Size in Value USD and Volume Units
4.3.3 Key Market Trends, Growth Factors, and Opportunities
4.3.4 Geographic Segmentation Analysis
4.4 Dry Ice Cleaning Service
Chapter 5: Dry Ice Engineering Service Market by Deployment Model (2018-2032)
5.1 Dry Ice Engineering Service Market Snapshot and Growth Engine
5.2 Market Overview
5.3 On-Site Services
5.3.1 Introduction and Market Overview
5.3.2 Historic and Forecasted Market Size in Value USD and Volume Units
5.3.3 Key Market Trends, Growth Factors, and Opportunities
5.3.4 Geographic Segmentation Analysis
5.4 Off-Site Services
Chapter 6: Dry Ice Engineering Service Market by Application (2018-2032)
6.1 Dry Ice Engineering Service Market Snapshot and Growth Engine
6.2 Market Overview
6.3 Petrochemical
6.3.1 Introduction and Market Overview
6.3.2 Historic and Forecasted Market Size in Value USD and Volume Units
6.3.3 Key Market Trends, Growth Factors, and Opportunities
6.3.4 Geographic Segmentation Analysis
6.4 Auto Industry
6.5 Printing Industry
6.6 Food & Beverage
Chapter 7: Dry Ice Engineering Service Market by Vertical (2018-2032)
7.1 Dry Ice Engineering Service Market Snapshot and Growth Engine
7.2 Market Overview
7.3 Industrial
7.3.1 Introduction and Market Overview
7.3.2 Historic and Forecasted Market Size in Value USD and Volume Units
7.3.3 Key Market Trends, Growth Factors, and Opportunities
7.3.4 Geographic Segmentation Analysis
7.4 Commercial
7.5 Government
Chapter 8: Company Profiles and Competitive Analysis
8.1 Competitive Landscape
8.1.1 Competitive Benchmarking
8.1.2 Dry Ice Engineering Service Market Share by Manufacturer (2024)
8.1.3 Industry BCG Matrix
8.1.4 Heat Map Analysis
8.1.5 Mergers and Acquisitions
8.2 BLACKROCK INC. (UNITED STATES)
8.2.1 Company Overview
8.2.2 Key Executives
8.2.3 Company Snapshot
8.2.4 Role of the Company in the Market
8.2.5 Sustainability and Social Responsibility
8.2.6 Operating Business Segments
8.2.7 Product Portfolio
8.2.8 Business Performance
8.2.9 Key Strategic Moves and Recent Developments
8.2.10 SWOT Analysis
8.3 THE VANGUARD GROUP INC. (UNITED STATES)
8.4 CHARLES SCHWAB & COINC. (UNITED STATES)
8.5 JPMORGAN CHASE & CO. (UNITED STATES)
8.6 FMR LLC (UNITED STATES)
8.7 STATE STREET CORPORATION (UNITED STATES)
8.8 MORGAN STANLEY (UNITED STATES)
8.9 BNY MELLON SECURITIES CORP. (UNITED STATES)
8.10 AMUNDI US (UNITED STATES)
8.11 GOLDMAN SACHS (UNITED STATES)
8.12 FRANKLIN TEMPLETON (UNITED STATES)
8.13 OTHER KEY PLAYERS
Chapter 9: Global Dry Ice Engineering Service Market By Region
9.1 Overview
9.2. North America Dry Ice Engineering Service Market
9.2.1 Key Market Trends, Growth Factors and Opportunities
9.2.2 Top Key Companies
9.2.3 Historic and Forecasted Market Size by Segments
9.2.4 Historic and Forecasted Market Size by Type
9.2.4.1 Dry Ice Blasting Service
9.2.4.2 Dry Ice Cleaning Service
9.2.5 Historic and Forecasted Market Size by Deployment Model
9.2.5.1 On-Site Services
9.2.5.2 Off-Site Services
9.2.6 Historic and Forecasted Market Size by Application
9.2.6.1 Petrochemical
9.2.6.2 Auto Industry
9.2.6.3 Printing Industry
9.2.6.4 Food & Beverage
9.2.7 Historic and Forecasted Market Size by Vertical
9.2.7.1 Industrial
9.2.7.2 Commercial
9.2.7.3 Government
9.2.8 Historic and Forecast Market Size by Country
9.2.8.1 US
9.2.8.2 Canada
9.2.8.3 Mexico
9.3. Eastern Europe Dry Ice Engineering Service Market
9.3.1 Key Market Trends, Growth Factors and Opportunities
9.3.2 Top Key Companies
9.3.3 Historic and Forecasted Market Size by Segments
9.3.4 Historic and Forecasted Market Size by Type
9.3.4.1 Dry Ice Blasting Service
9.3.4.2 Dry Ice Cleaning Service
9.3.5 Historic and Forecasted Market Size by Deployment Model
9.3.5.1 On-Site Services
9.3.5.2 Off-Site Services
9.3.6 Historic and Forecasted Market Size by Application
9.3.6.1 Petrochemical
9.3.6.2 Auto Industry
9.3.6.3 Printing Industry
9.3.6.4 Food & Beverage
9.3.7 Historic and Forecasted Market Size by Vertical
9.3.7.1 Industrial
9.3.7.2 Commercial
9.3.7.3 Government
9.3.8 Historic and Forecast Market Size by Country
9.3.8.1 Russia
9.3.8.2 Bulgaria
9.3.8.3 The Czech Republic
9.3.8.4 Hungary
9.3.8.5 Poland
9.3.8.6 Romania
9.3.8.7 Rest of Eastern Europe
9.4. Western Europe Dry Ice Engineering Service Market
9.4.1 Key Market Trends, Growth Factors and Opportunities
9.4.2 Top Key Companies
9.4.3 Historic and Forecasted Market Size by Segments
9.4.4 Historic and Forecasted Market Size by Type
9.4.4.1 Dry Ice Blasting Service
9.4.4.2 Dry Ice Cleaning Service
9.4.5 Historic and Forecasted Market Size by Deployment Model
9.4.5.1 On-Site Services
9.4.5.2 Off-Site Services
9.4.6 Historic and Forecasted Market Size by Application
9.4.6.1 Petrochemical
9.4.6.2 Auto Industry
9.4.6.3 Printing Industry
9.4.6.4 Food & Beverage
9.4.7 Historic and Forecasted Market Size by Vertical
9.4.7.1 Industrial
9.4.7.2 Commercial
9.4.7.3 Government
9.4.8 Historic and Forecast Market Size by Country
9.4.8.1 Germany
9.4.8.2 UK
9.4.8.3 France
9.4.8.4 The Netherlands
9.4.8.5 Italy
9.4.8.6 Spain
9.4.8.7 Rest of Western Europe
9.5. Asia Pacific Dry Ice Engineering Service Market
9.5.1 Key Market Trends, Growth Factors and Opportunities
9.5.2 Top Key Companies
9.5.3 Historic and Forecasted Market Size by Segments
9.5.4 Historic and Forecasted Market Size by Type
9.5.4.1 Dry Ice Blasting Service
9.5.4.2 Dry Ice Cleaning Service
9.5.5 Historic and Forecasted Market Size by Deployment Model
9.5.5.1 On-Site Services
9.5.5.2 Off-Site Services
9.5.6 Historic and Forecasted Market Size by Application
9.5.6.1 Petrochemical
9.5.6.2 Auto Industry
9.5.6.3 Printing Industry
9.5.6.4 Food & Beverage
9.5.7 Historic and Forecasted Market Size by Vertical
9.5.7.1 Industrial
9.5.7.2 Commercial
9.5.7.3 Government
9.5.8 Historic and Forecast Market Size by Country
9.5.8.1 China
9.5.8.2 India
9.5.8.3 Japan
9.5.8.4 South Korea
9.5.8.5 Malaysia
9.5.8.6 Thailand
9.5.8.7 Vietnam
9.5.8.8 The Philippines
9.5.8.9 Australia
9.5.8.10 New Zealand
9.5.8.11 Rest of APAC
9.6. Middle East & Africa Dry Ice Engineering Service Market
9.6.1 Key Market Trends, Growth Factors and Opportunities
9.6.2 Top Key Companies
9.6.3 Historic and Forecasted Market Size by Segments
9.6.4 Historic and Forecasted Market Size by Type
9.6.4.1 Dry Ice Blasting Service
9.6.4.2 Dry Ice Cleaning Service
9.6.5 Historic and Forecasted Market Size by Deployment Model
9.6.5.1 On-Site Services
9.6.5.2 Off-Site Services
9.6.6 Historic and Forecasted Market Size by Application
9.6.6.1 Petrochemical
9.6.6.2 Auto Industry
9.6.6.3 Printing Industry
9.6.6.4 Food & Beverage
9.6.7 Historic and Forecasted Market Size by Vertical
9.6.7.1 Industrial
9.6.7.2 Commercial
9.6.7.3 Government
9.6.8 Historic and Forecast Market Size by Country
9.6.8.1 Turkiye
9.6.8.2 Bahrain
9.6.8.3 Kuwait
9.6.8.4 Saudi Arabia
9.6.8.5 Qatar
9.6.8.6 UAE
9.6.8.7 Israel
9.6.8.8 South Africa
9.7. South America Dry Ice Engineering Service Market
9.7.1 Key Market Trends, Growth Factors and Opportunities
9.7.2 Top Key Companies
9.7.3 Historic and Forecasted Market Size by Segments
9.7.4 Historic and Forecasted Market Size by Type
9.7.4.1 Dry Ice Blasting Service
9.7.4.2 Dry Ice Cleaning Service
9.7.5 Historic and Forecasted Market Size by Deployment Model
9.7.5.1 On-Site Services
9.7.5.2 Off-Site Services
9.7.6 Historic and Forecasted Market Size by Application
9.7.6.1 Petrochemical
9.7.6.2 Auto Industry
9.7.6.3 Printing Industry
9.7.6.4 Food & Beverage
9.7.7 Historic and Forecasted Market Size by Vertical
9.7.7.1 Industrial
9.7.7.2 Commercial
9.7.7.3 Government
9.7.8 Historic and Forecast Market Size by Country
9.7.8.1 Brazil
9.7.8.2 Argentina
9.7.8.3 Rest of SA
Chapter 10 Analyst Viewpoint and Conclusion
10.1 Recommendations and Concluding Analysis
10.2 Potential Market Strategies
Chapter 11 Research Methodology
11.1 Research Process
11.2 Primary Research
11.3 Secondary Research
|
Dry Ice Engineering Service Market |
|||
|
Base Year: |
2024 |
Forecast Period: |
2025-2032 |
|
Historical Data: |
2018 to 2023 |
Market Size in 2024: |
USD 960.19 Mn. |
|
Forecast Period 2024-32 CAGR: |
7.52% |
Market Size in 2032: |
USD 1715.03 Mn. |
|
Segments Covered: |
By Type |
|
|
|
By Deployment Model |
|
||
|
By Application |
|
||
|
By Vertical |
|
||
|
By Region |
|
||
|
Key Market Drivers: |
|
||
|
Key Market Restraints: |
|
||
|
Key Opportunities: |
|
||
|
Companies Covered in the report: |
|
||


