


Data Visualization Software Market Synopsis
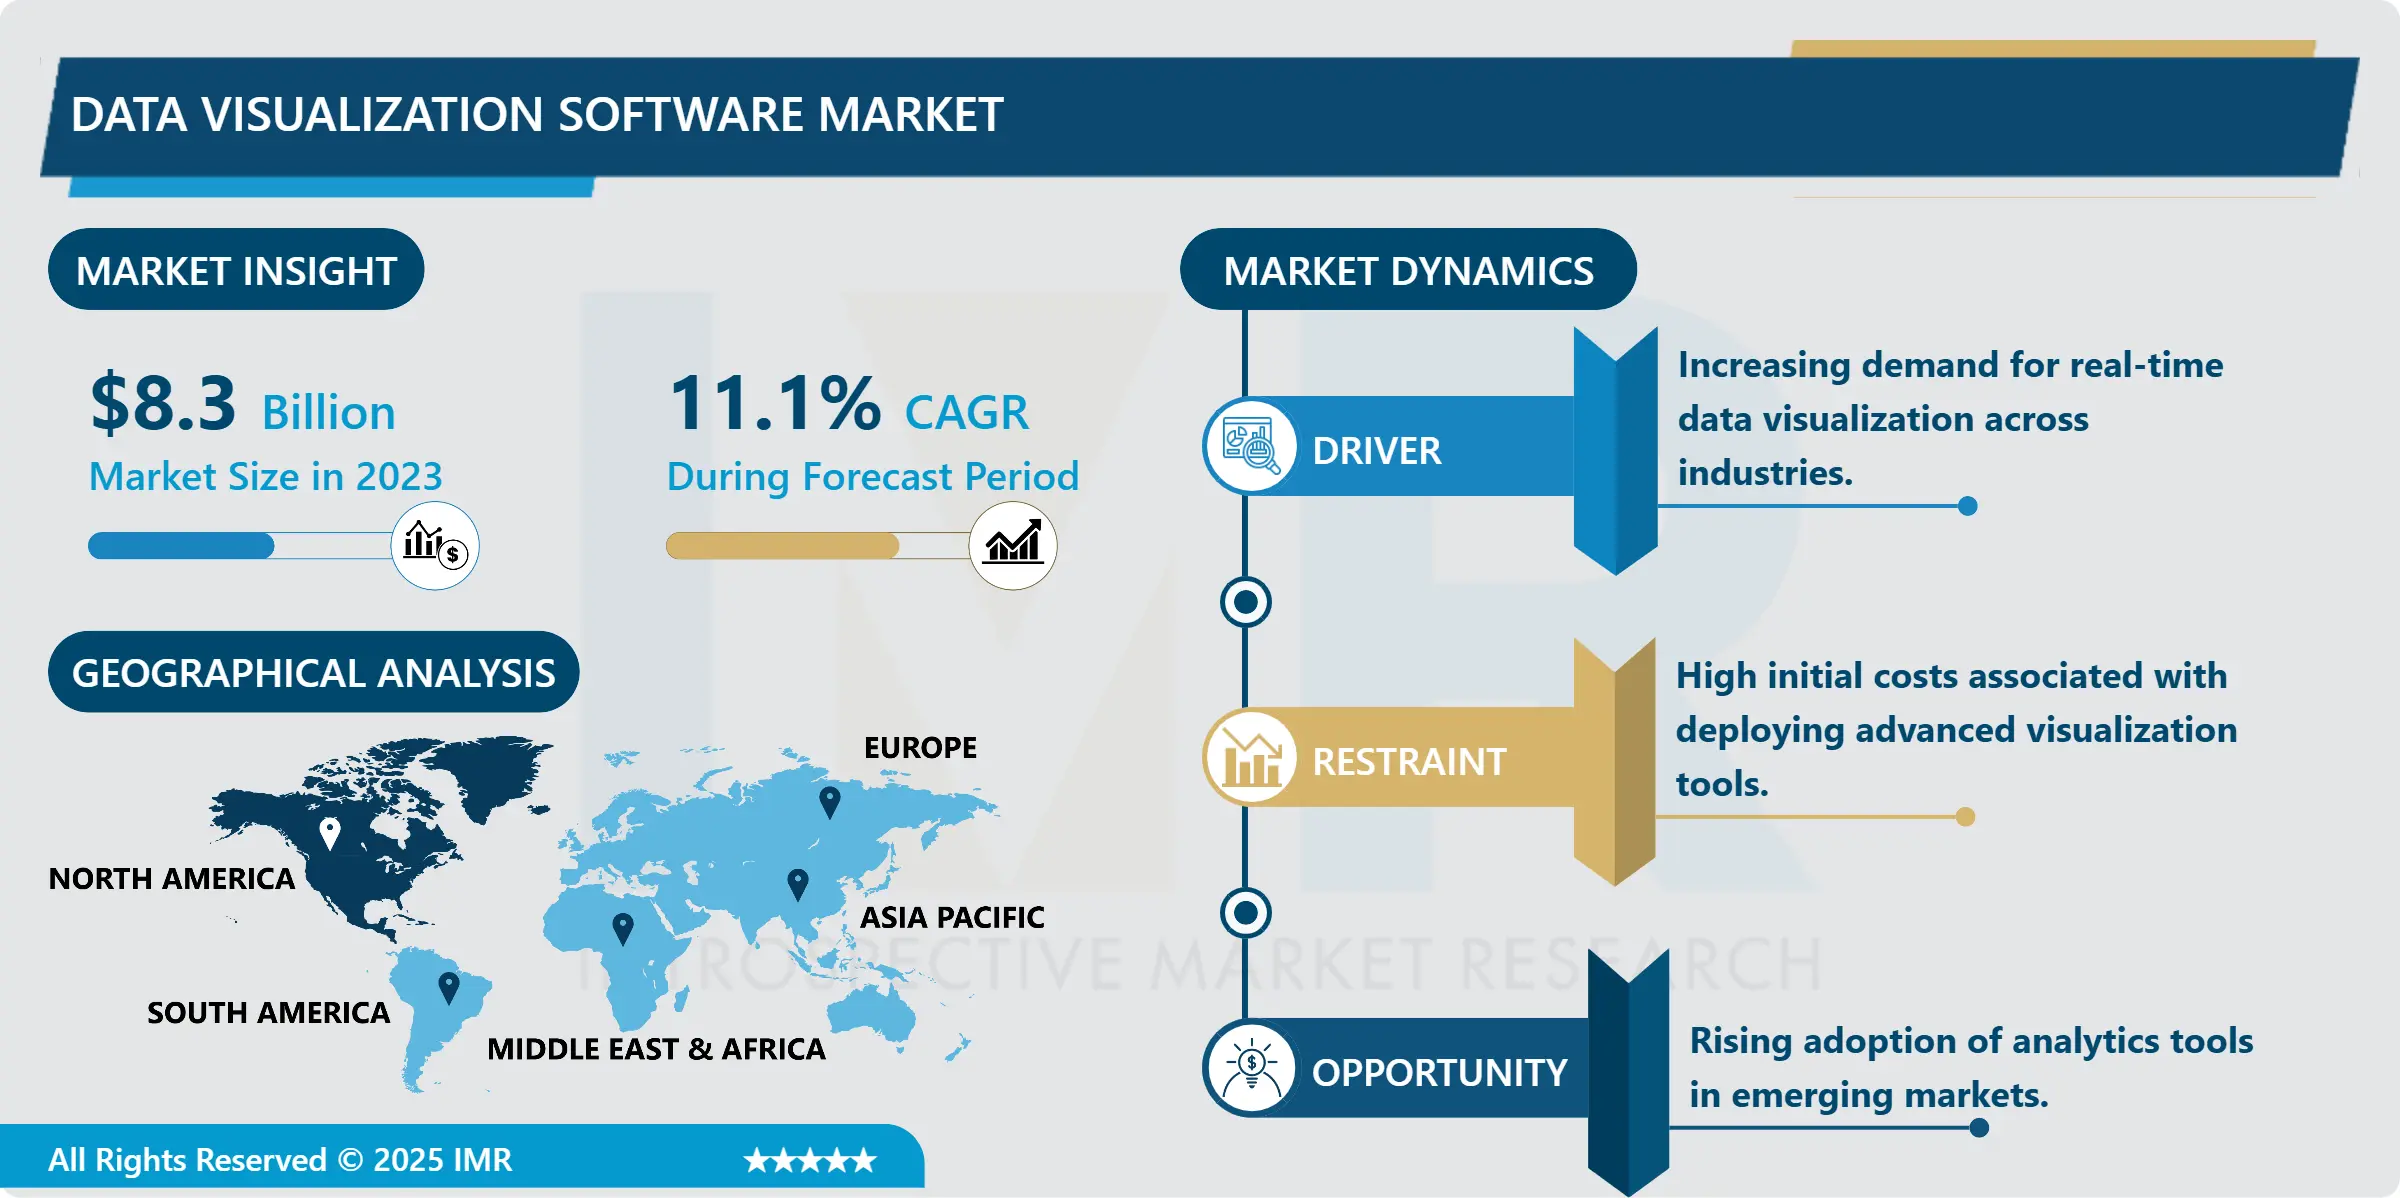
Data Visualization Software Market Size Was Valued at USD 8.3 Billion in 2023, and is Projected to Reach USD 21.40 Billion by 2032, Growing at a CAGR of 11.1 % From 2024-2032.
The Data Visualization Software Market refers to applications and software that help in the conversion of raw data into presentable graphical or visual view that may include charts, maps, graphs, or dashboards to facilitate data analysis by the respective users. These solutions are relevant for various sectors, mostly in such sectors as healthcare, retail, BFSI, IT, and governmental organizations that can hardly make decisions without proper data support. Global data generation is growing rapidly and hence the use of data visualization tools to enhance comprehension of massive data is becoming crucial.
The market for data visualization software has evolved greatly in the last couple of years due to the adoption of big data solutions. Companies across industries are focusing on gaining better insight and implementing analytics as well as visualization tools in order to increase their performance. The advancement in big data and progression in the IoT devices have also escalated the utilization of these tools of big data visualization, due to the availability of different types and huge volume of data. Furthermore, flexible metrics are being incorporated to persistently track business performance indicators through graphical real-time data dashboards, hence enhancing business competitiveness.
In addition, the use of advanced technology in data representation including; artificial intelligence (AI) and machine learning (ML) is improving on the functionality of these tools. Haven described features like predictive analytics, automated insights, and even interactive dashboards are already the norm to offer organizations enhanced flexibility in managing their data. It is likely to accelerate the market growth in the future, and especially industries, which use data to make strategic decisions.
Data Visualization Software Market Trend Analysis:
The Rise of AI-Driven Visualization Tools
-
The most important emerging pattern in the field of data visualization software is the inclusion of Artificial Intelligence and Machine Learning in the process of the analysis. Automated methods can also search out relationships and outliers within a dataset, forecast analytical conclusions and suggest layouts for depicting these conclusions. Thus, reducing the reliance on data science teams and makes it easier for non-data scientists to perform advanced analytics. These tools are being used by companies in order to cope up with the flood of data that incoming in real-time which enhances the quick and efficient decision-making system.
Expanding Adoption in Emerging Markets
-
As it will be established the data visualization software market has its greatest prospect in the emergent economy. Intensive automation across Asia-Pacific, Latin America, and Africa in particular is increasing the need for analytical tools. These governments, and enterprises, continue to invest in data infrastructure which encompasses visualization tools. Also, the increased deployment of small and medium enterprises to cloud business solutions as a result of low cost and flexibility pushes market forward. Those vendors who targeted localized language support and regional adaptations should fully capitalize on this emerging market.
Data Visualization Software Market Segment Analysis:
Data Visualization Software Market Segmented on the basis of deployment, tools, end user and region.
By Deployment, Cloud segment is expected to dominate the market during the forecast period
-
The Cloud segment is expected to hafre the largest market share of the data visualization software market through the period. Cloud solutions are flexible, adaptable, cost-effective and the option of outsourcing can be massively beneficial for organizations of all types and sizes. These solutions allow businesses to access their data to load visualization tools and work remotely and in real time. Besides, there is no need for installing updates or fixing bugs since the providers frequently update the cloud-based applications, and the built-in security functions, as well as interface compatibility with other cloud-based applications, can also promote the use of cloud-based platforms. The use of cloud solutions, especially by startup and SME companies, indicates that this segment leads the growth in the market.
By Tools, the Integrated segment expected to held the largest share
-
The market research also included market segmentation based on the Integrated segment, which is expected to be the largest within the data visualization software market. There is integration in that data is collected, analyzed and visualized in a single package of the solution. Such tools solve the problem of having many systems to deal with, saving operational expenses and enhancing users’ satisfaction. Of all types of integrated visualization tools, enterprises with centralized data management requirements prefer them the most. The traditional nature of the integrated segment is reflected in the fact that various organizations increasingly tend to rely on platforms that can provide comprehensive analysis at all stages of the process.
Data Visualization Software Market Regional Insights:
North America is Expected to Dominate the Market Over the Forecast period
-
The region leads the market because it boasts of a robust IT structure, high implementation of innovative solutions, and leading market players. North America is the leading rope market contributing to about 35% of the global market in 2023 and this percentage is projected to remain constant. The United States remains the leading country for innovation in analytics and visualization tools, due to the demands in the financial, healthcare, and retail industries.
- In addition, as a result of the shift to a data-oriented approach in companies, North American businesses have prioritized the expansion of sophisticated visualization solutions. These tools have become critical weapons for organizations, to establish a competitive advantage, enhance customers satisfaction, and enhance on organizational performance. The well-developed rules governing all forms of business activity and increasing concern for data protection and confidentiality also contribute to the development of comprehensive visualization tools for this region’s markets.
Active Key Players in the Data Visualization Software Market:
- Alteryx (United States)
- Domo (United States)
- IBM Corporation (United States)
- Infor (United States)
- Information Builders (United States)
- Microsoft Corporation (United States)
- MicroStrategy (United States)
- Oracle Corporation (United States)
- QlikTech International (United States)
- Salesforce (United States)
- SAP SE (Germany)
- Sisense (United States)
- Tableau Software (United States)
- ThoughtSpot (United States)
- Zoho Corporation (India)
- Other Active Players
|
Global Data Visualization Software Market |
|||
|
Base Year: |
2023 |
Forecast Period: |
2024-2032 |
|
Historical Data: |
2017 to 2023 |
Market Size in 2023: |
USD 8.3 Billion |
|
Forecast Period 2024-32 CAGR: |
11.1 % |
Market Size in 2032: |
USD 21.40 Billion |
|
Segments Covered: |
By Deployment |
|
|
|
By Tools |
|
||
|
By End User |
|
||
|
By Region |
|
||
|
Key Market Drivers: |
|
||
|
Key Market Restraints: |
|
||
|
Key Opportunities: |
|
||
|
Companies Covered in the report: |
|
||
Chapter 1: Introduction
1.1 Scope and Coverage
Chapter 2:Executive Summary
Chapter 3: Market Landscape
3.1 Market Dynamics
3.1.1 Drivers
3.1.2 Restraints
3.1.3 Opportunities
3.1.4 Challenges
3.2 Market Trend Analysis
3.3 PESTLE Analysis
3.4 Porter's Five Forces Analysis
3.5 Industry Value Chain Analysis
3.6 Ecosystem
3.7 Regulatory Landscape
3.8 Price Trend Analysis
3.9 Patent Analysis
3.10 Technology Evolution
3.11 Investment Pockets
3.12 Import-Export Analysis
Chapter 4: Data Visualization Software Market by Deployment
4.1 Data Visualization Software Market Snapshot and Growth Engine
4.2 Data Visualization Software Market Overview
4.3 On-Premise
4.3.1 Introduction and Market Overview
4.3.2 Historic and Forecasted Market Size in Value USD and Volume Units (2017-2032F)
4.3.3 Key Market Trends, Growth Factors and Opportunities
4.3.4 On-Premise: Geographic Segmentation Analysis
4.4 Cloud
4.4.1 Introduction and Market Overview
4.4.2 Historic and Forecasted Market Size in Value USD and Volume Units (2017-2032F)
4.4.3 Key Market Trends, Growth Factors and Opportunities
4.4.4 Cloud: Geographic Segmentation Analysis
Chapter 5: Data Visualization Software Market by Tools
5.1 Data Visualization Software Market Snapshot and Growth Engine
5.2 Data Visualization Software Market Overview
5.3 Standalone
5.3.1 Introduction and Market Overview
5.3.2 Historic and Forecasted Market Size in Value USD and Volume Units (2017-2032F)
5.3.3 Key Market Trends, Growth Factors and Opportunities
5.3.4 Standalone: Geographic Segmentation Analysis
5.4 Integrated
5.4.1 Introduction and Market Overview
5.4.2 Historic and Forecasted Market Size in Value USD and Volume Units (2017-2032F)
5.4.3 Key Market Trends, Growth Factors and Opportunities
5.4.4 Integrated: Geographic Segmentation Analysis
Chapter 6: Data Visualization Software Market by End User
6.1 Data Visualization Software Market Snapshot and Growth Engine
6.2 Data Visualization Software Market Overview
6.3 BFSI
6.3.1 Introduction and Market Overview
6.3.2 Historic and Forecasted Market Size in Value USD and Volume Units (2017-2032F)
6.3.3 Key Market Trends, Growth Factors and Opportunities
6.3.4 BFSI: Geographic Segmentation Analysis
6.4 IT and Telecom
6.4.1 Introduction and Market Overview
6.4.2 Historic and Forecasted Market Size in Value USD and Volume Units (2017-2032F)
6.4.3 Key Market Trends, Growth Factors and Opportunities
6.4.4 IT and Telecom: Geographic Segmentation Analysis
6.5 Retail and E-commerce
6.5.1 Introduction and Market Overview
6.5.2 Historic and Forecasted Market Size in Value USD and Volume Units (2017-2032F)
6.5.3 Key Market Trends, Growth Factors and Opportunities
6.5.4 Retail and E-commerce: Geographic Segmentation Analysis
6.6 Healthcare
6.6.1 Introduction and Market Overview
6.6.2 Historic and Forecasted Market Size in Value USD and Volume Units (2017-2032F)
6.6.3 Key Market Trends, Growth Factors and Opportunities
6.6.4 Healthcare: Geographic Segmentation Analysis
6.7 Manufacturing
6.7.1 Introduction and Market Overview
6.7.2 Historic and Forecasted Market Size in Value USD and Volume Units (2017-2032F)
6.7.3 Key Market Trends, Growth Factors and Opportunities
6.7.4 Manufacturing: Geographic Segmentation Analysis
6.8 Government
6.8.1 Introduction and Market Overview
6.8.2 Historic and Forecasted Market Size in Value USD and Volume Units (2017-2032F)
6.8.3 Key Market Trends, Growth Factors and Opportunities
6.8.4 Government: Geographic Segmentation Analysis
6.9 Others
6.9.1 Introduction and Market Overview
6.9.2 Historic and Forecasted Market Size in Value USD and Volume Units (2017-2032F)
6.9.3 Key Market Trends, Growth Factors and Opportunities
6.9.4 Others: Geographic Segmentation Analysis
Chapter 7: Company Profiles and Competitive Analysis
7.1 Competitive Landscape
7.1.1 Competitive Benchmarking
7.1.2 Data Visualization Software Market Share by Manufacturer (2023)
7.1.3 Industry BCG Matrix
7.1.4 Heat Map Analysis
7.1.5 Mergers and Acquisitions
7.2 ALTERYX (UNITED STATES)
7.2.1 Company Overview
7.2.2 Key Executives
7.2.3 Company Snapshot
7.2.4 Role of the Company in the Market
7.2.5 Sustainability and Social Responsibility
7.2.6 Operating Business Segments
7.2.7 Product Portfolio
7.2.8 Business Performance
7.2.9 Key Strategic Moves and Recent Developments
7.2.10 SWOT Analysis
7.3 DOMO (UNITED STATES)
7.4 IBM CORPORATION (UNITED STATES)
7.5 INFOR (UNITED STATES)
7.6 INFORMATION BUILDERS (UNITED STATES)
7.7 MICROSOFT CORPORATION (UNITED STATES)
7.8 MICROSTRATEGY (UNITED STATES)
7.9 ORACLE CORPORATION (UNITED STATES)
7.10 QLIKTECH INTERNATIONAL (UNITED STATES)
7.11 SALESFORCE (UNITED STATES)
7.12 SAP SE (GERMANY)
7.13 SISENSE (UNITED STATES)
7.14 TABLEAU SOFTWARE (UNITED STATES)
7.15 THOUGHTSPOT (UNITED STATES)
7.16 ZOHO CORPORATION (INDIA)
7.17 OTHER ACTIVE PLAYERS
Chapter 8: Global Data Visualization Software Market By Region
8.1 Overview
8.2. North America Data Visualization Software Market
8.2.1 Key Market Trends, Growth Factors and Opportunities
8.2.2 Top Key Companies
8.2.3 Historic and Forecasted Market Size by Segments
8.2.4 Historic and Forecasted Market Size By Deployment
8.2.4.1 On-Premise
8.2.4.2 Cloud
8.2.5 Historic and Forecasted Market Size By Tools
8.2.5.1 Standalone
8.2.5.2 Integrated
8.2.6 Historic and Forecasted Market Size By End User
8.2.6.1 BFSI
8.2.6.2 IT and Telecom
8.2.6.3 Retail and E-commerce
8.2.6.4 Healthcare
8.2.6.5 Manufacturing
8.2.6.6 Government
8.2.6.7 Others
8.2.7 Historic and Forecast Market Size by Country
8.2.7.1 US
8.2.7.2 Canada
8.2.7.3 Mexico
8.3. Eastern Europe Data Visualization Software Market
8.3.1 Key Market Trends, Growth Factors and Opportunities
8.3.2 Top Key Companies
8.3.3 Historic and Forecasted Market Size by Segments
8.3.4 Historic and Forecasted Market Size By Deployment
8.3.4.1 On-Premise
8.3.4.2 Cloud
8.3.5 Historic and Forecasted Market Size By Tools
8.3.5.1 Standalone
8.3.5.2 Integrated
8.3.6 Historic and Forecasted Market Size By End User
8.3.6.1 BFSI
8.3.6.2 IT and Telecom
8.3.6.3 Retail and E-commerce
8.3.6.4 Healthcare
8.3.6.5 Manufacturing
8.3.6.6 Government
8.3.6.7 Others
8.3.7 Historic and Forecast Market Size by Country
8.3.7.1 Russia
8.3.7.2 Bulgaria
8.3.7.3 The Czech Republic
8.3.7.4 Hungary
8.3.7.5 Poland
8.3.7.6 Romania
8.3.7.7 Rest of Eastern Europe
8.4. Western Europe Data Visualization Software Market
8.4.1 Key Market Trends, Growth Factors and Opportunities
8.4.2 Top Key Companies
8.4.3 Historic and Forecasted Market Size by Segments
8.4.4 Historic and Forecasted Market Size By Deployment
8.4.4.1 On-Premise
8.4.4.2 Cloud
8.4.5 Historic and Forecasted Market Size By Tools
8.4.5.1 Standalone
8.4.5.2 Integrated
8.4.6 Historic and Forecasted Market Size By End User
8.4.6.1 BFSI
8.4.6.2 IT and Telecom
8.4.6.3 Retail and E-commerce
8.4.6.4 Healthcare
8.4.6.5 Manufacturing
8.4.6.6 Government
8.4.6.7 Others
8.4.7 Historic and Forecast Market Size by Country
8.4.7.1 Germany
8.4.7.2 UK
8.4.7.3 France
8.4.7.4 The Netherlands
8.4.7.5 Italy
8.4.7.6 Spain
8.4.7.7 Rest of Western Europe
8.5. Asia Pacific Data Visualization Software Market
8.5.1 Key Market Trends, Growth Factors and Opportunities
8.5.2 Top Key Companies
8.5.3 Historic and Forecasted Market Size by Segments
8.5.4 Historic and Forecasted Market Size By Deployment
8.5.4.1 On-Premise
8.5.4.2 Cloud
8.5.5 Historic and Forecasted Market Size By Tools
8.5.5.1 Standalone
8.5.5.2 Integrated
8.5.6 Historic and Forecasted Market Size By End User
8.5.6.1 BFSI
8.5.6.2 IT and Telecom
8.5.6.3 Retail and E-commerce
8.5.6.4 Healthcare
8.5.6.5 Manufacturing
8.5.6.6 Government
8.5.6.7 Others
8.5.7 Historic and Forecast Market Size by Country
8.5.7.1 China
8.5.7.2 India
8.5.7.3 Japan
8.5.7.4 South Korea
8.5.7.5 Malaysia
8.5.7.6 Thailand
8.5.7.7 Vietnam
8.5.7.8 The Philippines
8.5.7.9 Australia
8.5.7.10 New Zealand
8.5.7.11 Rest of APAC
8.6. Middle East & Africa Data Visualization Software Market
8.6.1 Key Market Trends, Growth Factors and Opportunities
8.6.2 Top Key Companies
8.6.3 Historic and Forecasted Market Size by Segments
8.6.4 Historic and Forecasted Market Size By Deployment
8.6.4.1 On-Premise
8.6.4.2 Cloud
8.6.5 Historic and Forecasted Market Size By Tools
8.6.5.1 Standalone
8.6.5.2 Integrated
8.6.6 Historic and Forecasted Market Size By End User
8.6.6.1 BFSI
8.6.6.2 IT and Telecom
8.6.6.3 Retail and E-commerce
8.6.6.4 Healthcare
8.6.6.5 Manufacturing
8.6.6.6 Government
8.6.6.7 Others
8.6.7 Historic and Forecast Market Size by Country
8.6.7.1 Turkiye
8.6.7.2 Bahrain
8.6.7.3 Kuwait
8.6.7.4 Saudi Arabia
8.6.7.5 Qatar
8.6.7.6 UAE
8.6.7.7 Israel
8.6.7.8 South Africa
8.7. South America Data Visualization Software Market
8.7.1 Key Market Trends, Growth Factors and Opportunities
8.7.2 Top Key Companies
8.7.3 Historic and Forecasted Market Size by Segments
8.7.4 Historic and Forecasted Market Size By Deployment
8.7.4.1 On-Premise
8.7.4.2 Cloud
8.7.5 Historic and Forecasted Market Size By Tools
8.7.5.1 Standalone
8.7.5.2 Integrated
8.7.6 Historic and Forecasted Market Size By End User
8.7.6.1 BFSI
8.7.6.2 IT and Telecom
8.7.6.3 Retail and E-commerce
8.7.6.4 Healthcare
8.7.6.5 Manufacturing
8.7.6.6 Government
8.7.6.7 Others
8.7.7 Historic and Forecast Market Size by Country
8.7.7.1 Brazil
8.7.7.2 Argentina
8.7.7.3 Rest of SA
Chapter 9 Analyst Viewpoint and Conclusion
9.1 Recommendations and Concluding Analysis
9.2 Potential Market Strategies
Chapter 10 Research Methodology
10.1 Research Process
10.2 Primary Research
10.3 Secondary Research
|
Global Data Visualization Software Market |
|||
|
Base Year: |
2023 |
Forecast Period: |
2024-2032 |
|
Historical Data: |
2017 to 2023 |
Market Size in 2023: |
USD 8.3 Billion |
|
Forecast Period 2024-32 CAGR: |
11.1 % |
Market Size in 2032: |
USD 21.40 Billion |
|
Segments Covered: |
By Deployment |
|
|
|
By Tools |
|
||
|
By End User |
|
||
|
By Region |
|
||
|
Key Market Drivers: |
|
||
|
Key Market Restraints: |
|
||
|
Key Opportunities: |
|
||
|
Companies Covered in the report: |
|
||


