


Collaborative Product Definition Management Market Synopsis
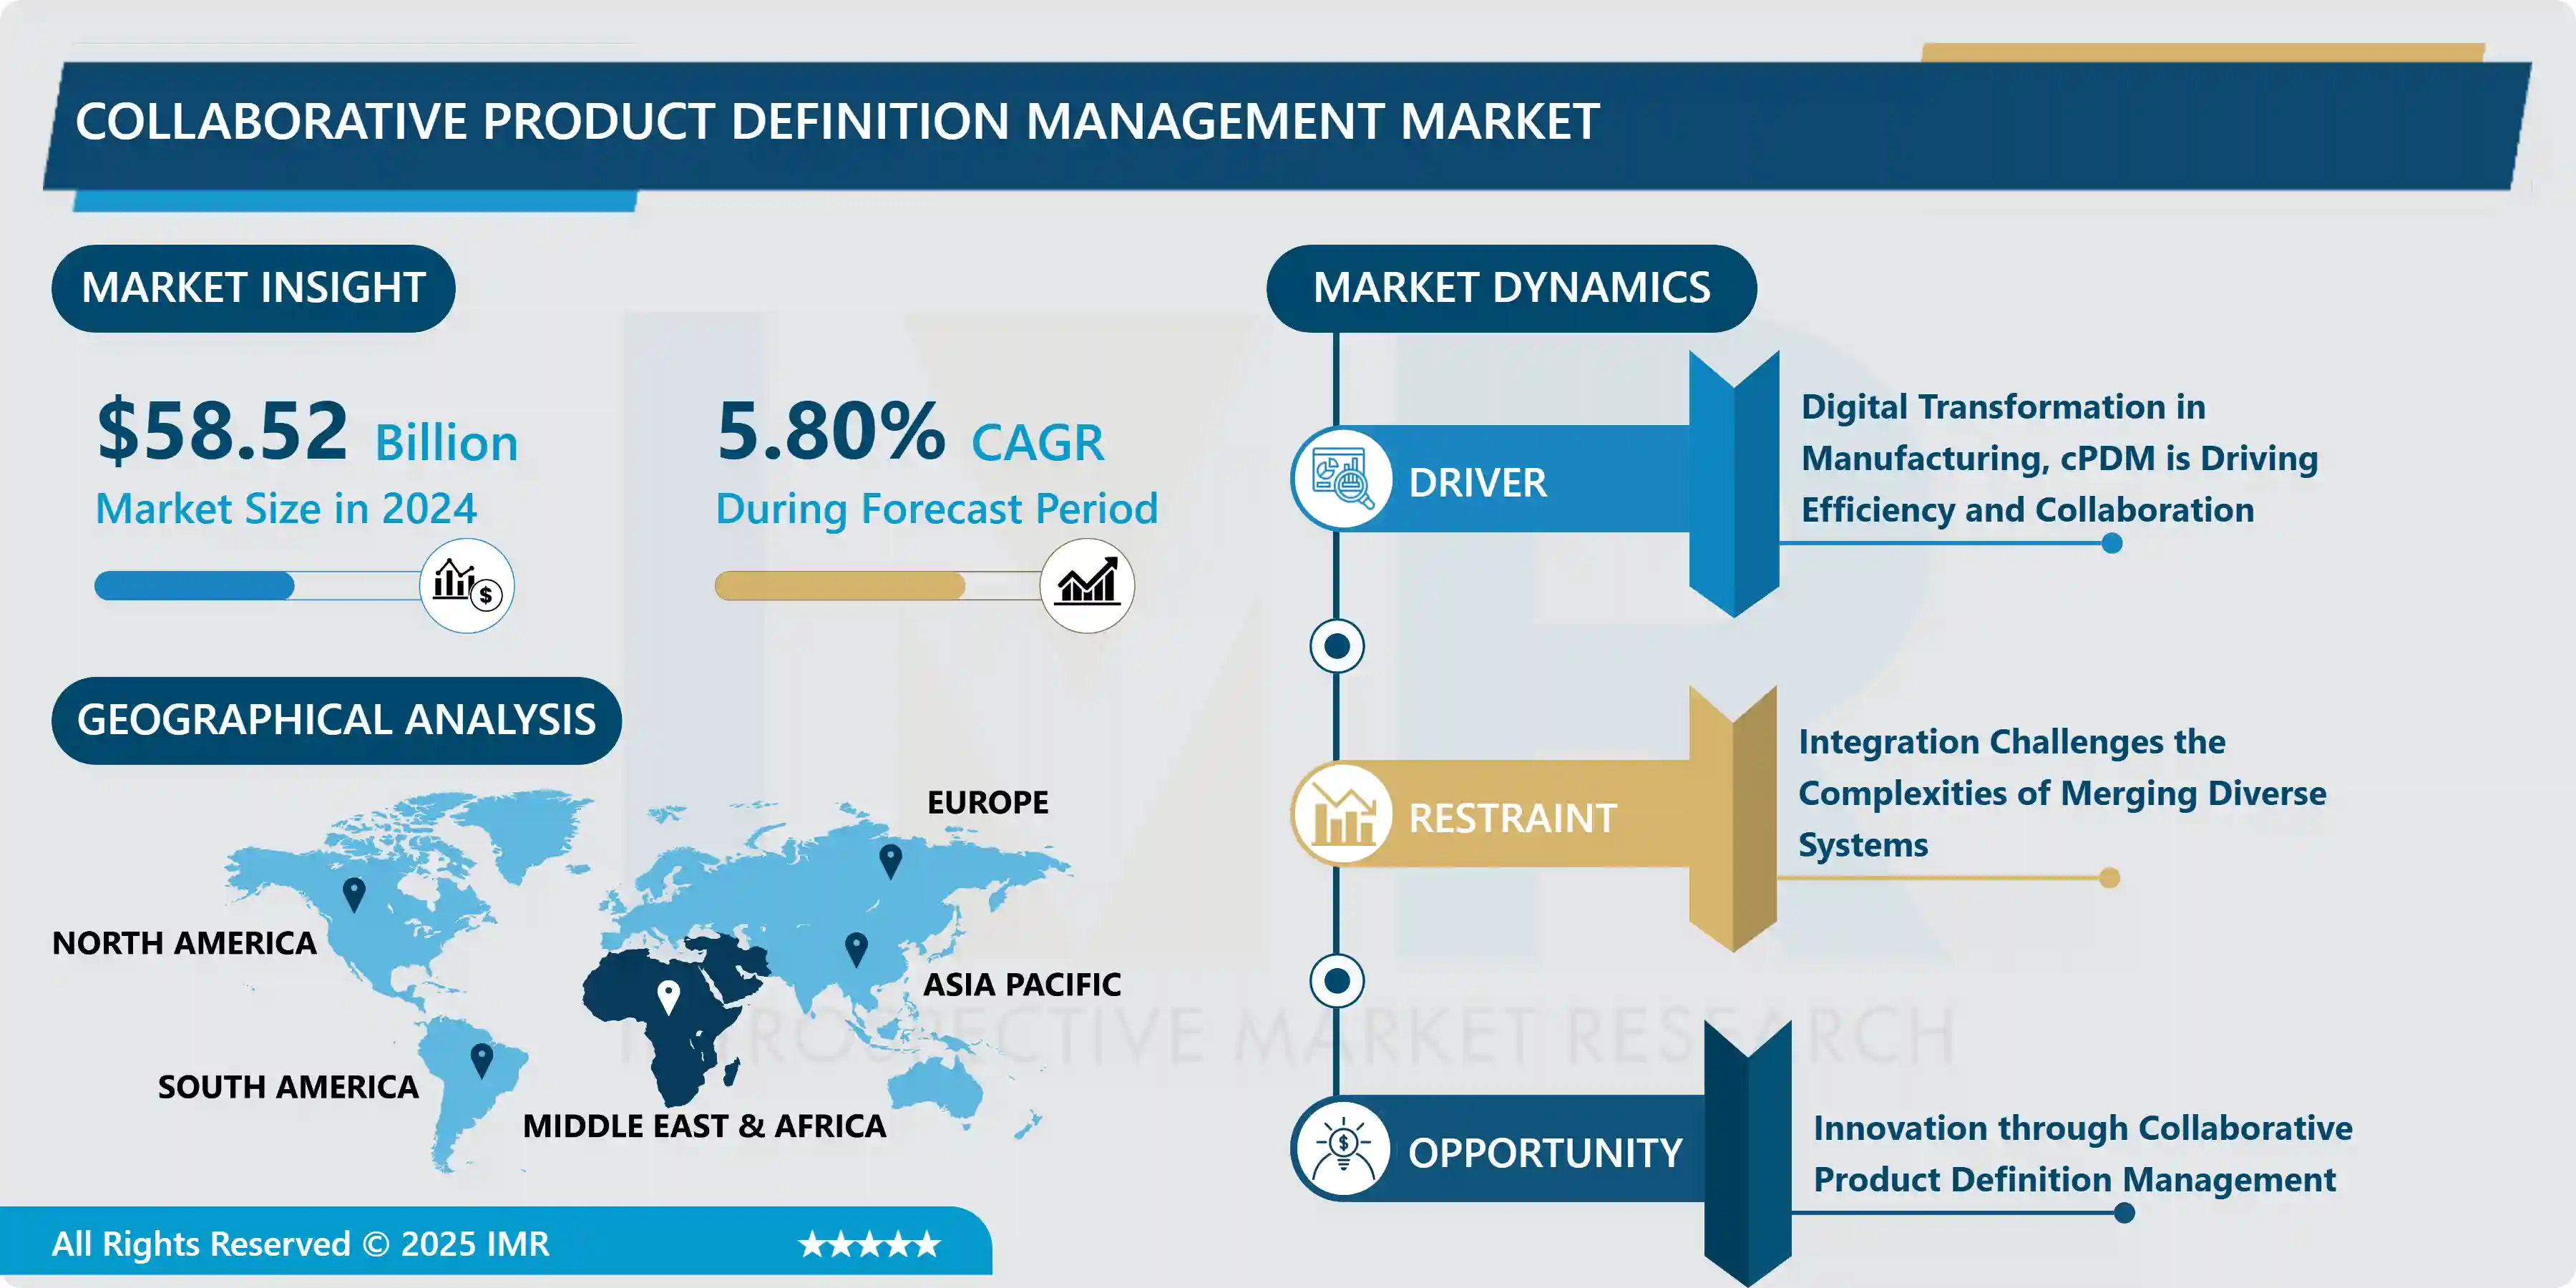
Collaborative Product Definition Management Market Size Was Valued at USD 58.52 Billion in 2023 and is Projected to Reach USD 91.87 Billion by 2032, Growing at a CAGR of 5.80% From 2024-2032.
The Collaborative Product Definition Management Market encompasses platforms and software solutions that assist businesses in managing the entire product lifecycle, including inception, design, production, and maintenance. cPDM software facilitates team collaboration during the product development process, enables the sharing and management of product data, optimizes workflows, and ensures regulatory conformance. It is of the utmost importance in augmenting product quality, decreasing time-to-market, and optimizing product development processes in general.
The market for Collaborative Product Definition Management is predominantly propelled by the escalating intricacy of product development procedures and the expanding requirement for cooperation among diverse product design and development teams. cPDM solutions provide a centralized platform that ensures all stakeholders have access to the most recent information by enabling companies to manage product data, documents, and processes throughout the product lifecycle.
Furthermore, the increasing implementation of automation and digitalization within the manufacturing sector is driving the need for cPDM solutions. These solutions assist organizations in optimizing their product development procedures, decreasing time-to-market, and enhancing product quality through facilitating improved interdepartmental and interteam collaboration and communication.
Furthermore, the increasing emphasis on minimizing expenses and optimizing operations is motivating organizations to implement cPDM solutions. Organizations can enhance overall productivity, minimize errors, and eliminate redundant duties by implementing centralized processes and product data.
Increasing demand for innovative and customized products is an additional factor driving the expansion of the cPDM market. cPDM solutions facilitate the effective administration of complex product development, thereby enabling organizations to introduce novel and advanced products to the market at an accelerated pace.
Collaborative Product Definition Management Market Trend Analysis
Transforming Product Development: The Rise of Integrated cPDM Solutions
- In recent years, Collaborative Product Definition Management (cPDM) has undergone a substantial integration and digitalization trend. In an effort to optimize time-to-market, facilitate collaboration, and streamline product development processes, cPDM solutions have arisen as a crucial enabler across industries.
- An emerging phenomenon involves the amalgamation of cPDM with additional enterprise systems, including MES (Manufacturing Execution Systems), PLM (Product Lifecycle Management), and ERP (Enterprise Resource Planning). This integration facilitates uninterrupted collaboration and data exchange throughout various departments and phases of the product lifecycle.
- A further significant development is the implementation of cloud-based cPDM solutions. By virtue of its scalability, adaptability, and cost-effectiveness, cloud deployment presents itself as an appealing alternative for enterprises seeking to update their product development methodologies.
- Furthermore, in cPDM, an increasing emphasis is being placed on cutting-edge technologies like AI (Artificial Intelligence) and IoT (Internet of Things). In addition to facilitating digital twins and predictive analytics, these technologies have the potential to augment product development and decision-making procedures.
The Rise of cPDM, Meeting the Challenges of Innovation and Globalization
- Due to a number of pivotal factors, the Collaborative Product Definition Management (cPDM) market is undergoing substantial expansion and change. Increasing product development process complexity, necessitated by the need for innovation, quicker time-to-market, and cost-effectiveness, is one of the primary drivers. In an effort to reduce costs and time while developing high-quality products, cPDM solutions have become indispensable.
- An additional important factor propelling the cPDM market is the industry-wide expansion of digital transformation. In order to optimize their decision-making, collaboration, and expedite their product development processes, businesses are increasingly implementing digital technologies. By delivering a centralized platform for the management of product data, documents, and processes, cPDM solutions are vital to this transformation.
- Furthermore, as a consequence of the expanding phenomenon of globalization, product development teams are now geographically dispersed. By facilitating communication and collaboration and providing real-time access to product information, cPDM solutions enable these teams to work in unison.
- Moreover, the growing emphasis on environmental regulations and sustainability is propelling the implementation of cPDM solutions. These solutions facilitate the development of environmentally sustainable products for companies by allowing them to assess the environmental consequences of their products even during the design stage.
Collaborative Product Definition Management Market Segment Analysis:
Collaborative Product Definition Management Market is Segmented on the basis of Enterprise size, Industry, and end-users.
By Enterprise Size, segment is expected to dominate the market during the forecast period
- The magnitude and extent of business activities are significantly influenced by the scale and scope of the enterprise, with unique attributes and difficulties linked to each enterprise size category. In general, Small and Medium Enterprises (SMEs) exhibit a reduced workforce and generate lower revenues in comparison to Large Enterprises (LEs). SMEs are renowned for their nimbleness and capacity to promptly adjust to market fluctuations as a result of their reduced scale and simplified organizational framework. They frequently encounter obstacles such as capital and labor shortages, both of which can hinder their ability to compete with larger rivals. Nevertheless, small and medium-sized enterprises (SMEs) possess the benefit of accelerated innovation and prompt consumer response, which confers upon them a competitive advantage in specific markets.
- Conversely, Large Enterprises (LEs) are distinguished by their substantial operational magnitude, vast resource allocation, and hierarchical organizational framework. Larger enterprises (SMEs) frequently enjoy superior financial stability and a more extensive market presence. Nevertheless, their scale may impede their ability to promptly respond to market fluctuations and increase the bureaucracy associated with decision-making. LEs generally operate with greater complexity, necessitating the implementation of advanced management strategies in order to sustain efficiency and competitiveness. Notwithstanding these obstacles, LEs benefit from economies of scale, which enable them to achieve increased profit margins and decreased production costs.
By Industry, segment held the largest share in 2023
- The industry sector exhibits a wide range of specializations, including but not limited to manufacturing, banking and financial services (BFS), telecommunications, information technology (IT), retail, healthcare, logistics, and education. Every industry possesses distinct attributes, obstacles, and prospects.
- The manufacturing sector is an essential industry that encompasses the creation of every type of product, from automobiles to consumer electronics. It is financially vital to worldwide progress and provides employment for a substantial proportion of the world's labor force. Financial institutions such as banks, insurance companies, and others that offer lending, investment, and risk management are included in the BFS sector. The IT and telecommunications sectors are dynamic industries that foster connectivity and innovation, facilitating global communication and information access for both organizations and individuals.
- The retail sector is a dynamic industry characterized by the provision of products and services to customers via a variety of channels, such as physical locations and digital platforms. The healthcare industry is an essential sector that prioritizes the prevention, diagnosis, and treatment of diseases, in addition to the promotion of well-being and health as a whole. The efficient movement of products from manufacturers to consumers requires logistics, which consists of transportation, warehousing, and distribution.
- Education is a critical sector that provides individuals of all ages with learning opportunities and skill development. Additional sectors that comprise other industries comprise agriculture, construction, energy, and entertainment, all of which make distinct contributions to the worldwide economy.
Collaborative Product Definition Management Market Regional Insights:
EMEA is Expected to Dominate the Market Over the Forecast Period
- A substantial market for Collaborative Product Definition Management (cPDM) is the EMEA (Europe, Middle East, and Africa) region. Critical to the management of product data and processes throughout the product lifecycle, from inception to disposal, are cPDM solutions. Prominent consumers of cPDM solutions in EMEA include the automotive, aerospace, defense, and industrial machinery sectors.
- As a result of the need for efficient collaboration among geographically dispersed teams and the escalating complexity of product development processes, the EMEA market is marked by a rising demand for cPDM. cPDM assists businesses in streamlining their product development operations, enhancing product quality, reducing time-to-market, and fostering collaboration.
- Adoption of digitalization and Industry 4.0 practices, which are propelling the demand for advanced product lifecycle management (PLM) solutions, are significant market drivers in EMEA for cPDM. Furthermore, the aerospace and defense sectors, which have increasingly stringent regulatory requirements, are driving the need for cPDM solutions that can guarantee traceability and compliance.
- The EMEA cPDM market can be categorized according to organization size (small and medium-sized enterprises and large enterprises), deployment mode (cloud-based and on-premises), and verticals (including automotive, aerospace and defense, industrial machinery, electronics and semiconductor, and others).
Active Key Players in the Collaborative Product Definition Management Market
- Dassault Systèmes (France)
- Siemens PLM Software (Germany)
- PTC (United States)
- Autodesk (United States)
- IBM (United States)
- SAP SE (Germany)
- Oracle (United States)
- HP (United States)
- Atos SE (France)
- Accenture (Ireland)
- Others
|
Global Collaborative Product Definition Management Market |
|||
|
Base Year: |
2024 |
Forecast Period: |
2024-2032 |
|
Historical Data: |
2017 to 2023 |
Market Size in 2023: |
USD 58.52 Bn. |
|
Forecast Period 2024-32 CAGR: |
5.80 % |
Market Size in 2032: |
USD 91.87 Bn. |
|
Segments Covered: |
By Enterprise Size |
|
|
|
By Industry |
|
||
|
By Region |
|
||
|
Key Market Drivers: |
|
||
|
Key Market Restraints: |
|
||
|
Key Opportunities: |
|
||
|
Companies Covered in the report: |
|
||
Chapter 1: Introduction
1.1 Scope and Coverage
Chapter 2:Executive Summary
Chapter 3: Market Landscape
3.1 Market Dynamics
3.1.1 Drivers
3.1.2 Restraints
3.1.3 Opportunities
3.1.4 Challenges
3.2 Market Trend Analysis
3.3 PESTLE Analysis
3.4 Porter's Five Forces Analysis
3.5 Industry Value Chain Analysis
3.6 Ecosystem
3.7 Regulatory Landscape
3.8 Price Trend Analysis
3.9 Patent Analysis
3.10 Technology Evolution
3.11 Investment Pockets
3.12 Import-Export Analysis
Chapter 4: Collaborative Product Definition Management (cPDM) Market by Enterprise Size (2018-2032)
4.1 Collaborative Product Definition Management (cPDM) Market Snapshot and Growth Engine
4.2 Market Overview
4.3 Small
4.3.1 Introduction and Market Overview
4.3.2 Historic and Forecasted Market Size in Value USD and Volume Units
4.3.3 Key Market Trends, Growth Factors, and Opportunities
4.3.4 Geographic Segmentation Analysis
4.4 Medium
4.5 Large
Chapter 5: Collaborative Product Definition Management (cPDM) Market by Industry (2018-2032)
5.1 Collaborative Product Definition Management (cPDM) Market Snapshot and Growth Engine
5.2 Market Overview
5.3 Manufacturing
5.3.1 Introduction and Market Overview
5.3.2 Historic and Forecasted Market Size in Value USD and Volume Units
5.3.3 Key Market Trends, Growth Factors, and Opportunities
5.3.4 Geographic Segmentation Analysis
5.4 BFS
5.5 IT & Telecom
5.6 Retail
5.7 Healthcare
5.8 Logistics
5.9 Education
5.10 Others
Chapter 6: Company Profiles and Competitive Analysis
6.1 Competitive Landscape
6.1.1 Competitive Benchmarking
6.1.2 Collaborative Product Definition Management (cPDM) Market Share by Manufacturer (2024)
6.1.3 Industry BCG Matrix
6.1.4 Heat Map Analysis
6.1.5 Mergers and Acquisitions
6.2 FEDEX (USA)
6.2.1 Company Overview
6.2.2 Key Executives
6.2.3 Company Snapshot
6.2.4 Role of the Company in the Market
6.2.5 Sustainability and Social Responsibility
6.2.6 Operating Business Segments
6.2.7 Product Portfolio
6.2.8 Business Performance
6.2.9 Key Strategic Moves and Recent Developments
6.2.10 SWOT Analysis
6.3 UTI WORLDWIDE (USA)
6.4 RYDER SYSTEM (USA)
6.5 CEVA HOLDINGS (NETHERLANDS)
6.6 DEUTSCHE BAHN (GERMANY)
6.7 AGILITY (KUWAIT)
6.8 SCHNEIDER (USA)
6.9 UPS (USA)
6.10 EXPEDITORS (USA)
6.11 APL LOGISTICS (SINGAPORE)
6.12 C.H. ROBINSON (USA)
6.13 EAGLE GLOBAL LOGISTICS (USA)
6.14 EXEL (UK)
6.15 MENLO WORLDWIDE (USA)
6.16 NEXUS DISTRIBUTION (USA)
6.17 NIPPON EXPRESS (JAPAN)
6.18 NYK LOGISTICS (JAPAN)
6.19 PANALPINA (SWITZERLAND)
6.20 PENSKE LOGISTICS (USA)
6.21 OTHERS
Chapter 7: Global Collaborative Product Definition Management (cPDM) Market By Region
7.1 Overview
7.2. North America Collaborative Product Definition Management (cPDM) Market
7.2.1 Key Market Trends, Growth Factors and Opportunities
7.2.2 Top Key Companies
7.2.3 Historic and Forecasted Market Size by Segments
7.2.4 Historic and Forecasted Market Size by Enterprise Size
7.2.4.1 Small
7.2.4.2 Medium
7.2.4.3 Large
7.2.5 Historic and Forecasted Market Size by Industry
7.2.5.1 Manufacturing
7.2.5.2 BFS
7.2.5.3 IT & Telecom
7.2.5.4 Retail
7.2.5.5 Healthcare
7.2.5.6 Logistics
7.2.5.7 Education
7.2.5.8 Others
7.2.6 Historic and Forecast Market Size by Country
7.2.6.1 US
7.2.6.2 Canada
7.2.6.3 Mexico
7.3. Eastern Europe Collaborative Product Definition Management (cPDM) Market
7.3.1 Key Market Trends, Growth Factors and Opportunities
7.3.2 Top Key Companies
7.3.3 Historic and Forecasted Market Size by Segments
7.3.4 Historic and Forecasted Market Size by Enterprise Size
7.3.4.1 Small
7.3.4.2 Medium
7.3.4.3 Large
7.3.5 Historic and Forecasted Market Size by Industry
7.3.5.1 Manufacturing
7.3.5.2 BFS
7.3.5.3 IT & Telecom
7.3.5.4 Retail
7.3.5.5 Healthcare
7.3.5.6 Logistics
7.3.5.7 Education
7.3.5.8 Others
7.3.6 Historic and Forecast Market Size by Country
7.3.6.1 Russia
7.3.6.2 Bulgaria
7.3.6.3 The Czech Republic
7.3.6.4 Hungary
7.3.6.5 Poland
7.3.6.6 Romania
7.3.6.7 Rest of Eastern Europe
7.4. Western Europe Collaborative Product Definition Management (cPDM) Market
7.4.1 Key Market Trends, Growth Factors and Opportunities
7.4.2 Top Key Companies
7.4.3 Historic and Forecasted Market Size by Segments
7.4.4 Historic and Forecasted Market Size by Enterprise Size
7.4.4.1 Small
7.4.4.2 Medium
7.4.4.3 Large
7.4.5 Historic and Forecasted Market Size by Industry
7.4.5.1 Manufacturing
7.4.5.2 BFS
7.4.5.3 IT & Telecom
7.4.5.4 Retail
7.4.5.5 Healthcare
7.4.5.6 Logistics
7.4.5.7 Education
7.4.5.8 Others
7.4.6 Historic and Forecast Market Size by Country
7.4.6.1 Germany
7.4.6.2 UK
7.4.6.3 France
7.4.6.4 The Netherlands
7.4.6.5 Italy
7.4.6.6 Spain
7.4.6.7 Rest of Western Europe
7.5. Asia Pacific Collaborative Product Definition Management (cPDM) Market
7.5.1 Key Market Trends, Growth Factors and Opportunities
7.5.2 Top Key Companies
7.5.3 Historic and Forecasted Market Size by Segments
7.5.4 Historic and Forecasted Market Size by Enterprise Size
7.5.4.1 Small
7.5.4.2 Medium
7.5.4.3 Large
7.5.5 Historic and Forecasted Market Size by Industry
7.5.5.1 Manufacturing
7.5.5.2 BFS
7.5.5.3 IT & Telecom
7.5.5.4 Retail
7.5.5.5 Healthcare
7.5.5.6 Logistics
7.5.5.7 Education
7.5.5.8 Others
7.5.6 Historic and Forecast Market Size by Country
7.5.6.1 China
7.5.6.2 India
7.5.6.3 Japan
7.5.6.4 South Korea
7.5.6.5 Malaysia
7.5.6.6 Thailand
7.5.6.7 Vietnam
7.5.6.8 The Philippines
7.5.6.9 Australia
7.5.6.10 New Zealand
7.5.6.11 Rest of APAC
7.6. Middle East & Africa Collaborative Product Definition Management (cPDM) Market
7.6.1 Key Market Trends, Growth Factors and Opportunities
7.6.2 Top Key Companies
7.6.3 Historic and Forecasted Market Size by Segments
7.6.4 Historic and Forecasted Market Size by Enterprise Size
7.6.4.1 Small
7.6.4.2 Medium
7.6.4.3 Large
7.6.5 Historic and Forecasted Market Size by Industry
7.6.5.1 Manufacturing
7.6.5.2 BFS
7.6.5.3 IT & Telecom
7.6.5.4 Retail
7.6.5.5 Healthcare
7.6.5.6 Logistics
7.6.5.7 Education
7.6.5.8 Others
7.6.6 Historic and Forecast Market Size by Country
7.6.6.1 Turkiye
7.6.6.2 Bahrain
7.6.6.3 Kuwait
7.6.6.4 Saudi Arabia
7.6.6.5 Qatar
7.6.6.6 UAE
7.6.6.7 Israel
7.6.6.8 South Africa
7.7. South America Collaborative Product Definition Management (cPDM) Market
7.7.1 Key Market Trends, Growth Factors and Opportunities
7.7.2 Top Key Companies
7.7.3 Historic and Forecasted Market Size by Segments
7.7.4 Historic and Forecasted Market Size by Enterprise Size
7.7.4.1 Small
7.7.4.2 Medium
7.7.4.3 Large
7.7.5 Historic and Forecasted Market Size by Industry
7.7.5.1 Manufacturing
7.7.5.2 BFS
7.7.5.3 IT & Telecom
7.7.5.4 Retail
7.7.5.5 Healthcare
7.7.5.6 Logistics
7.7.5.7 Education
7.7.5.8 Others
7.7.6 Historic and Forecast Market Size by Country
7.7.6.1 Brazil
7.7.6.2 Argentina
7.7.6.3 Rest of SA
Chapter 8 Analyst Viewpoint and Conclusion
8.1 Recommendations and Concluding Analysis
8.2 Potential Market Strategies
Chapter 9 Research Methodology
9.1 Research Process
9.2 Primary Research
9.3 Secondary Research
|
Global Collaborative Product Definition Management Market |
|||
|
Base Year: |
2024 |
Forecast Period: |
2024-2032 |
|
Historical Data: |
2017 to 2023 |
Market Size in 2023: |
USD 58.52 Bn. |
|
Forecast Period 2024-32 CAGR: |
5.80 % |
Market Size in 2032: |
USD 91.87 Bn. |
|
Segments Covered: |
By Enterprise Size |
|
|
|
By Industry |
|
||
|
By Region |
|
||
|
Key Market Drivers: |
|
||
|
Key Market Restraints: |
|
||
|
Key Opportunities: |
|
||
|
Companies Covered in the report: |
|
||


