


Key Market Highlights
Clinical Trial Imaging Market Size Was Valued at USD 1.20 Billion in 2024, and is Projected to Reach USD 2.47 Billion by 2035, Growing at a CAGR of 6.8% from 2025-2035.
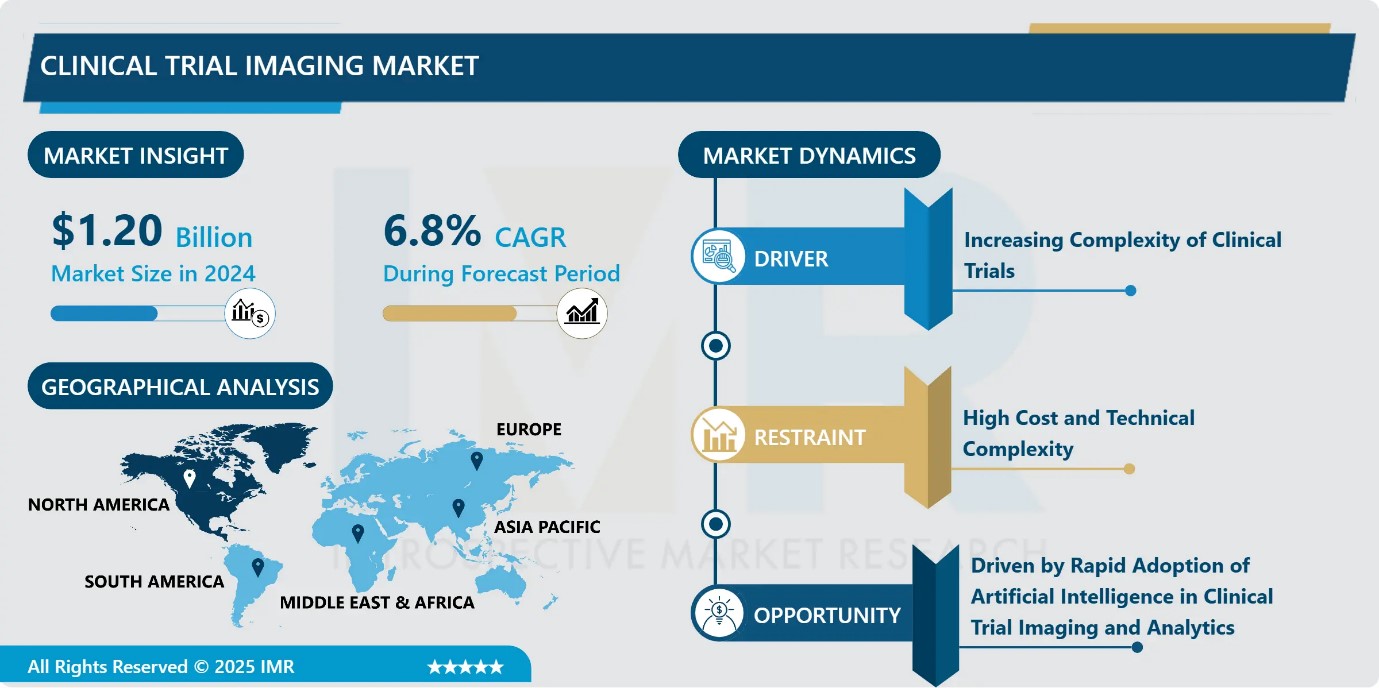
- Market Size in 2024: USD 1.20 Billion
- Projected Market Size by 2035: USD 2.47 Billion
- CAGR (2025–2035): 6.8%
- Leading Market in 2024: North America
- Fastest-Growing Market: Asia-Pacific
- By Therapeutic Area: The Oncology segment is anticipated to lead the market by accounting for 28% of the market share throughout the forecast period.
- By End Users: The Pharmaceutical & Biotechnology Companies segment is expected to capture 26.3% of the market share, thereby maintaining its dominance over the forecast period.
- By Region: The North America region is projected to hold 32.9% of the market share during the forecast period.
- Active Players: Calyx (formerly Perceptive Informatics) (UK/USA), Cardiovascular Imaging Technologies (USA), ICON plc (Ireland), Intrinsic Imaging LLC (USA), and Other Active Players.
Clinical Trial Imaging Market Synopsis:
The clinical trial imaging market involves the use of advanced imaging technologies such as MRI, CT, and PET combined with software and AI-driven analytics to collect, analyze, and manage imaging data in clinical studies. This market is expanding rapidly due to rising pharmaceutical R&D investments, the growing adoption of imaging biomarkers, and the need for precise, standardized endpoints in complex therapeutic areas like oncology, cardiology, and neurology. Technological advancements, including AI-based image analysis, portable imaging devices, and virtual imaging trials, are improving workflow efficiency, data accuracy, and regulatory compliance. The COVID-19 pandemic accelerated the adoption of decentralized and hybrid trial models, while mergers, acquisitions, and strategic partnerships are further integrating imaging services, fueling market growth and shaping a more efficient, technology-driven landscape.
Clinical Trial Imaging Market Dynamics and Trend Analysis:
Clinical Trial Imaging Market Growth Driver-Increasing Complexity of Clinical Trials
- The growing complexity of clinical trials is a major driver of the clinical trial imaging market. As drug development shifts toward targeted therapies, particularly in oncology and rare diseases, sponsors require precise, non-invasive tools to evaluate treatment efficacy and disease progression. Advanced imaging modalities such as MRI, CT, and PET are increasingly integral to modern trial protocols, enabling quantitative and reproducible assessments through imaging biomarkers. The rising number of oncology trials incorporating imaging endpoints underscores this trend. As imaging biomarkers gain acceptance as reliable primary and secondary endpoints, demand for specialized imaging services, standardized workflows, and advanced technologies continues to accelerate, supporting sustained market growth.
Clinical Trial Imaging Market Limiting Factor-High Cost and Technical Complexity
- The clinical trial imaging market is constrained by high capital and operational costs associated with advanced imaging technologies. Modalities such as PET-CT and high-field MRI require substantial upfront investment, ongoing maintenance, and frequent software upgrades, increasing the total cost of ownership. In addition, specialized infrastructure and highly trained radiologists and technicians are essential to operate and interpret imaging data accurately. These financial and technical barriers limit adoption, particularly among small biotechnology companies and academic research centers in emerging markets. As imaging expenses represent a significant share of overall clinical trial costs, budget constraints and regulatory compliance requirements continue to restrain broader market expansion.
Clinical Trial Imaging Market Expansion Opportunity-Driven by Rapid Adoption of Artificial Intelligence in Clinical Trial Imaging and Analytics
- The accelerating adoption of artificial intelligence (AI) in clinical trial imaging represents a significant market opportunity. Over half of healthcare organizations now use AI in at least one imaging workflow. In clinical trials, AI streamlines image quality control, detects protocol deviations, and rapidly generates quantitative biomarkers, reducing analysis timelines and inter-reader variability. Leading vendors are expanding integrated AI platforms through acquisitions and advanced analytics capabilities. Regulatory acceptance is strengthening, with hundreds of AI imaging solutions cleared globally. As sponsors move beyond pilots, scalable AI-enabled imaging services are poised for rapid growth over the next two years.
Clinical Trial Imaging Market Challenge and Risk-Shortage of Skilled Imaging Professionals
- A persistent shortage of skilled imaging professionals presents a major challenge to the clinical trial imaging market. Complex trial designs require technologists, physicists, and image analysts with expertise in Good Clinical Practice, multimodal imaging, and regulatory submission standards. However, global demand continues to outpace supply, particularly in specialized areas such as nuclear medicine and advanced MRI. Even large service providers face ongoing recruitment pressures in developed regions. While remote monitoring tools and AI-assisted acquisition workflows help mitigate staffing gaps, their implementation requires regulatory approval and secure data infrastructure, adding complexity and slowing widespread adoption.
Clinical Trial Imaging Market Trend-Advancing Imaging Technologies and Personalized Medicine
- Rapid technological innovation is shaping a key trend in the clinical trial imaging market. Next-generation imaging modalities, including advanced CT, PET-MRI, and MRI systems, are improving image quality, reducing patient risk, and enabling more precise assessment of treatment response. The integration of AI, machine learning, and cloud-based platforms is further enhancing data accuracy, workflow efficiency, and real-time collaboration across trial sites. Simultaneously, the growing focus on personalized medicine is increasing reliance on imaging to identify patient-specific biomarkers and stratify populations. Together, these trends are expanding imaging’s role in trial design, decentralized studies, and precision-driven drug development.
Clinical Trial Imaging Market Segment Analysis:
Clinical Trial Imaging Market is segmented based on Product & Service, Modality, Therapeutic Area, Application, End Users, and Region.
By Therapeutic Area, Oncology segment is expected to dominate the market with around 28% share during the forecast period.
- Oncology remains the leading therapeutic area in the clinical trial imaging market, accounting for approximately 28% of total revenue in 2024. Its dominance is driven by the heavy reliance on imaging across all phases of cancer drug development, particularly for solid tumors. Standardized response criteria such as RECIST, along with bone lesion assessment and theranostic radiopharmaceuticals, make imaging essential for efficacy and safety evaluation. The rapid expansion of immuno-oncology therapies and tissue-agnostic treatments further increases imaging intensity. Advanced technologies, including total-body PET and AI-enabled CT, support earlier and more precise response assessment, reinforcing oncology’s market leadership.
By End User, Pharmaceutical and biotechnology is expected to dominate with close to 26.3% market share during the forecast period.
- Pharmaceutical and biotechnology companies dominated the clinical trial imaging market by end user in 2024, accounting for approximately 26.3% of total revenue. Their leadership is driven by direct investment in imaging core lab services, software platforms, and equipment leasing to support expansive R&D pipelines. These sponsors maintain strong control over protocol design and vendor selection, ensuring imaging alignment with regulatory and scientific objectives.
- Continued growth in GLP-1, monoclonal antibody, oncology, metabolic, and cardiovascular drug development sustains high imaging demand. While partnerships with CROs and technology providers are increasing, pharma and biotech companies remain the primary decision-makers and budget holders, reinforcing their market dominance.
Clinical Trial Imaging Market Regional Insights:
North America region is estimated to lead the market with around 32.9% share during the forecast period.
- North America led the global clinical trial imaging market, holding 32.9% in 2024, driven by its mature clinical research ecosystem, dense network of specialized imaging centers, and strong pharma–biotech–academic collaborations. The region’s dominance is supported by high R&D activity, a growing elderly population, rising prevalence of chronic and rare diseases, and extensive use of advanced technologies, including hybrid, molecular, and AI-enabled imaging systems.
- Favorable regulatory frameworks, skilled professionals, and robust funding from pharmaceutical companies and research institutions further reinforce leadership. The U.S., as the primary hub, sees increased adoption of innovative imaging solutions and private-equity–backed consolidation, sustaining market growth.
Clinical Trial Imaging Market Active Players:
- Calyx (formerly Perceptive Informatics) (USA)
- Cardiovascular Imaging Technologies (USA)
- Clario (Ireland)
- ICON plc (Ireland)
- Intrinsic Imaging LLC (USA)
- IXICO plc (United Kingdom)
- Imaging Endpoints (USA)
- Medpace (USA)
- Median Technologies (France)
- Navitas Life Sciences (USA)
- Parexel International (USA)
- Prism Clinical Imaging (USA)
- Radiant Sage LLC (USA)
- Resonance Health Ltd. (Australia)
- VirtualScopics Inc. (USA)
- Other Active Players
Key Industry Developments in the Clinical Trial Imaging Market:
- In January 2025, Medpace expanded its imaging core lab in Cincinnati. The upgrade enhanced capabilities for advanced MRI and OCT analysis. These improvements support more comprehensive clinical trial imaging.
- In March 2025, Clario acquired NeuroRx to boost its neuro-imaging expertise.
The focus is on Alzheimer’s and Parkinson’s clinical studies. This acquisition strengthens Clario’s imaging services for neurological trials.
Technical Overview of the Clinical Trial Imaging Market
- The clinical trial imaging market encompasses specialized technologies, software platforms, and services that support image acquisition, management, analysis, and regulatory submission across all phases of clinical research. It integrates multiple imaging modalities, including MRI, CT, PET, SPECT, and ultrasound, each selected based on therapeutic area and endpoint requirements. Technically, the market relies on standardized imaging protocols, site qualification, phantom calibration, and centralized quality control to ensure data consistency across global trial sites.
- Advanced imaging software enables image anonymization, secure data transfer, and compliance with regulatory standards such as ICH-GCP and FDA 21 CFR Part 11. Increasingly, AI and machine learning algorithms are embedded to automate quality checks, detect protocol deviations, and extract quantitative imaging biomarkers. Cloud-based architectures support scalable storage, real-time collaboration, and integration with electronic data capture and clinical trial management systems. Together, these technologies enhance data accuracy, reproducibility, and regulatory readiness in modern clinical trials.
|
Clinical Trial Imaging Market |
|||
|
Base Year: |
2024 |
Forecast Period: |
2025-2035 |
|
Historical Data: |
2018 to 2023 |
Market Size in 2024: |
USD 1.20 Bn. |
|
Forecast Period 2025-32 CAGR: |
6.8% |
Market Size in 2035: |
USD 2.47 Bn. |
|
Segments Covered: |
By Product & Service |
|
|
|
By Modality |
|
||
|
By Therapeutic Area |
|
||
|
By Application
|
|
||
|
By End Users |
|
||
|
By Region |
|
||
|
Growth Driver: |
|
||
|
Limiting Factor |
|
||
|
Expansion Opportunity |
|
||
|
Challenge and Risk |
|
||
|
Companies Covered in the Report: |
|
||
Chapter 1: Introduction
1.1 Scope and Coverage
Chapter 2:Executive Summary
Chapter 3: Market Landscape
3.1 Market Dynamics and Opportunity Analysis
3.1.1 Growth Drivers
3.1.2 Limiting Factors
3.1.3 Growth Opportunities
3.1.4 Challenges and Risks
3.2 Market Trend Analysis
3.3 Industry Ecosystem
3.4 Industry Value Chain Mapping
3.5 Strategic PESTLE Overview
3.6 Porter's Five Forces Framework
3.7 Regulatory Framework
3.8 Pricing Trend Analysis
3.9 Intellectual Property Review
3.10 Technology Evolution
3.11 Import-Export Analysis
3.12 Consumer Behavior Analysis
3.13 Investment Pocket Analysis
3.14 Go-To Market Strategy
Chapter 4: Clinical Trial Imaging Market by Product & Service (2018-2035)
4.1 Clinical Trial Imaging Market Snapshot and Growth Engine
4.2 Market Overview
4.3 Trial Design Consulting Services
4.3.1 Introduction and Market Overview
4.3.2 Historic and Forecasted Market Size in Value USD and Volume Units
4.3.3 Key Market Trends, Growth Factors, and Opportunities
4.3.4 Geographic Segmentation Analysis
4.4 Reading & Analytical Services
4.5 System & Technology Support Services
4.6 Project & Data Management
4.7 Operational Imaging Services
4.8 and Others
Chapter 5: Clinical Trial Imaging Market by Modality (2018-2035)
5.1 Clinical Trial Imaging Market Snapshot and Growth Engine
5.2 Market Overview
5.3 X-Ray
5.3.1 Introduction and Market Overview
5.3.2 Historic and Forecasted Market Size in Value USD and Volume Units
5.3.3 Key Market Trends, Growth Factors, and Opportunities
5.3.4 Geographic Segmentation Analysis
5.4 Ultrasound
5.5 CT
5.6 PET
5.7 MRI
5.8 Echocardiography
5.9 Optical Coherence Tomography (OCT)
5.10 and Others
Chapter 6: Clinical Trial Imaging Market by Therapeutic Area (2018-2035)
6.1 Clinical Trial Imaging Market Snapshot and Growth Engine
6.2 Market Overview
6.3 Oncology
6.3.1 Introduction and Market Overview
6.3.2 Historic and Forecasted Market Size in Value USD and Volume Units
6.3.3 Key Market Trends, Growth Factors, and Opportunities
6.3.4 Geographic Segmentation Analysis
6.4 Orthopedics & MSK Disorders
6.5 Ophthalmology
6.6 Neurovascular Diseases
6.7 Nephrology
6.8 Cardiovascular Diseases
6.9 and Others
Chapter 7: Clinical Trial Imaging Market by Application (2018-2035)
7.1 Clinical Trial Imaging Market Snapshot and Growth Engine
7.2 Market Overview
7.3 Services
7.3.1 Introduction and Market Overview
7.3.2 Historic and Forecasted Market Size in Value USD and Volume Units
7.3.3 Key Market Trends, Growth Factors, and Opportunities
7.3.4 Geographic Segmentation Analysis
7.4 Software
7.5 and Others
Chapter 8: Clinical Trial Imaging Market by End Users (2018-2035)
8.1 Clinical Trial Imaging Market Snapshot and Growth Engine
8.2 Market Overview
8.3 Pharmaceutical & Biotechnology Companies
8.3.1 Introduction and Market Overview
8.3.2 Historic and Forecasted Market Size in Value USD and Volume Units
8.3.3 Key Market Trends, Growth Factors, and Opportunities
8.3.4 Geographic Segmentation Analysis
8.4 Medical Device Manufacturers
8.5 Contract Research Organizations (CROs)
8.6 Academic & Government Research Institutes
8.7 Hospitals
8.8 and Others
Chapter 9: Company Profiles and Competitive Analysis
9.1 Competitive Landscape
9.1.1 Competitive Benchmarking
9.1.2 Clinical Trial Imaging Market Share by Manufacturer/Service Provider(2024)
9.1.3 Industry BCG Matrix
9.1.4 PArtnerships, Mergers & Acquisitions
9.2 CALYX (FORMERLY PERCEPTIVE INFORMATICS) (UK/USA)
9.2.1 Company Overview
9.2.2 Key Executives
9.2.3 Company Snapshot
9.2.4 Role of the Company in the Market
9.2.5 Sustainability and Social Responsibility
9.2.6 Operating Business Segments
9.2.7 Product Portfolio
9.2.8 Business Performance
9.2.9 Recent News & Developments
9.2.10 SWOT Analysis
9.3 CARDIOVASCULAR IMAGING TECHNOLOGIES (USA)
9.4 CLARIO (IRELAND)
9.5 ICON PLC (IRELAND)
9.6 INTRINSIC IMAGING LLC (USA)
9.7 IXICO PLC (UK)
9.8 IMAGING ENDPOINTS (USA)
9.9 MEDPACE (USA)
9.10 MEDIAN TECHNOLOGIES (FRANCE)
9.11 NAVITAS LIFE SCIENCES (USA)
9.12 PAREXEL INTERNATIONAL (USA)
9.13 PRISM CLINICAL IMAGING (USA)
9.14 RADIANT SAGE LLC (USA)
9.15 RESONANCE HEALTH LTD. (AUSTRALIA)
9.16 VIRTUALSCOPICS INC. (USA)
9.17 AND OTHER ACTIVE PLAYERS.
Chapter 10: Global Clinical Trial Imaging Market By Region
10.1 Overview
10.2. North America Clinical Trial Imaging Market
10.2.1 Key Market Trends, Growth Factors and Opportunities
10.2.2 Top Key Companies
10.2.3 Historic and Forecasted Market Size by Segments
10.2.4 Historic and Forecast Market Size by Country
10.2.4.1 US
10.2.4.2 Canada
10.2.4.3 Mexico
10.3. Eastern Europe Clinical Trial Imaging Market
10.3.1 Key Market Trends, Growth Factors and Opportunities
10.3.2 Top Key Companies
10.3.3 Historic and Forecasted Market Size by Segments
10.3.4 Historic and Forecast Market Size by Country
10.3.4.1 Russia
10.3.4.2 Bulgaria
10.3.4.3 The Czech Republic
10.3.4.4 Hungary
10.3.4.5 Poland
10.3.4.6 Romania
10.3.4.7 Rest of Eastern Europe
10.4. Western Europe Clinical Trial Imaging Market
10.4.1 Key Market Trends, Growth Factors and Opportunities
10.4.2 Top Key Companies
10.4.3 Historic and Forecasted Market Size by Segments
10.4.4 Historic and Forecast Market Size by Country
10.4.4.1 Germany
10.4.4.2 UK
10.4.4.3 France
10.4.4.4 The Netherlands
10.4.4.5 Italy
10.4.4.6 Spain
10.4.4.7 Rest of Western Europe
10.5. Asia Pacific Clinical Trial Imaging Market
10.5.1 Key Market Trends, Growth Factors and Opportunities
10.5.2 Top Key Companies
10.5.3 Historic and Forecasted Market Size by Segments
10.5.4 Historic and Forecast Market Size by Country
10.5.4.1 China
10.5.4.2 India
10.5.4.3 Japan
10.5.4.4 South Korea
10.5.4.5 Malaysia
10.5.4.6 Thailand
10.5.4.7 Vietnam
10.5.4.8 The Philippines
10.5.4.9 Australia
10.5.4.10 New Zealand
10.5.4.11 Rest of APAC
10.6. Middle East & Africa Clinical Trial Imaging Market
10.6.1 Key Market Trends, Growth Factors and Opportunities
10.6.2 Top Key Companies
10.6.3 Historic and Forecasted Market Size by Segments
10.6.4 Historic and Forecast Market Size by Country
10.6.4.1 Turkiye
10.6.4.2 Bahrain
10.6.4.3 Kuwait
10.6.4.4 Saudi Arabia
10.6.4.5 Qatar
10.6.4.6 UAE
10.6.4.7 Israel
10.6.4.8 South Africa
10.7. South America Clinical Trial Imaging Market
10.7.1 Key Market Trends, Growth Factors and Opportunities
10.7.2 Top Key Companies
10.7.3 Historic and Forecasted Market Size by Segments
10.7.4 Historic and Forecast Market Size by Country
10.7.4.1 Brazil
10.7.4.2 Argentina
10.7.4.3 Rest of SA
Chapter 11 Analyst Viewpoint and Conclusion
Chapter 12 Our Thematic Research Methodology
12.1 Research Process
12.2 Primary Research
12.3 Secondary Research
Chapter 13 Case Study
Chapter 14 Appendix
14.1 Sources
14.2 List of Tables and figures
14.3 Short Forms and Citations
14.4 Assumption and Conversion
14.5 Disclaimer
|
Clinical Trial Imaging Market |
|||
|
Base Year: |
2024 |
Forecast Period: |
2025-2035 |
|
Historical Data: |
2018 to 2023 |
Market Size in 2024: |
USD 1.20 Bn. |
|
Forecast Period 2025-32 CAGR: |
6.8% |
Market Size in 2035: |
USD 2.47 Bn. |
|
Segments Covered: |
By Product & Service |
|
|
|
By Modality |
|
||
|
By Therapeutic Area |
|
||
|
By Application
|
|
||
|
By End Users |
|
||
|
By Region |
|
||
|
Growth Driver: |
|
||
|
Limiting Factor |
|
||
|
Expansion Opportunity |
|
||
|
Challenge and Risk |
|
||
|
Companies Covered in the Report: |
|
||


