


Agritourism Market Synopsis:
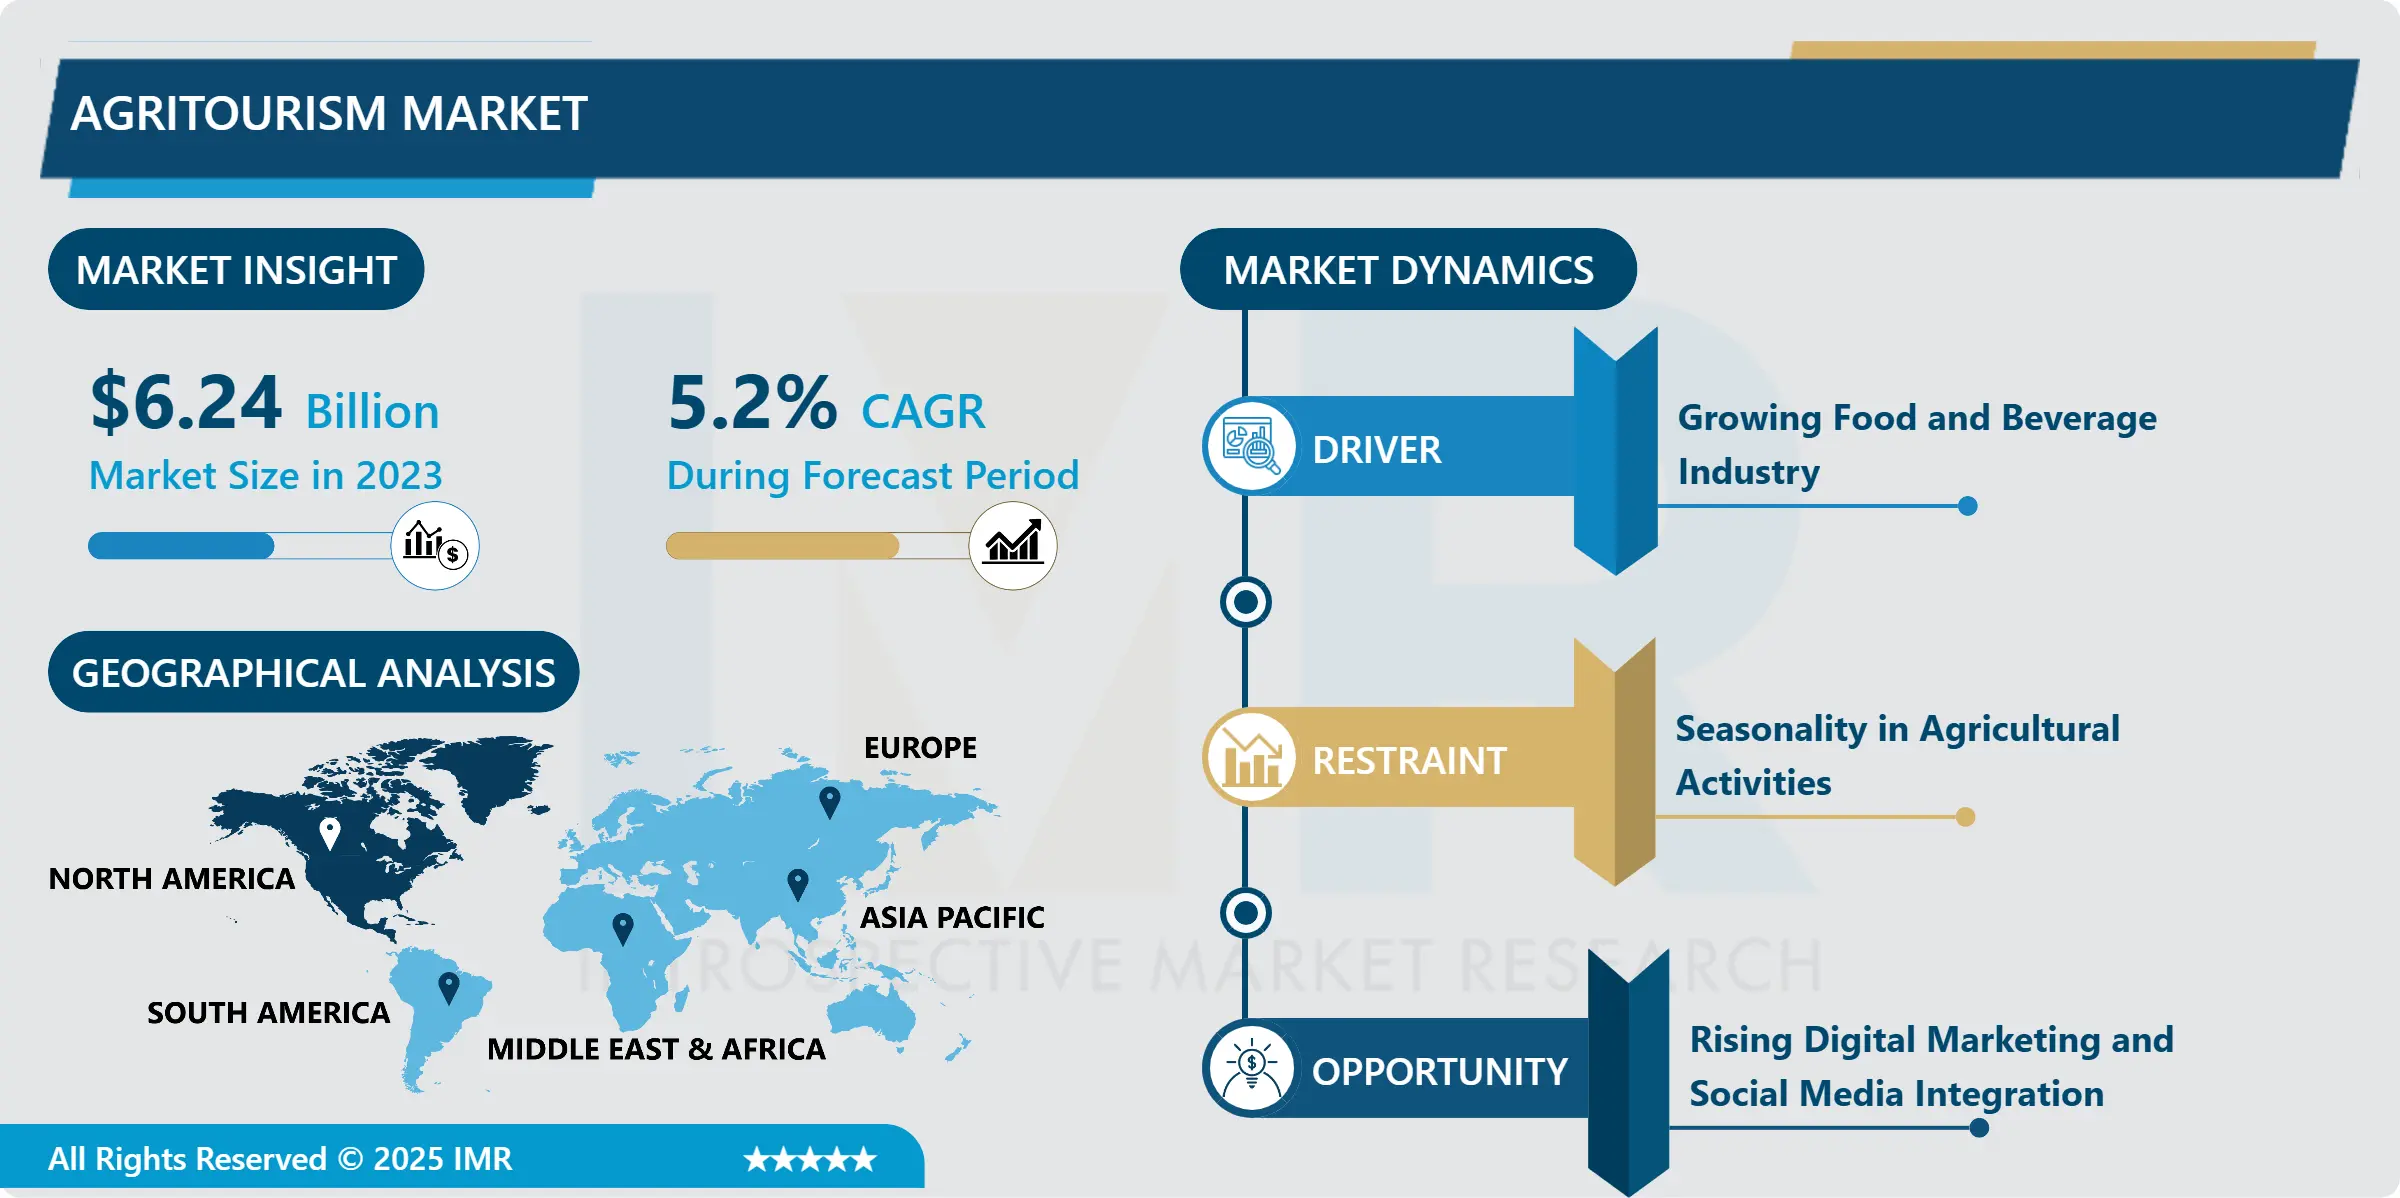
Agritourism Market Size Was Valued at USD 6.24 Billion in 2023, and is Projected to Reach USD 9.85 Billion by 2032, Growing at a CAGR of 5.20% From 2024-2032.
Agritourism concern the traveling to, and staying in, rural areas with the intention of participating in farming and related activities. This can comprise agricultural tourism activities such as; farm visits, fruit or vegetable harvesting, wine tasting services, learning activities, and events organized at the farm. Agritourism was developed to educate tourists about farming processes, familiarize them with the types of(products) being sold, and ensure that they understand the importance of being linked to producers. It provides tourists with something out of the ordinary and assists local industries and promotes environmentally friendly, agricultural practices.
The market of agritourism has been on the rise in recent years due to the rising interest in genuine, more natural tourism experiences. Farming tourism refers to the farming practices that interact with tourism since it affords tourists a chance to be acquainted with farming communities, food production, and rural life styles. This is because customers are interested in sustainable travel, eating local crops, and guest-staying nowadays than before. Agritourism makes it possible for the rural sectors to diversify on their income generating activities since it incorporates visitors who incidentally participate in farming activities like picking crops, going for wine-production viewing, or going for farming experiences that will enclose taking meals of food that have been grown in the region. Also, increased popularity of the wellness tourism has pushed interest in the aspect of agritourism as many tourists opt for farm-based tourism with activities such as yoga, cooking and even organic farming.
International, Europe and North America remain as important areas for agritourism, though some of the popular countries include Italy, France, United States, and Canada. Hence in these regions agritourism as grown to become a lucrative segment that goes hand in hand with the marketing of agriculture, sustainable development and rural regeneration. Although, current market in Asia-Pacific seems very lucrative as the tourists are now looking for rural tourism options in countries such as Japan, South Korea and China. Potential facilitators As digital media, booking platforms and social networks have made the access to agritourism offerings easier due to increased digitalization, the market is likely to grow further. In general, market globalization, and in particular several factors such as organic farming, local purchases, and experience-seeking tourists will define the future tendencies of the agritourism activity, whereas seasonality and a constant variation of demand and supply will be the main factors that agritourism-associated companies have to consider in the future.
Agritourism Market Trend Analysis:
Sustainable Travel, Wellness, and Authentic Experiences
-
Consumer preferences for travelling ecologically, practicing wellness and coming back to nature have expanded agritourism market. Today, there is a trend of tourists who want unique products with a focus on nature and people. Rather than being just a place to visit or purchase products, agritourism offers guests a cultural experience in agricultural ways of living by offering them a chance to engage in coming in to pick fruits, spending a few days on a farm, or learning the basics of using organic farming methods. It is just as fulfilling to enjoy nature and be benefited physically, as it is to learn about sustainable farming and thus where food is coming from.
- Among millennials and other young travelers, there is a considerable passion for environment-friendly and countryside travel, creating the basis for the growth of agritourism. Such travelers are usually more aware of the impact they make to the Environment and would wish to have their holidays in an environment-friendly manner. Therefore, farms with agritourism attractions have emerged to provide attractive comparable options to conventional tourists’ destinations. Considering culture, local people and their ways of living, as well as eco-tourism, agrotourism is gradually gaining popularity as a means of restoring harmony with the nature after time spent in cities.
Authentic Experiences and Wellness Escapes
-
Agritourism a type of traveling in which consumers visit agricultural areas, participate in farming operations and consume foods produced locally has gained currency due to the rising trend of experiential consumption. There is a clearly defined trend towards organic food and beverages and purchasing from locally based farmers for restaurant suppliers that perpetuates the notion of locally grown, fresh food products. With more than just an activity of enjoying views and engaging in the agricultural experiences, agritourism also presents an avenue of interfacing with nature conservation and rewarding small-scale farmer producers. Increasing concern for the environment and the demand for healthy and organic products make the concept of agritourism interesting for those who want to get closer and spend their leisure enjoying countryside activities and food and beverages coming directly from farms.
- Also, growth of a new concept like ‘wellness tourism’ opens new opportunities for ‘agritourism’. Today they are seeking leisure tourism which incorporate Health and Nature like farm to table yoga, wellness and organic food tourism. Both these farm based well-being centers are designed to appeal to the people who are conscious about their health and are willing to get away from the rat race of the city life as well as traditional system of treating ailments. As such, agritourism locations relevant to these experiences of farming and healthy lifestyles are likely to provide products that are answering the call for the increasing niche for travel and tourism experiences that are health-focused and sustainable, integrating the natural environment.
Agritourism Market Segment Analysis:
Agritourism Market is Segmented on the basis of By Tourist Type, Activity, Booking Mode, and Region.
By Tourist Type, Domestic segment is expected to dominate the market during the forecast period
-
Another important segment of agritourism consumer market is domestic tourists, who are likely to travel willing to discover their own domestic agricultural regions and traditions. This segment is a necessity for agritourism providers since these persons are an assured constant stream of traffic to their business looking for genuine localized experiences. With domestic tourists, it is short affordable breaks to rural destinations often with complementary attractions including farms, markets and seasonal events close by. Since most agritourists travel within their country of residence, it can be easy for consumers looking for a working vacation, which entails farm tours, fresh produce picking, or watching wildlife, to indulge in agritourism.
- Also, due to the growing interest of domestic tourists regarding sustainable tourism experiences in agriculture, organic farming, and communitive tourism, there is a rising trend in such tourism experiences. They suggest that many internal tourists are now environmentally sensitive and would like to spend their holidays patronizing agriculture areas. They also get a chance to embrace the opinions of the farmers and get to know how our foods reach the table through agritourism. These are in harmony with sustainability and environmental stewardship that increases demand for domestic agritourism, making the sector to grow continuously in the tourism market.
By Booking Mode, Online Travel Agents segment expected to held the largest share
-
This paper highlights how OTAs are significant in determining the agritourism market by providing a one-stop-shop platform for tourists to book accommodation and other related services including farm visits and other related activities. Travel agents such as Expedia, Airbnb.com, and Booking.com all allow customers to not only compare prices but also read customer reviews and book their entire agritourism vacation in one sitting. This ease of use attracts the international tourists or those who are unfamiliar with the particular places as the OTAs have a descriptive write up, pictures and other travellers’ feedbacks that assist in decision making. Wanting and using these platforms to book diverse agritourism activities including farm stays, workshops on cooking or other farm produce, and other outdoor activities makes it more valuable and adds to the general travelling experience.
- To agritourism providers, working with OTAs has the potential of expanding customer awareness and access to potential customers. Since OTA channels the information to a wide market, small or local farms benefit from the exposure of the worldwide clients they may rarely reach via direct bookings. These platforms also help customers easily get packaged products in terms of transport, accommodation and activities which are bundled together. Getting into OTAs means that operators in the agritourism industry are able to extend their market coverage, have better control of bookings and potentially garner more revenue. A broader audience for its partners but, the costs need to be controlled, and the offerings have to strategic to cover the losses while keeping the benefits of the wider customer range.
Agritourism Market Regional Insights:
North America is Expected to Dominate the Market Over the Forecast period
-
North America remains relatively unexplored, but especially in the United States and Canada, travelers are eager for agritourism experiences. Its occurrence can be attributed to a growing concern for green tourism and people’s need to spend time in nature. Folk are attracted to farm & country lodging, winery & vineyard tours, and such related activities that expose them to the reality of agricultural operations. The growing interest in the application of organic farming and the décision to focus on farm-to-table diets strengthened that need because more and more people are interested in learning about the approach to agriculture and are willing to support local producers. One of the primary developments that agricultural tourism brings is that it lets the guests get up close with nature where they can participate in the picking of fruits and other crops, visit wineyards or enjoy meals which originate from the farm.
- Throughout the United States, this concept has been adopted by many states, and agricultural trails and agritourism networks are designed with the involvement of both small-scale family farmers and large-scale agricultural farming. These networks help tourists to discover the countryside, and, thus, contribute to the sustainable local development and the preservation of agriculture. In like manner, the Canadian market for agritourism is just as interesting, as more regions from British Columbia to Ontario serve wine tours, accommodations in farms and offering learning sessions that showcase the fertility of agriculture in Canada. With such demand for green and learning tourism, agritourism in North America remains vibrant as tourists engage with the land mostly through the agricultural produce.
Active Key Players in the Agritourism Market
- Blackberry Farm LLC (U.S.)
- Butterfield and Robinson (Canada)
- China Travel (China)
- Expedia, Inc. (U.S.)
- Harvest Fresh Farms (U.S.)
- Liberty Hill Farm (U.S.)
- Monteillet Fromagerie (U.S.)
- Orange Grove by Totalstay (South Africa)
- Quadrant Australia (Australia)
- Select Holidays (Canada)
- The Inn at Valley Farms (U.S.)
- Travel Leaders Group (U.S.)
- Wheatacre Hall Barns (U.K.)
- Willow-Witt Ranch (U.S.)
- Other Active Players.
Key Industry Developments in the Agritourism Market:
- In August 2023, The Pacific Agritourism Conference, organized by the Global Agritourism Network Pacific Committee and the Global Sustainable Tourism Council, aimed to enhance agritourism in the Pacific region by incorporating indigenous perspectives
- In April 2023, Assisi Aid Projects Australia announced the launch of a new short-term initiative called Jajal Wae Sustainable Agri-Tourism, in collaboration with Dreamdelion Indonesia. This project is designed to empower women in rural Indonesia to achieve economic stability and growth through agritourism
- In April 2023, A group of leading practitioners, experts, and scholars in agritourism came together to establish the Global Agritourism Network (GAN). This network aims to support and promote market growth by bringing together researchers, farmers, agricultural producers, educators, government entities, and other stakeholders to foster industry development
|
Global Agritourism Market |
|||
|
Base Year: |
2023 |
Forecast Period: |
2024-2032 |
|
Historical Data: |
2017 to 2023 |
Market Size in 2023: |
USD 6.24 Billion |
|
Forecast Period 2024-32 CAGR: |
5.20% |
Market Size in 2032: |
USD 9.85 Billion |
|
Segments Covered: |
By Tourist Type |
|
|
|
By Activity |
|
||
|
By Booking Mode |
|
||
|
By Region |
|
||
|
Key Market Drivers: |
|
||
|
Key Market Restraints: |
|
||
|
Key Opportunities: |
|
||
|
Companies Covered in the report: |
|
||
Chapter 1: Introduction
1.1 Scope and Coverage
Chapter 2:Executive Summary
Chapter 3: Market Landscape
3.1 Market Dynamics
3.1.1 Drivers
3.1.2 Restraints
3.1.3 Opportunities
3.1.4 Challenges
3.2 Market Trend Analysis
3.3 PESTLE Analysis
3.4 Porter's Five Forces Analysis
3.5 Industry Value Chain Analysis
3.6 Ecosystem
3.7 Regulatory Landscape
3.8 Price Trend Analysis
3.9 Patent Analysis
3.10 Technology Evolution
3.11 Investment Pockets
3.12 Import-Export Analysis
Chapter 4: Agritourism Market by Tourist Type
4.1 Agritourism Market Snapshot and Growth Engine
4.2 Agritourism Market Overview
4.3 Domestic and International
4.3.1 Introduction and Market Overview
4.3.2 Historic and Forecasted Market Size in Value USD and Volume Units (2017-2032F)
4.3.3 Key Market Trends, Growth Factors and Opportunities
4.3.4 Domestic and International: Geographic Segmentation Analysis
Chapter 5: Agritourism Market by Activity
5.1 Agritourism Market Snapshot and Growth Engine
5.2 Agritourism Market Overview
5.3 On-Farm Sales
5.3.1 Introduction and Market Overview
5.3.2 Historic and Forecasted Market Size in Value USD and Volume Units (2017-2032F)
5.3.3 Key Market Trends, Growth Factors and Opportunities
5.3.4 On-Farm Sales: Geographic Segmentation Analysis
5.4 Outdoor Recreation
5.4.1 Introduction and Market Overview
5.4.2 Historic and Forecasted Market Size in Value USD and Volume Units (2017-2032F)
5.4.3 Key Market Trends, Growth Factors and Opportunities
5.4.4 Outdoor Recreation: Geographic Segmentation Analysis
5.5 Agritainment
5.5.1 Introduction and Market Overview
5.5.2 Historic and Forecasted Market Size in Value USD and Volume Units (2017-2032F)
5.5.3 Key Market Trends, Growth Factors and Opportunities
5.5.4 Agritainment: Geographic Segmentation Analysis
5.6 Educational Tourism
5.6.1 Introduction and Market Overview
5.6.2 Historic and Forecasted Market Size in Value USD and Volume Units (2017-2032F)
5.6.3 Key Market Trends, Growth Factors and Opportunities
5.6.4 Educational Tourism: Geographic Segmentation Analysis
5.7 Accommodation
5.7.1 Introduction and Market Overview
5.7.2 Historic and Forecasted Market Size in Value USD and Volume Units (2017-2032F)
5.7.3 Key Market Trends, Growth Factors and Opportunities
5.7.4 Accommodation: Geographic Segmentation Analysis
5.8 Others
5.8.1 Introduction and Market Overview
5.8.2 Historic and Forecasted Market Size in Value USD and Volume Units (2017-2032F)
5.8.3 Key Market Trends, Growth Factors and Opportunities
5.8.4 Others: Geographic Segmentation Analysis
Chapter 6: Agritourism Market by Booking Mode
6.1 Agritourism Market Snapshot and Growth Engine
6.2 Agritourism Market Overview
6.3 Direct Booking
6.3.1 Introduction and Market Overview
6.3.2 Historic and Forecasted Market Size in Value USD and Volume Units (2017-2032F)
6.3.3 Key Market Trends, Growth Factors and Opportunities
6.3.4 Direct Booking : Geographic Segmentation Analysis
6.4 Online Travel Agents and Travel Agencies (OTAs)
6.4.1 Introduction and Market Overview
6.4.2 Historic and Forecasted Market Size in Value USD and Volume Units (2017-2032F)
6.4.3 Key Market Trends, Growth Factors and Opportunities
6.4.4 Online Travel Agents and Travel Agencies (OTAs): Geographic Segmentation Analysis
Chapter 7: Company Profiles and Competitive Analysis
7.1 Competitive Landscape
7.1.1 Competitive Benchmarking
7.1.2 Agritourism Market Share by Manufacturer (2023)
7.1.3 Industry BCG Matrix
7.1.4 Heat Map Analysis
7.1.5 Mergers and Acquisitions
7.2 LIBERTY HILL FARM (U.S)
7.2.1 Company Overview
7.2.2 Key Executives
7.2.3 Company Snapshot
7.2.4 Role of the Company in the Market
7.2.5 Sustainability and Social Responsibility
7.2.6 Operating Business Segments
7.2.7 Product Portfolio
7.2.8 Business Performance
7.2.9 Key Strategic Moves and Recent Developments
7.2.10 SWOT Analysis
7.3 BLACKBERRY FARM LLC. (U.S)
7.4 WILLOW-WITT RANCH (U.S)
7.5 MONTEILLET FROMAGERIE (U.S)
7.6 THE INN AT VALLEY FARMS (U.S)
7.7 HARVEST FRESH FARMS (U.S)
7.8 WHEATACRE HALL BARNS (U.K)
7.9 ORANGE GROVE BY TOTALSTAY (SOUTH AFRICA)
7.10 QUADRANT AUSTRALIA (AUSTRALIA)
7.11 SELECT HOLIDAYS (CANADA)
7.12 EXPEDIA INC. (U.S)
7.13 CHINA TRAVEL (CHINA)
7.14 TRAVEL LEADERS GROUP (U.S)
7.15 BUTTERFIELD AND ROBINSON (CANADA)
7.16 OTHER ACTIVE PLAYERS
Chapter 8: Global Agritourism Market By Region
8.1 Overview
8.2. North America Agritourism Market
8.2.1 Key Market Trends, Growth Factors and Opportunities
8.2.2 Top Key Companies
8.2.3 Historic and Forecasted Market Size by Segments
8.2.4 Historic and Forecasted Market Size By Tourist Type
8.2.4.1 Domestic and International
8.2.5 Historic and Forecasted Market Size By Activity
8.2.5.1 On-Farm Sales
8.2.5.2 Outdoor Recreation
8.2.5.3 Agritainment
8.2.5.4 Educational Tourism
8.2.5.5 Accommodation
8.2.5.6 Others
8.2.6 Historic and Forecasted Market Size By Booking Mode
8.2.6.1 Direct Booking
8.2.6.2 Online Travel Agents and Travel Agencies (OTAs)
8.2.7 Historic and Forecast Market Size by Country
8.2.7.1 US
8.2.7.2 Canada
8.2.7.3 Mexico
8.3. Eastern Europe Agritourism Market
8.3.1 Key Market Trends, Growth Factors and Opportunities
8.3.2 Top Key Companies
8.3.3 Historic and Forecasted Market Size by Segments
8.3.4 Historic and Forecasted Market Size By Tourist Type
8.3.4.1 Domestic and International
8.3.5 Historic and Forecasted Market Size By Activity
8.3.5.1 On-Farm Sales
8.3.5.2 Outdoor Recreation
8.3.5.3 Agritainment
8.3.5.4 Educational Tourism
8.3.5.5 Accommodation
8.3.5.6 Others
8.3.6 Historic and Forecasted Market Size By Booking Mode
8.3.6.1 Direct Booking
8.3.6.2 Online Travel Agents and Travel Agencies (OTAs)
8.3.7 Historic and Forecast Market Size by Country
8.3.7.1 Russia
8.3.7.2 Bulgaria
8.3.7.3 The Czech Republic
8.3.7.4 Hungary
8.3.7.5 Poland
8.3.7.6 Romania
8.3.7.7 Rest of Eastern Europe
8.4. Western Europe Agritourism Market
8.4.1 Key Market Trends, Growth Factors and Opportunities
8.4.2 Top Key Companies
8.4.3 Historic and Forecasted Market Size by Segments
8.4.4 Historic and Forecasted Market Size By Tourist Type
8.4.4.1 Domestic and International
8.4.5 Historic and Forecasted Market Size By Activity
8.4.5.1 On-Farm Sales
8.4.5.2 Outdoor Recreation
8.4.5.3 Agritainment
8.4.5.4 Educational Tourism
8.4.5.5 Accommodation
8.4.5.6 Others
8.4.6 Historic and Forecasted Market Size By Booking Mode
8.4.6.1 Direct Booking
8.4.6.2 Online Travel Agents and Travel Agencies (OTAs)
8.4.7 Historic and Forecast Market Size by Country
8.4.7.1 Germany
8.4.7.2 UK
8.4.7.3 France
8.4.7.4 The Netherlands
8.4.7.5 Italy
8.4.7.6 Spain
8.4.7.7 Rest of Western Europe
8.5. Asia Pacific Agritourism Market
8.5.1 Key Market Trends, Growth Factors and Opportunities
8.5.2 Top Key Companies
8.5.3 Historic and Forecasted Market Size by Segments
8.5.4 Historic and Forecasted Market Size By Tourist Type
8.5.4.1 Domestic and International
8.5.5 Historic and Forecasted Market Size By Activity
8.5.5.1 On-Farm Sales
8.5.5.2 Outdoor Recreation
8.5.5.3 Agritainment
8.5.5.4 Educational Tourism
8.5.5.5 Accommodation
8.5.5.6 Others
8.5.6 Historic and Forecasted Market Size By Booking Mode
8.5.6.1 Direct Booking
8.5.6.2 Online Travel Agents and Travel Agencies (OTAs)
8.5.7 Historic and Forecast Market Size by Country
8.5.7.1 China
8.5.7.2 India
8.5.7.3 Japan
8.5.7.4 South Korea
8.5.7.5 Malaysia
8.5.7.6 Thailand
8.5.7.7 Vietnam
8.5.7.8 The Philippines
8.5.7.9 Australia
8.5.7.10 New Zealand
8.5.7.11 Rest of APAC
8.6. Middle East & Africa Agritourism Market
8.6.1 Key Market Trends, Growth Factors and Opportunities
8.6.2 Top Key Companies
8.6.3 Historic and Forecasted Market Size by Segments
8.6.4 Historic and Forecasted Market Size By Tourist Type
8.6.4.1 Domestic and International
8.6.5 Historic and Forecasted Market Size By Activity
8.6.5.1 On-Farm Sales
8.6.5.2 Outdoor Recreation
8.6.5.3 Agritainment
8.6.5.4 Educational Tourism
8.6.5.5 Accommodation
8.6.5.6 Others
8.6.6 Historic and Forecasted Market Size By Booking Mode
8.6.6.1 Direct Booking
8.6.6.2 Online Travel Agents and Travel Agencies (OTAs)
8.6.7 Historic and Forecast Market Size by Country
8.6.7.1 Turkiye
8.6.7.2 Bahrain
8.6.7.3 Kuwait
8.6.7.4 Saudi Arabia
8.6.7.5 Qatar
8.6.7.6 UAE
8.6.7.7 Israel
8.6.7.8 South Africa
8.7. South America Agritourism Market
8.7.1 Key Market Trends, Growth Factors and Opportunities
8.7.2 Top Key Companies
8.7.3 Historic and Forecasted Market Size by Segments
8.7.4 Historic and Forecasted Market Size By Tourist Type
8.7.4.1 Domestic and International
8.7.5 Historic and Forecasted Market Size By Activity
8.7.5.1 On-Farm Sales
8.7.5.2 Outdoor Recreation
8.7.5.3 Agritainment
8.7.5.4 Educational Tourism
8.7.5.5 Accommodation
8.7.5.6 Others
8.7.6 Historic and Forecasted Market Size By Booking Mode
8.7.6.1 Direct Booking
8.7.6.2 Online Travel Agents and Travel Agencies (OTAs)
8.7.7 Historic and Forecast Market Size by Country
8.7.7.1 Brazil
8.7.7.2 Argentina
8.7.7.3 Rest of SA
Chapter 9 Analyst Viewpoint and Conclusion
9.1 Recommendations and Concluding Analysis
9.2 Potential Market Strategies
Chapter 10 Research Methodology
10.1 Research Process
10.2 Primary Research
10.3 Secondary Research
|
Global Agritourism Market |
|||
|
Base Year: |
2023 |
Forecast Period: |
2024-2032 |
|
Historical Data: |
2017 to 2023 |
Market Size in 2023: |
USD 6.24 Billion |
|
Forecast Period 2024-32 CAGR: |
5.20% |
Market Size in 2032: |
USD 9.85 Billion |
|
Segments Covered: |
By Tourist Type |
|
|
|
By Activity |
|
||
|
By Booking Mode |
|
||
|
By Region |
|
||
|
Key Market Drivers: |
|
||
|
Key Market Restraints: |
|
||
|
Key Opportunities: |
|
||
|
Companies Covered in the report: |
|
||


