


Virtual Production Market Synopsis:
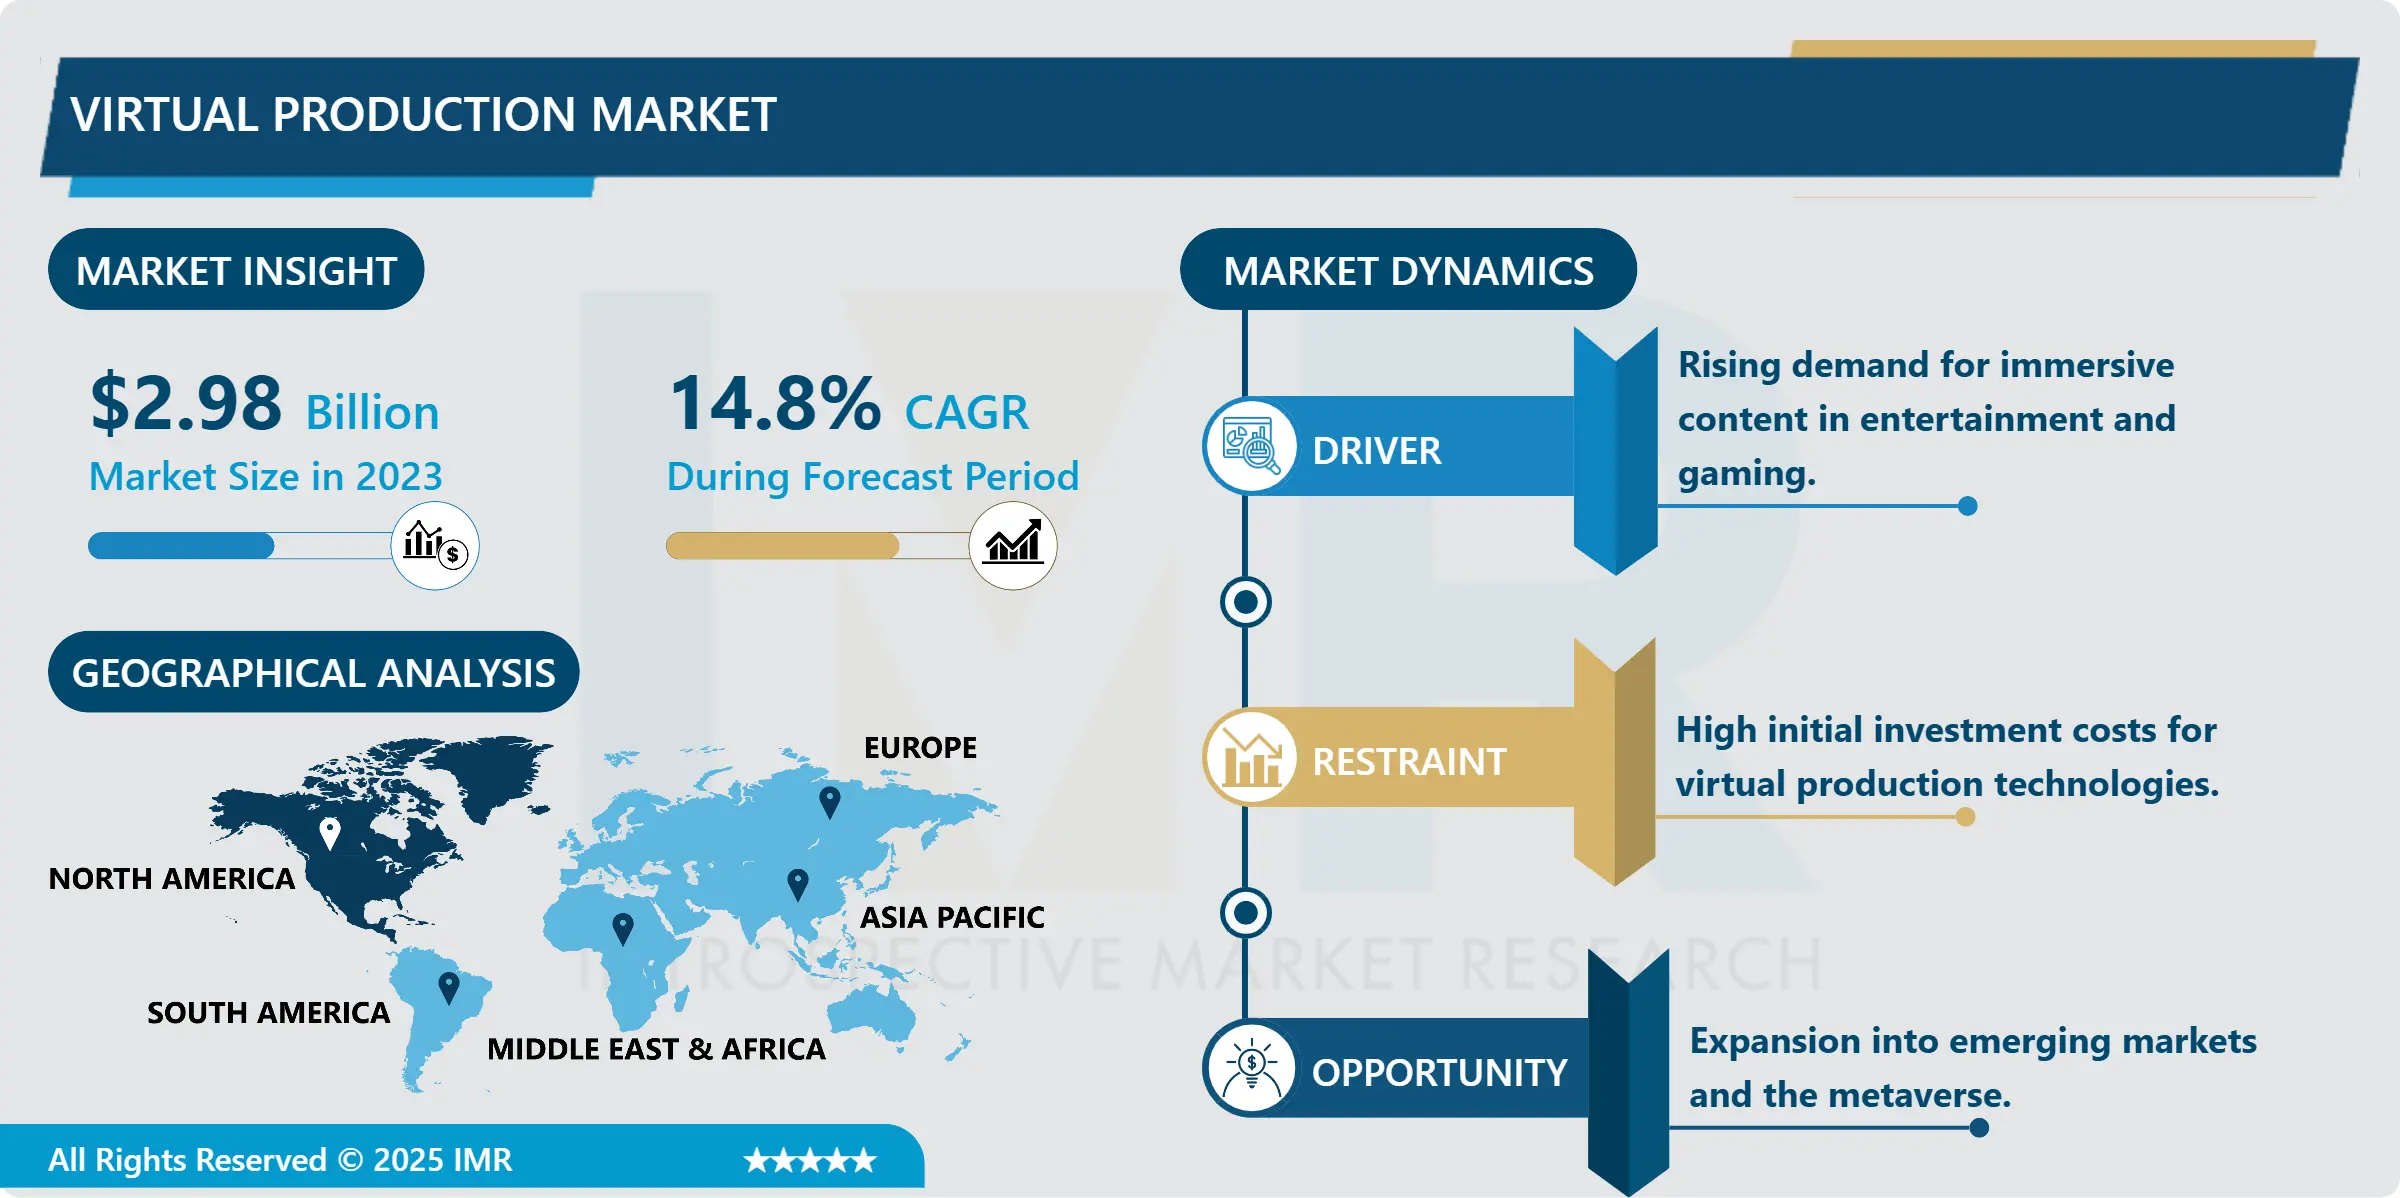
Virtual Production Market Size Was Valued at USD 2.98 Billion in 2023, and is Projected to Reach USD 10.32 Billion by 2032, Growing at a CAGR of 14.8% From 2024-2032.
Virtual Production Market is defined here as the combination of real-time technologies with CGI and the best hardware technologies equipment’s used in the films, games, advertisements and live events. As such, it allows creators to simulate, choreograph and rehearse scenes interactively while being less time-consuming, innovative and cost-effective.
The Virtual Production Market is still in its vigorous stage of growth because of the ever-rising needs for high end graphics resolution in the digital media. In entertainment in particular and in the production of entertainment goods specifically, that is, films and games, virtual production has been embraced as an innovative approach to enhance creativity while at the same time reducing costs which would otherwise be incurred by the traditional models. Latest real-time rendering tools like Unreal Engine and Unity complemented by new technologies such as LED volumes and motion capture systems have moved virtual production tools to the next level. Most of these solutions are useful not only to fine-tune the supply chain but also enable creators to meet the customers’ requirement for high quality visual images at a faster rate.
The other crucial point that will enhance the market is the non-stop emergence of digital streaming sites and people’s desire for active content. It is not just entertainment that is confined to the uses of the virtual production technologies; advertising, education and live events are now using the technologies in making fallowing adverts and PPTs. However, virtual production has been applied in the relatively new practices in the virtual environment such as the metaverse bumping the versatility encouraging innovation. As costs of production continues to reduce and technology becoming cheaper the market for Virtual Production is expected to increase gradually in its manifold uses.
Virtual Production Market Trend Analysis:
Immersive Real-Time Environments Gaining Popularity
- The growing adoption of immersive real-time environments is contributing to the expansion of the virtual production market. This trend is accelerating as studios and content creators seek agile, cost-effective solutions that allow for real-time visualization and seamless blending of physical and digital assets. Real-time engines, such as Unreal Engine, are now central to workflows, enabling faster iteration, creative flexibility, and reduced reliance on post-production. These technologies are reshaping how media, entertainment, and advertising projects are conceptualized and executed.
- Virtual production is being increasingly applied in episodic content, live broadcasts, and feature films, supporting demand for faster turnaround and higher visual fidelity. Production houses are integrating LED walls and motion tracking systems to create dynamic sets that respond to live inputs. This approach helps streamline location shifts and facilitates creative experimentation without leaving the studio. As immersive environments evolve, their alignment with virtual production workflows is reinforcing market scalability and adoption across multiple segments.
Expansion in the Metaverse and Virtual Reality Applications
- The expansion of the metaverse and the rapid integration of virtual reality (VR) technologies are unlocking new commercial opportunities across digital media and entertainment. Enterprises are investing in immersive environments to enhance consumer engagement, training, and remote collaboration. This shift is accelerating the demand for advanced content creation tools, particularly within virtual production. Studios, gaming developers, and advertisers are adopting these methods to produce high-quality visuals in controlled environments while reducing costs and timelines.
- The virtual production market is gaining traction as it aligns with the evolving needs of metaverse platforms. Real-time rendering, motion capture, and LED wall technologies are becoming standard in modern production workflows. As businesses explore deeper audience interaction within virtual spaces, the requirement for agile and photorealistic content continues to grow. Market participants offering integrated solutions across VR, AR, and mixed reality stand to benefit from expanding digital infrastructure and increased content consumption in both enterprise and consumer applications.
Virtual Production Market Segment Analysis:
Virtual Production Market Segmented on the basis of Component, Type, End User, and Region
By Component, Hardware segment is expected to dominate the market during the forecast period
- The hardware segment is poised to lead the virtual production market throughout the forecast period, supported by sustained investment in advanced technologies such as LED video walls, high-performance cameras, and motion capture systems. These components are essential for delivering immersive content creation experiences, especially in film, television, and gaming environments. Companies are aligning their production pipelines with real-time rendering capabilities and integrating high-resolution imaging tools to meet the evolving demands of digital storytelling.
- The growing adoption of virtual production techniques in media and entertainment is reshaping traditional content creation workflows. Production studios are focusing on enhancing visual output while reducing costs and timelines through hardware-based solutions. The transition toward real-time visualization and the blending of physical and digital environments has made hardware a cornerstone in this evolving landscape. As projects continue to scale in complexity and scope, the demand for robust hardware solutions remains a strategic priority for stakeholders across the ecosystem.
By Type, Pre-Production segment expected to hold the largest share
- The pre-production segment is projected to account for the largest share of the virtual production market due to the increasing integration of advanced technologies during the planning and conceptualization stages. Virtual tools are being adopted to streamline tasks such as storyboarding, location scouting, and previsualization. Production studios and content creators are investing in digital assets earlier in the workflow to enhance creative control, reduce on-set revisions, and enable more efficient resource allocation. This early-stage optimization is becoming central to how projects are developed and managed in modern production environments.
- The overall growth of the virtual production market is reshaping content creation across film, television, advertising, and gaming. The adoption of real-time engines, virtual cameras, and LED volume stages is contributing to faster turnaround times and greater creative flexibility. As production teams seek to meet rising content demand with high visual quality, virtual production workflows are becoming more deeply embedded into standard practices, particularly at the pre-production level.
Virtual Production Market Regional Insights:
North America is Expected to Dominate The Market Over The Forecast Period
- The virtual production market in North America is gaining strong momentum due to widespread adoption across film, television, and commercial sectors. Studios are increasing investment in advanced technologies such as real-time rendering, motion capture, and LED wall integration to enhance creative control and reduce post-production cycles. The presence of leading production houses and technology providers supports the expansion of virtual production workflows, with an emphasis on real-time collaboration and visual quality. This shift is shaping new standards in content creation and accelerating deployment across both major studios and independent producers.
- Growth in this space aligns with evolving consumer demand for high-quality visual content and more immersive storytelling formats. The availability of infrastructure and skilled talent in North America contributes to faster implementation of these tools. Adoption is further enabled by evolving studio pipelines that seek to optimize production costs and timelines without compromising creative vision. As production timelines tighten, virtual production is becoming an essential component of modern content creation strategies.
Active Key Players in the Virtual Production Market:
- 4D Views (France)
- Adobe Systems (United States)
- Arashi Vision Inc. (China)
- Autodesk, Inc. (United States)
- Axle Video LLC (United States)
- Avid Technology Inc. (United States)
- Blackmagic Design (Australia)
- Epic Games (United States)
- HTC Corporation (Taiwan)
- Mo-Sys Engineering (United Kingdom)
- NVIDIA Corporation (United States)
- Panasonic Corporation (Japan)
- Sony Corporation (Japan)
- Vicon Motion Systems Ltd. (United Kingdom)
- XR Studios (United States)
- Other Active Players
|
Global Virtual Production Market |
|||
|
Base Year: |
2023 |
Forecast Period: |
2024-2032 |
|
Historical Data: |
2017 to 2023 |
Market Size in 2023: |
USD 2.98 Billion |
|
Forecast Period 2024-32 CAGR: |
14.8% |
Market Size in 2032: |
USD 10.32 Billion |
|
Segments Covered: |
By Component |
|
|
|
By Type |
|
||
|
By End User |
|
||
|
By Region |
|
||
|
Key Market Drivers: |
|
||
|
Key Market Restraints: |
|
||
|
Key Opportunities: |
|
||
|
Companies Covered in the Report: |
|
||
Chapter 1: Introduction
1.1 Scope and Coverage
Chapter 2:Executive Summary
Chapter 3: Market Landscape
3.1 Market Dynamics
3.1.1 Drivers
3.1.2 Restraints
3.1.3 Opportunities
3.1.4 Challenges
3.2 Market Trend Analysis
3.3 PESTLE Analysis
3.4 Porter's Five Forces Analysis
3.5 Industry Value Chain Analysis
3.6 Ecosystem
3.7 Regulatory Landscape
3.8 Price Trend Analysis
3.9 Patent Analysis
3.10 Technology Evolution
3.11 Investment Pockets
3.12 Import-Export Analysis
Chapter 4: Virtual Production Market by Content Type
4.1 Virtual Production Market Snapshot and Growth Engine
4.2 Virtual Production Market Overview
4.3 Videos360-degree Photos Games 360-degree Videos Immersive Videos
4.3.1 Introduction and Market Overview
4.3.2 Historic and Forecasted Market Size in Value USD and Volume Units (2017-2032F)
4.3.3 Key Market Trends, Growth Factors and Opportunities
4.3.4 Videos360-degree Photos Games 360-degree Videos Immersive Videos: Geographic Segmentation Analysis
Chapter 5: Virtual Production Market by Solution Type
5.1 Virtual Production Market Snapshot and Growth Engine
5.2 Virtual Production Market Overview
5.3 Software Services
5.3.1 Introduction and Market Overview
5.3.2 Historic and Forecasted Market Size in Value USD and Volume Units (2017-2032F)
5.3.3 Key Market Trends, Growth Factors and Opportunities
5.3.4 Software Services: Geographic Segmentation Analysis
Chapter 6: Virtual Production Market by End User
6.1 Virtual Production Market Snapshot and Growth Engine
6.2 Virtual Production Market Overview
6.3 Automotive Media & Entertainment Travel & Hospitality Real Estate Retail Gaming Healthcare Others
6.3.1 Introduction and Market Overview
6.3.2 Historic and Forecasted Market Size in Value USD and Volume Units (2017-2032F)
6.3.3 Key Market Trends, Growth Factors and Opportunities
6.3.4 Automotive Media & Entertainment Travel & Hospitality Real Estate Retail Gaming Healthcare Others: Geographic Segmentation Analysis
Chapter 7: Company Profiles and Competitive Analysis
7.1 Competitive Landscape
7.1.1 Competitive Benchmarking
7.1.2 Virtual Production Market Share by Manufacturer (2023)
7.1.3 Industry BCG Matrix
7.1.4 Heat Map Analysis
7.1.5 Mergers and Acquisitions
7.2 4D VIEWS (FRANCE)
7.2.1 Company Overview
7.2.2 Key Executives
7.2.3 Company Snapshot
7.2.4 Role of the Company in the Market
7.2.5 Sustainability and Social Responsibility
7.2.6 Operating Business Segments
7.2.7 Product Portfolio
7.2.8 Business Performance
7.2.9 Key Strategic Moves and Recent Developments
7.2.10 SWOT Analysis
7.3 ADOBE SYSTEMS (UNITED STATES)
7.4 ARASHI VISION INC. (CHINA)
7.5 AUTODESK INC. (UNITED STATES)
7.6 AXLE VIDEO LLC (UNITED STATES)
7.7 AVID TECHNOLOGY INC. (UNITED STATES)
7.8 BLACKMAGIC DESIGN (AUSTRALIA)
7.9 EPIC GAMES (UNITED STATES)
7.10 HTC CORPORATION (TAIWAN)
7.11 MO-SYS ENGINEERING (UNITED KINGDOM)
7.12 NVIDIA CORPORATION (UNITED STATES)
7.13 PANASONIC CORPORATION (JAPAN)
7.14 SONY CORPORATION (JAPAN)
7.15 VICON MOTION SYSTEMS LTD. (UNITED KINGDOM)
7.16 XR STUDIOS (UNITED STATES)
7.17 OTHER ACTIVE PLAYERS
Chapter 8: Global Virtual Production Market By Region
8.1 Overview
8.2. North America Virtual Production Market
8.2.1 Key Market Trends, Growth Factors and Opportunities
8.2.2 Top Key Companies
8.2.3 Historic and Forecasted Market Size by Segments
8.2.4 Historic and Forecasted Market Size By Content Type
8.2.4.1 Videos360-degree Photos Games 360-degree Videos Immersive Videos
8.2.5 Historic and Forecasted Market Size By Solution Type
8.2.5.1 Software Services
8.2.6 Historic and Forecasted Market Size By End User
8.2.6.1 Automotive Media & Entertainment Travel & Hospitality Real Estate Retail Gaming Healthcare Others
8.2.7 Historic and Forecast Market Size by Country
8.2.7.1 US
8.2.7.2 Canada
8.2.7.3 Mexico
8.3. Eastern Europe Virtual Production Market
8.3.1 Key Market Trends, Growth Factors and Opportunities
8.3.2 Top Key Companies
8.3.3 Historic and Forecasted Market Size by Segments
8.3.4 Historic and Forecasted Market Size By Content Type
8.3.4.1 Videos360-degree Photos Games 360-degree Videos Immersive Videos
8.3.5 Historic and Forecasted Market Size By Solution Type
8.3.5.1 Software Services
8.3.6 Historic and Forecasted Market Size By End User
8.3.6.1 Automotive Media & Entertainment Travel & Hospitality Real Estate Retail Gaming Healthcare Others
8.3.7 Historic and Forecast Market Size by Country
8.3.7.1 Russia
8.3.7.2 Bulgaria
8.3.7.3 The Czech Republic
8.3.7.4 Hungary
8.3.7.5 Poland
8.3.7.6 Romania
8.3.7.7 Rest of Eastern Europe
8.4. Western Europe Virtual Production Market
8.4.1 Key Market Trends, Growth Factors and Opportunities
8.4.2 Top Key Companies
8.4.3 Historic and Forecasted Market Size by Segments
8.4.4 Historic and Forecasted Market Size By Content Type
8.4.4.1 Videos360-degree Photos Games 360-degree Videos Immersive Videos
8.4.5 Historic and Forecasted Market Size By Solution Type
8.4.5.1 Software Services
8.4.6 Historic and Forecasted Market Size By End User
8.4.6.1 Automotive Media & Entertainment Travel & Hospitality Real Estate Retail Gaming Healthcare Others
8.4.7 Historic and Forecast Market Size by Country
8.4.7.1 Germany
8.4.7.2 UK
8.4.7.3 France
8.4.7.4 The Netherlands
8.4.7.5 Italy
8.4.7.6 Spain
8.4.7.7 Rest of Western Europe
8.5. Asia Pacific Virtual Production Market
8.5.1 Key Market Trends, Growth Factors and Opportunities
8.5.2 Top Key Companies
8.5.3 Historic and Forecasted Market Size by Segments
8.5.4 Historic and Forecasted Market Size By Content Type
8.5.4.1 Videos360-degree Photos Games 360-degree Videos Immersive Videos
8.5.5 Historic and Forecasted Market Size By Solution Type
8.5.5.1 Software Services
8.5.6 Historic and Forecasted Market Size By End User
8.5.6.1 Automotive Media & Entertainment Travel & Hospitality Real Estate Retail Gaming Healthcare Others
8.5.7 Historic and Forecast Market Size by Country
8.5.7.1 China
8.5.7.2 India
8.5.7.3 Japan
8.5.7.4 South Korea
8.5.7.5 Malaysia
8.5.7.6 Thailand
8.5.7.7 Vietnam
8.5.7.8 The Philippines
8.5.7.9 Australia
8.5.7.10 New Zealand
8.5.7.11 Rest of APAC
8.6. Middle East & Africa Virtual Production Market
8.6.1 Key Market Trends, Growth Factors and Opportunities
8.6.2 Top Key Companies
8.6.3 Historic and Forecasted Market Size by Segments
8.6.4 Historic and Forecasted Market Size By Content Type
8.6.4.1 Videos360-degree Photos Games 360-degree Videos Immersive Videos
8.6.5 Historic and Forecasted Market Size By Solution Type
8.6.5.1 Software Services
8.6.6 Historic and Forecasted Market Size By End User
8.6.6.1 Automotive Media & Entertainment Travel & Hospitality Real Estate Retail Gaming Healthcare Others
8.6.7 Historic and Forecast Market Size by Country
8.6.7.1 Turkiye
8.6.7.2 Bahrain
8.6.7.3 Kuwait
8.6.7.4 Saudi Arabia
8.6.7.5 Qatar
8.6.7.6 UAE
8.6.7.7 Israel
8.6.7.8 South Africa
8.7. South America Virtual Production Market
8.7.1 Key Market Trends, Growth Factors and Opportunities
8.7.2 Top Key Companies
8.7.3 Historic and Forecasted Market Size by Segments
8.7.4 Historic and Forecasted Market Size By Content Type
8.7.4.1 Videos360-degree Photos Games 360-degree Videos Immersive Videos
8.7.5 Historic and Forecasted Market Size By Solution Type
8.7.5.1 Software Services
8.7.6 Historic and Forecasted Market Size By End User
8.7.6.1 Automotive Media & Entertainment Travel & Hospitality Real Estate Retail Gaming Healthcare Others
8.7.7 Historic and Forecast Market Size by Country
8.7.7.1 Brazil
8.7.7.2 Argentina
8.7.7.3 Rest of SA
Chapter 9 Analyst Viewpoint and Conclusion
9.1 Recommendations and Concluding Analysis
9.2 Potential Market Strategies
Chapter 10 Research Methodology
10.1 Research Process
10.2 Primary Research
10.3 Secondary Research
|
Global Virtual Production Market |
|||
|
Base Year: |
2023 |
Forecast Period: |
2024-2032 |
|
Historical Data: |
2017 to 2023 |
Market Size in 2023: |
USD 2.98 Billion |
|
Forecast Period 2024-32 CAGR: |
14.8% |
Market Size in 2032: |
USD 10.32 Billion |
|
Segments Covered: |
By Component |
|
|
|
By Type |
|
||
|
By End User |
|
||
|
By Region |
|
||
|
Key Market Drivers: |
|
||
|
Key Market Restraints: |
|
||
|
Key Opportunities: |
|
||
|
Companies Covered in the Report: |
|
||


