


Telecom Billing Software Market Synopsis
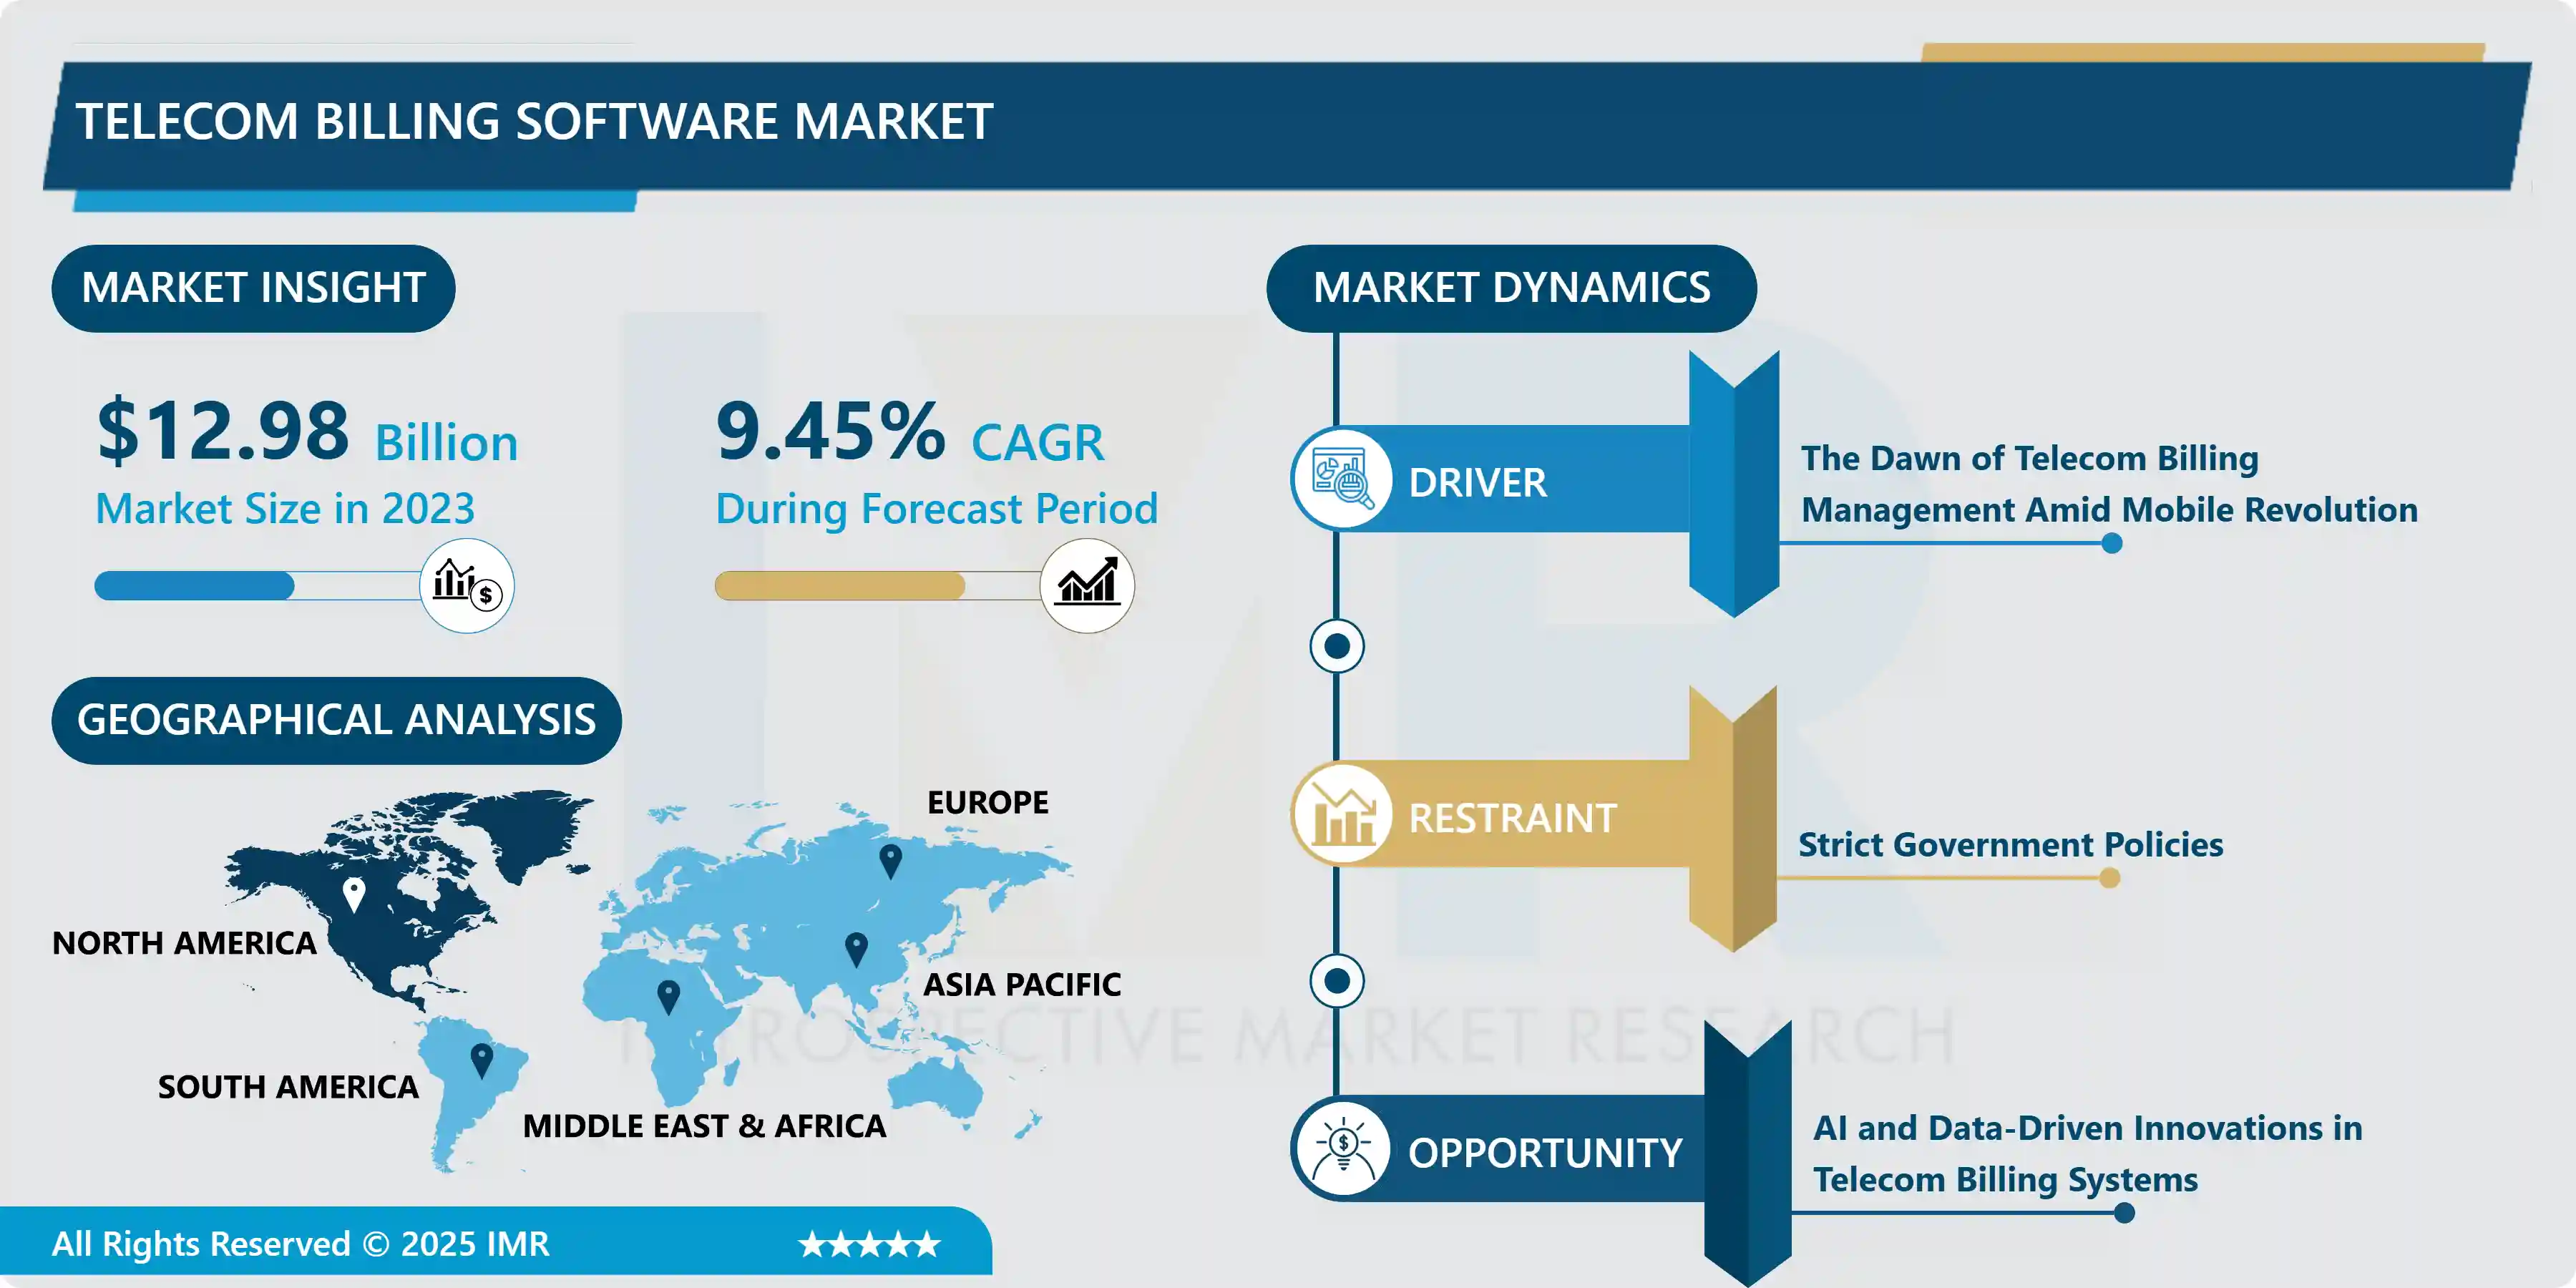
Telecom Billing Software Market Size Was Valued at USD 12.98 billion in 2023 and is Projected to Reach USD 29.26 billion by 2032, Growing at a CAGR of 9.45 % From 2024-2032.
A telecom billing system is a comprehensive software solution that manages the processes, data, and contractual elements required to generate customer invoices and revenue for telecommunications services. These vital systems typically span financial, information, and operations or service management. They can also include fraud management, profitability management, and revenue assurance solutions.
Telecom billing systems are intricate, sophisticated platforms integrating various elements to provide essential functionalities. The platforms collect data from many network elements, such as switches, routers, and data servers. It also stores customer details, service subscriptions, and billing preferences. One key component is an Online Charging System (OCS) that adds a charge for every transaction in real-time. When a device interacts with the telecommunications system, a Call Data Record is generated that registers and details the interaction based on the type of interaction. For example, if it is a call, the minutes are logged. If it is a data interaction, the data usage is noted.
The system uses a rating engine to determine the cost of services and generate invoices, which are then sent to customers through various channels. The billing system manages payments through the customers’ preferred payment methods. It also records payment statuses and sends reminders for overdue payments. Customers handle and manage their accounts, submit payments, and get support from customer self-service portals and customer self-service handles. Telecom providers access in-depth reporting and analytics to obtain information and insights into customer behavior, revenue trends, and performance metrics.
An essential component of the Internet of Things (IoT) is sensors. Through them, an ecosystem for gathering and analyzing data on a particular environment may be established, facilitating easier and more effective monitoring, management, and control. IoT sensors are utilized in a variety of situations, including homes, fields, cars, aircraft, and factories. The physical and logical worlds are connected by sensors, which serve as the eyes and ears of a computing infrastructure that gathers, processes, and interprets sensor data.
Telecom Billing Software has three main cycle billing options. Prepaid Billing - In prepayment billing cycles, payment is organized in advance, and the customer is charged in real-time based on usage. The customer acquires a report of charges at prearranged intervals in the week
Postpaid Billing - It is the most common billing cycle. Customers use the telecommunication services and then are billed based on usage during a specified period. After completion of each cycle, an invoice or statement is produced and directed to the customer. The customer then pays the bill with the help of online transactions, Credit Cards, or mail.
Convergent Billing - Convergent billing is a different approach that can simplify prepaid or postpaid bill timelines. It is prominent because of its structure - it combines all services into one invoice, unlike most traditional prepaid and postpaid systems that keep services in their billing siloes. Convergent billing needs a unified billing structure and is thus the most complex of the three primary billing cycles, mainly when customers use multiple services or have custom contracts.
 Telecom Billing Software Market Trend Analysis
The Dawn of Telecom Billing Management Amid Mobile Revolution
- Previously before the mobile revolution, telecommunications bills were usually grounded on a fixed monthly fee for landline service, with possibly some additional charges for long-distance calls. In the late 1990s, however, the use of mobile phones blasted significantly. It has added a wide range of new services - voice calls, text messages, data contracts with varying usage levels, and roaming charges for international use. Traditional billing systems simply cannot handle the complexity of tracking and accurate billing due to this variety of uses. Errors and customer disputes became more common.
- This is where telecom billing management systems come to the rescue. These advanced software solutions are designed to capture call data records (CDR) in real time, apply appropriate rates based on the customer's plan and location, calculate taxes and discounts, and generate clear and detailed invoices.
- Telecom billing management systems are also revolutionizing customer service. With detailed usage data readily available, customer service representatives can quickly resolve billing issues and offer targeted plans based on individual call patterns. This new efficiency and transparency helped restore customer confidence and fueled the continued growth of the mobile phone industry.
AI and Data-Driven Innovations in Telecom Billing Systems
- Artificial Intelligence (AI): Artificial intelligence can help to generate many invoice and statement-related tasks like payment processing, fraud detection, and reporting. This can save time and money and improve the accuracy and speed of billing processes of the operators.
- Data analysis: Data analysis can help operators better understand their customers along with their needs. With this, more customized rate plans and service packages can be developed and customer service can be improved.
- Cloud computing: A cloud service can be used to implement and operate unified billing systems. This can assist operators to save cost and time on infrastructure and software which leads to increased flexibility and scalability.
- Internet of Things (IoT): The rise of the Internet of Things will lead to an increase in the number of devices that necessary connectivity and billing. Converged billing systems must be organized to handle the large volumes of data generated by these devices.
- 5G: 5G is the latest mobile technology that suggests higher speeds and higher capacity. Converged billing systems must be ready to handle the new types of services that will be available thanks to 5G.
Telecom Billing Software Market Segment Analysis:
Telecom Billing Software Market is Segmented based on Deployment Model, Billing Type, Service Type, Customer Type, and End-User Industry.
By Deployment, On-premise segment is expected to dominate the market during the forecast period
- The Telecom Billing Software Market is divided into On-Premise and Cloud. The on-premises segment is responsible for most of the market, motivated by investments by large enterprises in in-house software deployments and the availability of integrated or stand-alone modules that are deployed primarily at end-user locations.
- On-premises solutions are also known as customer-space solutions. It is the most popular deployment type among operators. Most telecom operators go with on-premises systems because the infrastructure is already present and can be recycled again, which saves a lot of time and cost on infrastructure changes.
- Telecom billing and revenue management solutions are available as stand-alone modules or as an integrated platform, implemented primarily at end-user locations. A suitable solution usually includes separate hardware purchases, software licenses, and annual support and maintenance fees; therefore, these deployment methods are popular in large enterprises.
By End User, Telecommunication Service segment held the largest share in 2023
- Telecom service providers use telecom billing software widely to manage various departments like accounts, bill customers, display call data, and estimate the usage or costs of various services.
- This software permits the service providers to perform various purposes such as evaluating data volumes and bandwidth consumption, providing access to technical support, and budgeting services. Telecom billing software helps service providers offer more services such as multi-unit pricing, usage-based billing, and real-time billing.
Telecom Billing Software Market Regional Insights:
North America is Expected to Dominate the Market Over the Forecast Period
- The North American telecom billing software market is projected to further rise over the forecast period due to growing needs and demand for telecom services and solutions, the growing demand for cost-effective billing, and the new technical revolution. North America is developing rapidly in the telecom billing software industry on account of rising demand for telecommunications over mobile communications and the Internet.
- In addition, market growth is fueled by the need to modernize their billing processes and save money. The market is also when the need to modernize their billing processes and cost savings. Owing to the considerable acceptance of cloud-based billing solutions, which are more affordable and efficient compared to the systems based on a company’s servers and on-premise ones.
- The market is growing due to the existing acceptance, pivot, and further progression of new technologies like artificial intelligence and machine learning. The market is also rising due to the growing demand for customer experience management solutions, rising in the market, which enables telecommunication to make them understand their customers better and offer customized services and solutions.
Telecom Billing Software Market Key Player:
- Amdocs (U.S)
- Oracle Corporation (U.S)
- Netcracker Technology (U.S)
- IBM Corporation (U.S)
- CSG International (U.S)
- Zuora Inc. (U.S)
- Hewlett Packard Enterprise Development LP (U.S)
- Optiva Inc. (Canada)
- Redknee Solutions Inc. (Canada)
- Ericsson (Sweden)
- Accenture plc (Ireland)
- Comarch SA (Poland)
- Openet (Ireland)
- FTS (Israel)
- Ericsson (Sweden)
- Cerillion (U.K)
- SAP SE (Germany)
- Subex Limited (India)
- Infosys Limited (India)
- Mahindra Comviva (India)
- Mphasis Limited (India)
- Tech Mahindra Limited (India)
- Huawei Technologies Co., Ltd. (China)
- NEC Corporation (Japan)
- NEC Corporation (Japan)
Key Industry Developments in the Telecom Billing Software Market:
- In February 2024, Amdocs Expands Strategic Partnership with Microsoft to Drive Generative AI Innovation in Telecom Industry Communications and media enterprise software and services company Amdocs (NASDAQ: DOX) today announced plans to expand its strategic partnership with Microsoft to further bring vertical GenAI- skills to the telecommunications industry, combining Amdocs amAIz platform and Microsoft Azure OpenAI service.
- In May 2024, Oracle and TIM Team Up to Accelerate Cloud Deployment in Italy Oracle and TIM today announced a partnership to support the growing demand for cloud services from public and private sector organizations in Italy. TIM Enterprise, a business unit focused on enterprises and the public sector, will integrate the Oracle Cloud Infrastructure (OCI) software into its portfolio as part of the agreement. In addition, TIM is the hosting partner for Oracle's second planned cloud site in Italy, located in Turin, hosted in TIM Group's reliable next-generation data center.
|
Global Telecom Billing Software Market |
|||
|
Base Year: |
2023 |
Forecast Period: |
2024-2032 |
|
Historical Data: |
2017 to 2023 |
Market Size in 2023: |
USD 12.98 Bn. |
|
Forecast Period 2024-32 CAGR: |
9.45 % |
Market Size in 2032: |
USD 29.26 Bn. |
|
Segments Covered: |
By Deployment Model |
|
|
|
By Billing Type |
|
||
|
By Service Type |
|
||
|
By Customer Type |
|
||
|
By End-User Industry |
|
||
|
By Region |
|
||
|
Key Market Drivers: |
|
||
|
Key Market Restraints: |
|
||
|
Key Opportunities: |
|
||
|
Companies Covered in the report: |
|
||
Chapter 1: Introduction
1.1 Scope and Coverage
Chapter 2:Executive Summary
Chapter 3: Market Landscape
3.1 Market Dynamics
3.1.1 Drivers
3.1.2 Restraints
3.1.3 Opportunities
3.1.4 Challenges
3.2 Market Trend Analysis
3.3 PESTLE Analysis
3.4 Porter's Five Forces Analysis
3.5 Industry Value Chain Analysis
3.6 Ecosystem
3.7 Regulatory Landscape
3.8 Price Trend Analysis
3.9 Patent Analysis
3.10 Technology Evolution
3.11 Investment Pockets
3.12 Import-Export Analysis
Chapter 4: Telecom Billing Software Market by Deployment Model (2018-2032)
4.1 Telecom Billing Software Market Snapshot and Growth Engine
4.2 Market Overview
4.3 On-Premises Billing Software
4.3.1 Introduction and Market Overview
4.3.2 Historic and Forecasted Market Size in Value USD and Volume Units
4.3.3 Key Market Trends, Growth Factors, and Opportunities
4.3.4 Geographic Segmentation Analysis
4.4 Cloud-Based Billing Solutions
4.5 Hybrid
Chapter 5: Telecom Billing Software Market by Billing Type (2018-2032)
5.1 Telecom Billing Software Market Snapshot and Growth Engine
5.2 Market Overview
5.3 Convergent Billing
5.3.1 Introduction and Market Overview
5.3.2 Historic and Forecasted Market Size in Value USD and Volume Units
5.3.3 Key Market Trends, Growth Factors, and Opportunities
5.3.4 Geographic Segmentation Analysis
5.4 Prepaid Billing
5.5 Postpaid Billing
5.6 Interconnect Billing
5.7 Roaming Billing
Chapter 6: Telecom Billing Software Market by Service Type (2018-2032)
6.1 Telecom Billing Software Market Snapshot and Growth Engine
6.2 Market Overview
6.3 Mobile Services Billing
6.3.1 Introduction and Market Overview
6.3.2 Historic and Forecasted Market Size in Value USD and Volume Units
6.3.3 Key Market Trends, Growth Factors, and Opportunities
6.3.4 Geographic Segmentation Analysis
6.4 Fixed-Line Services Billing
6.5 Internet and Broadband Billing
6.6 Voice over IP (VoIP) Billing
6.7 Value-Added Services (VAS) Billing
Chapter 7: Telecom Billing Software Market by Customer Type (2018-2032)
7.1 Telecom Billing Software Market Snapshot and Growth Engine
7.2 Market Overview
7.3 Enterprise Billing (B2B)
7.3.1 Introduction and Market Overview
7.3.2 Historic and Forecasted Market Size in Value USD and Volume Units
7.3.3 Key Market Trends, Growth Factors, and Opportunities
7.3.4 Geographic Segmentation Analysis
7.4 Consumer Billing (B2C)
7.5 Wholesale Billing
Chapter 8: Telecom Billing Software Market by End-User Industry (2018-2032)
8.1 Telecom Billing Software Market Snapshot and Growth Engine
8.2 Market Overview
8.3 Telecommunications Operators
8.3.1 Introduction and Market Overview
8.3.2 Historic and Forecasted Market Size in Value USD and Volume Units
8.3.3 Key Market Trends, Growth Factors, and Opportunities
8.3.4 Geographic Segmentation Analysis
8.4 Internet Service Providers (ISPs)
8.5 Cable and Satellite Operators
8.6 Managed Service Providers (MSPs)
8.7 Mobile Virtual Network Operators (MVNOs)
Chapter 9: Company Profiles and Competitive Analysis
9.1 Competitive Landscape
9.1.1 Competitive Benchmarking
9.1.2 Telecom Billing Software Market Share by Manufacturer (2024)
9.1.3 Industry BCG Matrix
9.1.4 Heat Map Analysis
9.1.5 Mergers and Acquisitions
9.2 EXPEDIA GROUP (US)
9.2.1 Company Overview
9.2.2 Key Executives
9.2.3 Company Snapshot
9.2.4 Role of the Company in the Market
9.2.5 Sustainability and Social Responsibility
9.2.6 Operating Business Segments
9.2.7 Product Portfolio
9.2.8 Business Performance
9.2.9 Key Strategic Moves and Recent Developments
9.2.10 SWOT Analysis
9.3 AGILYSYS (US)
9.4 ORACLE (US)
9.5 NAVITAIRE (US)
9.6 SABRE (US)
9.7 DOHOP (ICELAND)
9.8 TRAVELPORT (UK)
9.9 TRAVELTEK (UK)
9.10 TRIP SOLUTIONS (UK)
9.11 AMADEUS IT GROUP (SPAIN)
9.12 GP SOLUTIONS (GERMANY)
9.13 DIGITRIPS (FRANCE)
9.14 TRAVELOPRO (INDIA)
9.15 TRAWEX (INDIA)
9.16 TRAVEL BUDDY (INDIA)
9.17 QTECH SOFTWARE PVT. LTD. (INDIA)
9.18 AVANI CIMCON TECHNOLOGIES (INDIA)
9.19 WEBCRSTRAVEL TECHNOLOGIES PVT. LTD (INDIA)
9.20 QTECH SOFTWARE (INDIA)
9.21 MTRIP (CHINA)
9.22 SITEMINDER (AUSTRALIA)
9.23 TRAMADA SYSTEMS (AUSTRALIA)
9.24 TRAMADA SYSTEMS PVT. LTD. (AUSTRALIA)
9.25 TECHNO HEAVEN (UAE)
9.26 GLOBAL TRAVEL TECH (BELGIUM)
9.27 AND
Chapter 10: Global Telecom Billing Software Market By Region
10.1 Overview
10.2. North America Telecom Billing Software Market
10.2.1 Key Market Trends, Growth Factors and Opportunities
10.2.2 Top Key Companies
10.2.3 Historic and Forecasted Market Size by Segments
10.2.4 Historic and Forecasted Market Size by Deployment Model
10.2.4.1 On-Premises Billing Software
10.2.4.2 Cloud-Based Billing Solutions
10.2.4.3 Hybrid
10.2.5 Historic and Forecasted Market Size by Billing Type
10.2.5.1 Convergent Billing
10.2.5.2 Prepaid Billing
10.2.5.3 Postpaid Billing
10.2.5.4 Interconnect Billing
10.2.5.5 Roaming Billing
10.2.6 Historic and Forecasted Market Size by Service Type
10.2.6.1 Mobile Services Billing
10.2.6.2 Fixed-Line Services Billing
10.2.6.3 Internet and Broadband Billing
10.2.6.4 Voice over IP (VoIP) Billing
10.2.6.5 Value-Added Services (VAS) Billing
10.2.7 Historic and Forecasted Market Size by Customer Type
10.2.7.1 Enterprise Billing (B2B)
10.2.7.2 Consumer Billing (B2C)
10.2.7.3 Wholesale Billing
10.2.8 Historic and Forecasted Market Size by End-User Industry
10.2.8.1 Telecommunications Operators
10.2.8.2 Internet Service Providers (ISPs)
10.2.8.3 Cable and Satellite Operators
10.2.8.4 Managed Service Providers (MSPs)
10.2.8.5 Mobile Virtual Network Operators (MVNOs)
10.2.9 Historic and Forecast Market Size by Country
10.2.9.1 US
10.2.9.2 Canada
10.2.9.3 Mexico
10.3. Eastern Europe Telecom Billing Software Market
10.3.1 Key Market Trends, Growth Factors and Opportunities
10.3.2 Top Key Companies
10.3.3 Historic and Forecasted Market Size by Segments
10.3.4 Historic and Forecasted Market Size by Deployment Model
10.3.4.1 On-Premises Billing Software
10.3.4.2 Cloud-Based Billing Solutions
10.3.4.3 Hybrid
10.3.5 Historic and Forecasted Market Size by Billing Type
10.3.5.1 Convergent Billing
10.3.5.2 Prepaid Billing
10.3.5.3 Postpaid Billing
10.3.5.4 Interconnect Billing
10.3.5.5 Roaming Billing
10.3.6 Historic and Forecasted Market Size by Service Type
10.3.6.1 Mobile Services Billing
10.3.6.2 Fixed-Line Services Billing
10.3.6.3 Internet and Broadband Billing
10.3.6.4 Voice over IP (VoIP) Billing
10.3.6.5 Value-Added Services (VAS) Billing
10.3.7 Historic and Forecasted Market Size by Customer Type
10.3.7.1 Enterprise Billing (B2B)
10.3.7.2 Consumer Billing (B2C)
10.3.7.3 Wholesale Billing
10.3.8 Historic and Forecasted Market Size by End-User Industry
10.3.8.1 Telecommunications Operators
10.3.8.2 Internet Service Providers (ISPs)
10.3.8.3 Cable and Satellite Operators
10.3.8.4 Managed Service Providers (MSPs)
10.3.8.5 Mobile Virtual Network Operators (MVNOs)
10.3.9 Historic and Forecast Market Size by Country
10.3.9.1 Russia
10.3.9.2 Bulgaria
10.3.9.3 The Czech Republic
10.3.9.4 Hungary
10.3.9.5 Poland
10.3.9.6 Romania
10.3.9.7 Rest of Eastern Europe
10.4. Western Europe Telecom Billing Software Market
10.4.1 Key Market Trends, Growth Factors and Opportunities
10.4.2 Top Key Companies
10.4.3 Historic and Forecasted Market Size by Segments
10.4.4 Historic and Forecasted Market Size by Deployment Model
10.4.4.1 On-Premises Billing Software
10.4.4.2 Cloud-Based Billing Solutions
10.4.4.3 Hybrid
10.4.5 Historic and Forecasted Market Size by Billing Type
10.4.5.1 Convergent Billing
10.4.5.2 Prepaid Billing
10.4.5.3 Postpaid Billing
10.4.5.4 Interconnect Billing
10.4.5.5 Roaming Billing
10.4.6 Historic and Forecasted Market Size by Service Type
10.4.6.1 Mobile Services Billing
10.4.6.2 Fixed-Line Services Billing
10.4.6.3 Internet and Broadband Billing
10.4.6.4 Voice over IP (VoIP) Billing
10.4.6.5 Value-Added Services (VAS) Billing
10.4.7 Historic and Forecasted Market Size by Customer Type
10.4.7.1 Enterprise Billing (B2B)
10.4.7.2 Consumer Billing (B2C)
10.4.7.3 Wholesale Billing
10.4.8 Historic and Forecasted Market Size by End-User Industry
10.4.8.1 Telecommunications Operators
10.4.8.2 Internet Service Providers (ISPs)
10.4.8.3 Cable and Satellite Operators
10.4.8.4 Managed Service Providers (MSPs)
10.4.8.5 Mobile Virtual Network Operators (MVNOs)
10.4.9 Historic and Forecast Market Size by Country
10.4.9.1 Germany
10.4.9.2 UK
10.4.9.3 France
10.4.9.4 The Netherlands
10.4.9.5 Italy
10.4.9.6 Spain
10.4.9.7 Rest of Western Europe
10.5. Asia Pacific Telecom Billing Software Market
10.5.1 Key Market Trends, Growth Factors and Opportunities
10.5.2 Top Key Companies
10.5.3 Historic and Forecasted Market Size by Segments
10.5.4 Historic and Forecasted Market Size by Deployment Model
10.5.4.1 On-Premises Billing Software
10.5.4.2 Cloud-Based Billing Solutions
10.5.4.3 Hybrid
10.5.5 Historic and Forecasted Market Size by Billing Type
10.5.5.1 Convergent Billing
10.5.5.2 Prepaid Billing
10.5.5.3 Postpaid Billing
10.5.5.4 Interconnect Billing
10.5.5.5 Roaming Billing
10.5.6 Historic and Forecasted Market Size by Service Type
10.5.6.1 Mobile Services Billing
10.5.6.2 Fixed-Line Services Billing
10.5.6.3 Internet and Broadband Billing
10.5.6.4 Voice over IP (VoIP) Billing
10.5.6.5 Value-Added Services (VAS) Billing
10.5.7 Historic and Forecasted Market Size by Customer Type
10.5.7.1 Enterprise Billing (B2B)
10.5.7.2 Consumer Billing (B2C)
10.5.7.3 Wholesale Billing
10.5.8 Historic and Forecasted Market Size by End-User Industry
10.5.8.1 Telecommunications Operators
10.5.8.2 Internet Service Providers (ISPs)
10.5.8.3 Cable and Satellite Operators
10.5.8.4 Managed Service Providers (MSPs)
10.5.8.5 Mobile Virtual Network Operators (MVNOs)
10.5.9 Historic and Forecast Market Size by Country
10.5.9.1 China
10.5.9.2 India
10.5.9.3 Japan
10.5.9.4 South Korea
10.5.9.5 Malaysia
10.5.9.6 Thailand
10.5.9.7 Vietnam
10.5.9.8 The Philippines
10.5.9.9 Australia
10.5.9.10 New Zealand
10.5.9.11 Rest of APAC
10.6. Middle East & Africa Telecom Billing Software Market
10.6.1 Key Market Trends, Growth Factors and Opportunities
10.6.2 Top Key Companies
10.6.3 Historic and Forecasted Market Size by Segments
10.6.4 Historic and Forecasted Market Size by Deployment Model
10.6.4.1 On-Premises Billing Software
10.6.4.2 Cloud-Based Billing Solutions
10.6.4.3 Hybrid
10.6.5 Historic and Forecasted Market Size by Billing Type
10.6.5.1 Convergent Billing
10.6.5.2 Prepaid Billing
10.6.5.3 Postpaid Billing
10.6.5.4 Interconnect Billing
10.6.5.5 Roaming Billing
10.6.6 Historic and Forecasted Market Size by Service Type
10.6.6.1 Mobile Services Billing
10.6.6.2 Fixed-Line Services Billing
10.6.6.3 Internet and Broadband Billing
10.6.6.4 Voice over IP (VoIP) Billing
10.6.6.5 Value-Added Services (VAS) Billing
10.6.7 Historic and Forecasted Market Size by Customer Type
10.6.7.1 Enterprise Billing (B2B)
10.6.7.2 Consumer Billing (B2C)
10.6.7.3 Wholesale Billing
10.6.8 Historic and Forecasted Market Size by End-User Industry
10.6.8.1 Telecommunications Operators
10.6.8.2 Internet Service Providers (ISPs)
10.6.8.3 Cable and Satellite Operators
10.6.8.4 Managed Service Providers (MSPs)
10.6.8.5 Mobile Virtual Network Operators (MVNOs)
10.6.9 Historic and Forecast Market Size by Country
10.6.9.1 Turkiye
10.6.9.2 Bahrain
10.6.9.3 Kuwait
10.6.9.4 Saudi Arabia
10.6.9.5 Qatar
10.6.9.6 UAE
10.6.9.7 Israel
10.6.9.8 South Africa
10.7. South America Telecom Billing Software Market
10.7.1 Key Market Trends, Growth Factors and Opportunities
10.7.2 Top Key Companies
10.7.3 Historic and Forecasted Market Size by Segments
10.7.4 Historic and Forecasted Market Size by Deployment Model
10.7.4.1 On-Premises Billing Software
10.7.4.2 Cloud-Based Billing Solutions
10.7.4.3 Hybrid
10.7.5 Historic and Forecasted Market Size by Billing Type
10.7.5.1 Convergent Billing
10.7.5.2 Prepaid Billing
10.7.5.3 Postpaid Billing
10.7.5.4 Interconnect Billing
10.7.5.5 Roaming Billing
10.7.6 Historic and Forecasted Market Size by Service Type
10.7.6.1 Mobile Services Billing
10.7.6.2 Fixed-Line Services Billing
10.7.6.3 Internet and Broadband Billing
10.7.6.4 Voice over IP (VoIP) Billing
10.7.6.5 Value-Added Services (VAS) Billing
10.7.7 Historic and Forecasted Market Size by Customer Type
10.7.7.1 Enterprise Billing (B2B)
10.7.7.2 Consumer Billing (B2C)
10.7.7.3 Wholesale Billing
10.7.8 Historic and Forecasted Market Size by End-User Industry
10.7.8.1 Telecommunications Operators
10.7.8.2 Internet Service Providers (ISPs)
10.7.8.3 Cable and Satellite Operators
10.7.8.4 Managed Service Providers (MSPs)
10.7.8.5 Mobile Virtual Network Operators (MVNOs)
10.7.9 Historic and Forecast Market Size by Country
10.7.9.1 Brazil
10.7.9.2 Argentina
10.7.9.3 Rest of SA
Chapter 11 Analyst Viewpoint and Conclusion
11.1 Recommendations and Concluding Analysis
11.2 Potential Market Strategies
Chapter 12 Research Methodology
12.1 Research Process
12.2 Primary Research
12.3 Secondary Research
|
Global Telecom Billing Software Market |
|||
|
Base Year: |
2023 |
Forecast Period: |
2024-2032 |
|
Historical Data: |
2017 to 2023 |
Market Size in 2023: |
USD 12.98 Bn. |
|
Forecast Period 2024-32 CAGR: |
9.45 % |
Market Size in 2032: |
USD 29.26 Bn. |
|
Segments Covered: |
By Deployment Model |
|
|
|
By Billing Type |
|
||
|
By Service Type |
|
||
|
By Customer Type |
|
||
|
By End-User Industry |
|
||
|
By Region |
|
||
|
Key Market Drivers: |
|
||
|
Key Market Restraints: |
|
||
|
Key Opportunities: |
|
||
|
Companies Covered in the report: |
|
||


