


Surgical Visualization System Market Synopsis
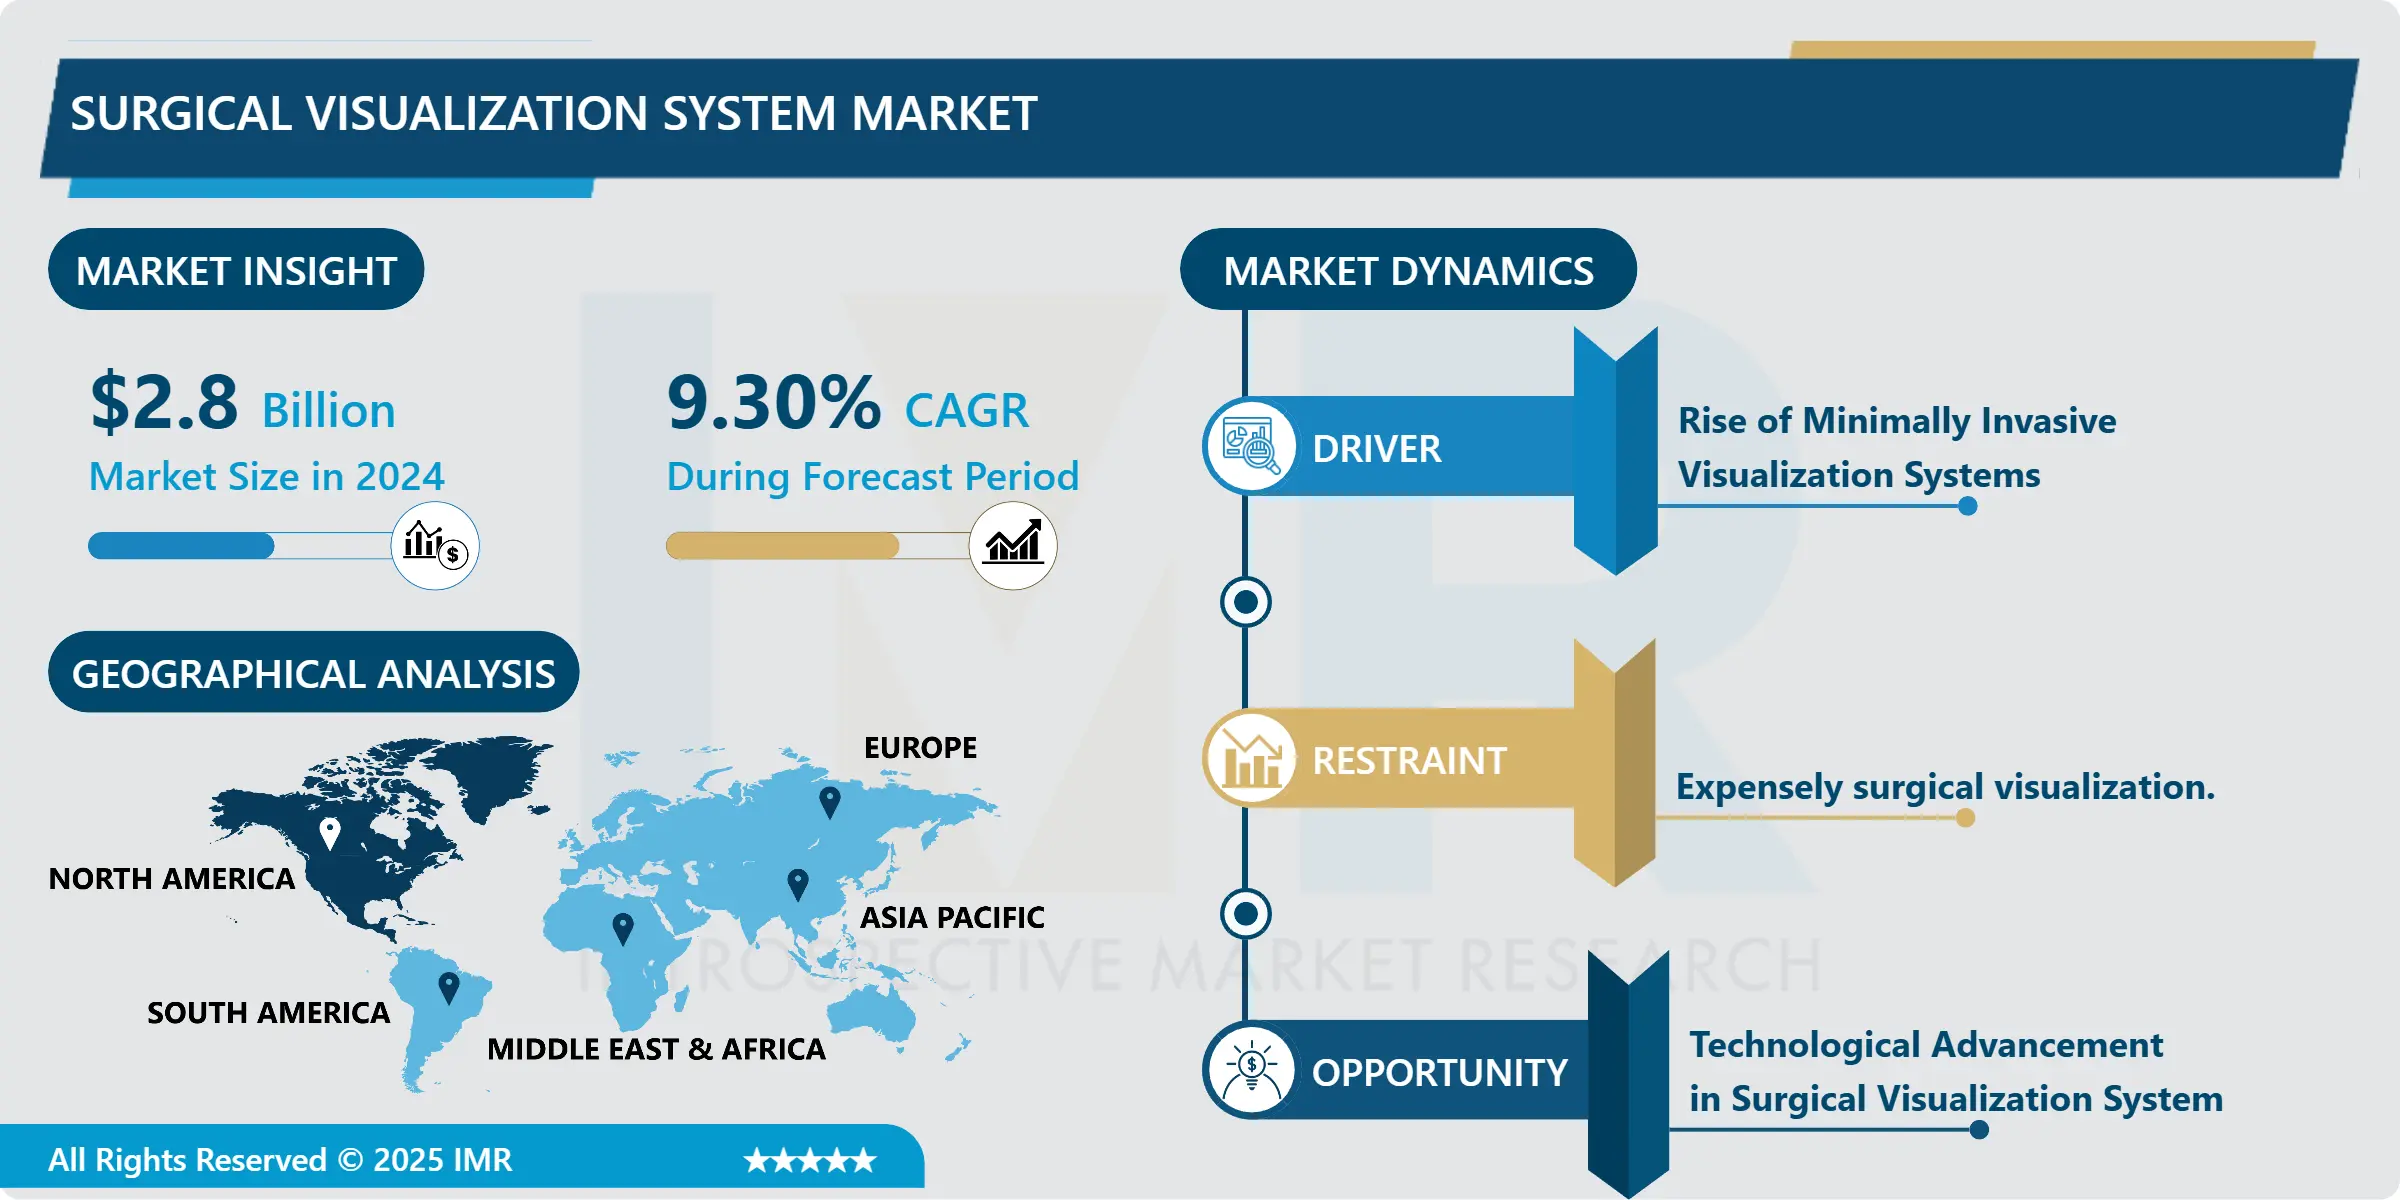
Surgical Visualization System Market Size is Valued at USD 2.56 Billion in 2023, and is Projected to Reach USD 5.71 Billion by 2032, Growing at a CAGR of 9.30% From 2024-2032.
The market for surgical visualization systems comprises an assortment of technologies that are employed during surgical procedures to improve the visibility of the surgical site. These systems comprise software, displays, and cameras, among other components, which enable surgeons to observe anatomical structures in greater clarity and detail. Increasing demand for minimally invasive surgeries, technological advancements in visualization systems, and the global expansion of surgical procedures all contribute to the growth of the market. Prominent participants in the industry consist of, among others, Karl Storz, ConMed Corporation, and Olympus Corporation.
The factors that are driving the Surgical Visualization System Market include the rising incidence of chronic diseases, development of healthcare facilities, and the preference for minimally invasive surgeries. The advantages of minimally invasive procedures include less trauma to the patient, shorter hospitalization, and faster rehabilitation, which are also the factors that drive the market. Moreover, the availability of innovative visualization systems in surgery, including 3D imaging, robotic surgeries, and augmented reality, is also contributing to the growth of the market. These innovations increase the accuracy of the surgery, the quality of the outcome, and the rate at which they are being integrated into healthcare systems across the globe, thus fueling the growth of the market.
On the other hand, the market has threats such as high costs related to surgical visualization systems especially for the advanced technologies thus reducing market penetration especially in the developing world. However, the absence of skilled workers in the healthcare sector who can operate these systems may slow down market growth. In addition, there are issues with the approval and commercialization of new surgical visualization technologies that act as a hindrance to the market growth. However, the market is expected to expand as health care systems across the globe remain to focus on minimally invasive surgery and increase their investment in surgical technologies.
Surgical Visualization System Market Trend Analysis
Surgical Visualization System Market Drivers- Rise of Minimally Invasive Visualization Systems
- The Surgical Visualization System Market is also witnessing a significant shift towards technology integration, especially in the context of a growing preference for minimally invasive surgeries. These systems provide clear imaging, three-dimensional view, and real-time control, which increases the accuracy of surgery and decreases the chances of complications. These systems are being adopted by surgeons in order to enhance the quality of treatment and reduce the time required for the recovery process. Moreover, the incorporation of augmented reality and virtual reality is also transforming the surgical operations as it offers the surgeon better visualization and navigation aids. This trend is expected to continue as healthcare facilities continue to seek better ways to enhance the surgical procedures and patient satisfaction.
- Another trend that is emerging in the Surgical Visualization System Market is the shift towards portable and wireless systems. These systems provide more flexibility and comfort in the operating theaters, enabling surgeons to maneuver during operations. Wireless technologies integrated into the workplace eliminate the problem of cable mess and enhance the flow of operations. Moreover, portable systems are cheaper to implement in healthcare facilities because they do not require elaborate structures and equipment. The market is also expected to expand in the future due to the rising popularity of minimally invasive surgeries and the use of portable and wireless surgical visualization systems.
Surgical Visualization System Market Opportunities- Technological Advancement in Surgical Visualization System
- The Surgical Visualization System Market is experiencing a tremendous growth potential due to factors such as technological developments, growing preference for minimally invasive surgeries, and a growing health care spend across the world. Surgical visualization systems are tools that help in improving the visibility during surgery, thus enhancing the accuracy and minimizing the chances of complications. The market is also experiencing a positive impact from the increasing use of robotic surgical systems and the incorporation of such technologies as AI and AR in surgical visualization. In addition, an increase in the number of patients suffering from chronic diseases that may need surgery, and the increased global population of elderly people who are more susceptible to such diseases is also contributing to the growth of this market.
- However, there are some challenges that affect the market such as high costs of implementing these systems, particularly the robotic-assisted systems which may make their implementation hard in some geographical areas or healthcare facilities. However, certain factors such as the absence of adequate number of skilled professionals who are well-versed with these systems, and doubts over the reliability and safety of robotic surgeries might somewhat restrict the growth of the market. However, with constant advancements in technology to improve these systems and overcome these limitations, the Surgical Visualization System Market is expected to grow rapidly in the future, particularly in the developing countries where the healthcare sector is gradually improving and showing increased investment.
Surgical Visualization System Market Segment Analysis:
Surgical Visualization System Market Segmented based on By Product, application, and end-users.
By Type, Light Sources segment is expected to dominate the market during the forecast period
- The Surgical Visualization System Market is classified on the basis of type into Endoscopic Cameras, Light Sources, Displays & Monitors, Video Recorders, and Accessories. All of these segments are vital in increasing the chances of visualizing during surgeries and improving the general outcomes of the surgeries. Endoscopic cameras and light sources offer bright and clear images of the surgical site and are used in minimally invasive surgeries.
- Screens and monitors help the surgeon to visualize the surgical field in real-time and make the right decisions during the surgery. Video cameras are used to record surgeries for archiving and teaching purposes. Cables, adapters, and mounts are some of the most important parts of the visualization system since they connect and secure the components.
By Application, Gastroscopy segment held the largest share in 2024
- The Surgical Visualization System Market is categorized based on the application area which includes Gastroscopy, Colonoscopy, Endoscopy and others. Gastroscopy is an endoscopic procedure that involves the use of a flexible tube with a camera, light source, and screen to examine the upper gastrointestinal tract. Colonoscopy is an endoscopic examination of the colon and rectum, which is carried out using a colonoscope.
- Endoscopy is a general term that refers to a number of procedures that look inside the body or a hollow organ or body cavity using an endoscope. Other procedures may include bronchoscopy, which involves examination of the airways, cystoscopy, which involves examination of the bladder, and laparoscopy, which involves a form of exploratory surgery in the abdomen or pelvis. Every application needs different types of visualization systems based on the procedure that has to be performed, which is the reason why there is a need for a variety of surgical visualization systems in the market.
Surgical Visualization System Market Regional Insights:
North America is Expected to Dominate the Market Over the Forecast period
- The North American Surgical Visualization System Market is a fast growing and innovative segment of the overall Medical Imaging market. North America is one of the largest surgical visualization systems markets due to its well-developed healthcare industry, high healthcare costs, and key market players. The market is mainly fueled by factors such as rising incidences of chronic diseases, rising demand for less invasive procedures and technological innovations in surgical imaging solutions. Also, the increasing incidence of chronic diseases, an increase in the geriatric population, and a shift towards outpatient surgeries also contribute to the growth of the market.
- However, there are some threats that are associated with the market, including high costs of surgical visualization systems, few reimbursement policies, and risks of infections related to surgeries. Nevertheless, the North American market for surgical visualization systems is anticipated to experience tremendous growth in the future due to factors such as technological development, rising healthcare expenditure, and focus on patient protection and healthcare improvement.
Active Key Players in the Surgical Visualization System Market
- Medtronic (Ireland)
- B. Braun AG (Germany)
- Olympus Corporation (Japan)
- Boston Scientific Corporation (U.S)
- Karl Storz GmbH & Co. KG. (Germany)
- Acutronic Medical Systems AG(Switzerland)
- Cogentix Medical (U.S)
- Optomic, Fujifilm Corporation (Japan)
- Stryker CONMED Corporation (U.S)
- Hologic, Inc. (U.S.)
- Smith & Nephew plc (U.K.)
- GE Healthcare (U.S.)
- Philips Healthcare (Netherlands)
- Siemens Healthineers (Germany)
- Medivators Inc. (U.S.)
- EndoChoice Holdings, Inc. (U.S.)
- Zimmer Biomet Holdings, Inc. (U.S.)
- Allergan plc (U.S.)
- Lumenis Ltd. (Israel)
- Happers berger otopront GmbH. (Germany),and Other active players
Key Industry Developments in the Surgical Visualization System Market:
- In May 2024, Anaut announced a major milestone with the regulatory approval of their innovative medical device, Eureka, by Japan's Ministry of Health, Labour and Welfare. This advanced software, which utilizes cutting-edge artificial intelligence, was approved to revolutionize surgical practices. The approval marked a significant achievement for Anaut, as Eureka was poised to transform surgical visualization with its sophisticated AI capabilities. This advancement highlighted the company's commitment to enhancing medical technology and improving surgical outcomes through state-of-the-art solutions.
- In April 2024, Carl Zeiss Meditec AG announced that it had completed the acquisition of 100% of the Dutch Ophthalmic Research Center (D.O.R.C.) from the investment firm Eurazeo SE, Paris, France, after securing all required regulatory approvals. This acquisition enhanced and complemented ZEISS Medical Technology's extensive ophthalmic portfolio and range of digitally connected workflow solutions. The expanded portfolio addressed a variety of eye conditions, including retina and cornea disorders, cataracts, glaucoma, and refractive errors.
|
Global Surgical Visualization System Market |
|||
|
Base Year: |
2024 |
Forecast Period: |
2025-2032 |
|
Historical Data: |
2018 to 2023 |
Market Size in 2024: |
USD 2.8 Bn. |
|
Forecast Period 2024-32 CAGR: |
9.30 % |
Market Size in 2032: |
USD 5.71 Bn. |
|
Segments Covered: |
By Type |
|
|
|
By Application |
|
||
|
End-user |
|
||
|
By Region |
|
||
|
Key Market Drivers: |
|
||
|
Key Market Restraints: |
|
||
|
Key Opportunities: |
|
||
|
Companies Covered in the report: |
|
||
Chapter 1: Introduction
1.1 Scope and Coverage
Chapter 2:Executive Summary
Chapter 3: Market Landscape
3.1 Market Dynamics
3.1.1 Drivers
3.1.2 Restraints
3.1.3 Opportunities
3.1.4 Challenges
3.2 Market Trend Analysis
3.3 PESTLE Analysis
3.4 Porter's Five Forces Analysis
3.5 Industry Value Chain Analysis
3.6 Ecosystem
3.7 Regulatory Landscape
3.8 Price Trend Analysis
3.9 Patent Analysis
3.10 Technology Evolution
3.11 Investment Pockets
3.12 Import-Export Analysis
Chapter 4: Surgical Visualization System Market by Type (2018-2032)
4.1 Surgical Visualization System Market Snapshot and Growth Engine
4.2 Market Overview
4.3 Endoscopic Cameras
4.3.1 Introduction and Market Overview
4.3.2 Historic and Forecasted Market Size in Value USD and Volume Units
4.3.3 Key Market Trends, Growth Factors, and Opportunities
4.3.4 Geographic Segmentation Analysis
4.4 Light Sources
4.5 Displays & Monitors
4.6 Video Recorders
4.7 Accessories
Chapter 5: Surgical Visualization System Market by Application (2018-2032)
5.1 Surgical Visualization System Market Snapshot and Growth Engine
5.2 Market Overview
5.3 Gastroscopy
5.3.1 Introduction and Market Overview
5.3.2 Historic and Forecasted Market Size in Value USD and Volume Units
5.3.3 Key Market Trends, Growth Factors, and Opportunities
5.3.4 Geographic Segmentation Analysis
5.4 Colonoscopy
5.5 Endoscopy
5.6 Other
5.7 End-user
5.8 Hospitals
5.9 Diagnostic Imaging Centers
5.10 Other
Chapter 6: Company Profiles and Competitive Analysis
6.1 Competitive Landscape
6.1.1 Competitive Benchmarking
6.1.2 Surgical Visualization System Market Share by Manufacturer (2024)
6.1.3 Industry BCG Matrix
6.1.4 Heat Map Analysis
6.1.5 Mergers and Acquisitions
6.2 MEDTRONIC
6.2.1 Company Overview
6.2.2 Key Executives
6.2.3 Company Snapshot
6.2.4 Role of the Company in the Market
6.2.5 Sustainability and Social Responsibility
6.2.6 Operating Business Segments
6.2.7 Product Portfolio
6.2.8 Business Performance
6.2.9 Key Strategic Moves and Recent Developments
6.2.10 SWOT Analysis
6.3 B. BRAUN MELSUNGEN AG
6.4 STRYKER
6.5 ZIMMER BIOMET
6.6 DEPUY SYNTHES (JOHNSON & JOHNSON)
6.7 OLYMPUS CORPORATION
6.8 RICHARD WOLF GMBH
6.9 CONMED CORPORATION
6.10 MIZUHO OSI
6.11 SMITH & NEPHEW
6.12 MEDLINE INDUSTRIES INCKARL STORZ SE & CO. KG
6.13 HOYA CORPORATION (PENTAX MEDICAL)
6.14 KLS MARTIN GROUP
6.15 BOVIE MEDICAL CORPORATION
6.16 NICO CORPORATION
6.17 BRAINLAB AG
6.18 INTEGRA LIFESCIENCES CORPORATION
6.19 ALPHATEC SPINE
6.20 AYGUN SURGICAL INSTRUMENTS AND OTHER KEY PLAYERS
Chapter 7: Global Surgical Visualization System Market By Region
7.1 Overview
7.2. North America Surgical Visualization System Market
7.2.1 Key Market Trends, Growth Factors and Opportunities
7.2.2 Top Key Companies
7.2.3 Historic and Forecasted Market Size by Segments
7.2.4 Historic and Forecasted Market Size by Type
7.2.4.1 Endoscopic Cameras
7.2.4.2 Light Sources
7.2.4.3 Displays & Monitors
7.2.4.4 Video Recorders
7.2.4.5 Accessories
7.2.5 Historic and Forecasted Market Size by Application
7.2.5.1 Gastroscopy
7.2.5.2 Colonoscopy
7.2.5.3 Endoscopy
7.2.5.4 Other
7.2.5.5 End-user
7.2.5.6 Hospitals
7.2.5.7 Diagnostic Imaging Centers
7.2.5.8 Other
7.2.6 Historic and Forecast Market Size by Country
7.2.6.1 US
7.2.6.2 Canada
7.2.6.3 Mexico
7.3. Eastern Europe Surgical Visualization System Market
7.3.1 Key Market Trends, Growth Factors and Opportunities
7.3.2 Top Key Companies
7.3.3 Historic and Forecasted Market Size by Segments
7.3.4 Historic and Forecasted Market Size by Type
7.3.4.1 Endoscopic Cameras
7.3.4.2 Light Sources
7.3.4.3 Displays & Monitors
7.3.4.4 Video Recorders
7.3.4.5 Accessories
7.3.5 Historic and Forecasted Market Size by Application
7.3.5.1 Gastroscopy
7.3.5.2 Colonoscopy
7.3.5.3 Endoscopy
7.3.5.4 Other
7.3.5.5 End-user
7.3.5.6 Hospitals
7.3.5.7 Diagnostic Imaging Centers
7.3.5.8 Other
7.3.6 Historic and Forecast Market Size by Country
7.3.6.1 Russia
7.3.6.2 Bulgaria
7.3.6.3 The Czech Republic
7.3.6.4 Hungary
7.3.6.5 Poland
7.3.6.6 Romania
7.3.6.7 Rest of Eastern Europe
7.4. Western Europe Surgical Visualization System Market
7.4.1 Key Market Trends, Growth Factors and Opportunities
7.4.2 Top Key Companies
7.4.3 Historic and Forecasted Market Size by Segments
7.4.4 Historic and Forecasted Market Size by Type
7.4.4.1 Endoscopic Cameras
7.4.4.2 Light Sources
7.4.4.3 Displays & Monitors
7.4.4.4 Video Recorders
7.4.4.5 Accessories
7.4.5 Historic and Forecasted Market Size by Application
7.4.5.1 Gastroscopy
7.4.5.2 Colonoscopy
7.4.5.3 Endoscopy
7.4.5.4 Other
7.4.5.5 End-user
7.4.5.6 Hospitals
7.4.5.7 Diagnostic Imaging Centers
7.4.5.8 Other
7.4.6 Historic and Forecast Market Size by Country
7.4.6.1 Germany
7.4.6.2 UK
7.4.6.3 France
7.4.6.4 The Netherlands
7.4.6.5 Italy
7.4.6.6 Spain
7.4.6.7 Rest of Western Europe
7.5. Asia Pacific Surgical Visualization System Market
7.5.1 Key Market Trends, Growth Factors and Opportunities
7.5.2 Top Key Companies
7.5.3 Historic and Forecasted Market Size by Segments
7.5.4 Historic and Forecasted Market Size by Type
7.5.4.1 Endoscopic Cameras
7.5.4.2 Light Sources
7.5.4.3 Displays & Monitors
7.5.4.4 Video Recorders
7.5.4.5 Accessories
7.5.5 Historic and Forecasted Market Size by Application
7.5.5.1 Gastroscopy
7.5.5.2 Colonoscopy
7.5.5.3 Endoscopy
7.5.5.4 Other
7.5.5.5 End-user
7.5.5.6 Hospitals
7.5.5.7 Diagnostic Imaging Centers
7.5.5.8 Other
7.5.6 Historic and Forecast Market Size by Country
7.5.6.1 China
7.5.6.2 India
7.5.6.3 Japan
7.5.6.4 South Korea
7.5.6.5 Malaysia
7.5.6.6 Thailand
7.5.6.7 Vietnam
7.5.6.8 The Philippines
7.5.6.9 Australia
7.5.6.10 New Zealand
7.5.6.11 Rest of APAC
7.6. Middle East & Africa Surgical Visualization System Market
7.6.1 Key Market Trends, Growth Factors and Opportunities
7.6.2 Top Key Companies
7.6.3 Historic and Forecasted Market Size by Segments
7.6.4 Historic and Forecasted Market Size by Type
7.6.4.1 Endoscopic Cameras
7.6.4.2 Light Sources
7.6.4.3 Displays & Monitors
7.6.4.4 Video Recorders
7.6.4.5 Accessories
7.6.5 Historic and Forecasted Market Size by Application
7.6.5.1 Gastroscopy
7.6.5.2 Colonoscopy
7.6.5.3 Endoscopy
7.6.5.4 Other
7.6.5.5 End-user
7.6.5.6 Hospitals
7.6.5.7 Diagnostic Imaging Centers
7.6.5.8 Other
7.6.6 Historic and Forecast Market Size by Country
7.6.6.1 Turkiye
7.6.6.2 Bahrain
7.6.6.3 Kuwait
7.6.6.4 Saudi Arabia
7.6.6.5 Qatar
7.6.6.6 UAE
7.6.6.7 Israel
7.6.6.8 South Africa
7.7. South America Surgical Visualization System Market
7.7.1 Key Market Trends, Growth Factors and Opportunities
7.7.2 Top Key Companies
7.7.3 Historic and Forecasted Market Size by Segments
7.7.4 Historic and Forecasted Market Size by Type
7.7.4.1 Endoscopic Cameras
7.7.4.2 Light Sources
7.7.4.3 Displays & Monitors
7.7.4.4 Video Recorders
7.7.4.5 Accessories
7.7.5 Historic and Forecasted Market Size by Application
7.7.5.1 Gastroscopy
7.7.5.2 Colonoscopy
7.7.5.3 Endoscopy
7.7.5.4 Other
7.7.5.5 End-user
7.7.5.6 Hospitals
7.7.5.7 Diagnostic Imaging Centers
7.7.5.8 Other
7.7.6 Historic and Forecast Market Size by Country
7.7.6.1 Brazil
7.7.6.2 Argentina
7.7.6.3 Rest of SA
Chapter 8 Analyst Viewpoint and Conclusion
8.1 Recommendations and Concluding Analysis
8.2 Potential Market Strategies
Chapter 9 Research Methodology
9.1 Research Process
9.2 Primary Research
9.3 Secondary Research
|
Global Surgical Visualization System Market |
|||
|
Base Year: |
2024 |
Forecast Period: |
2025-2032 |
|
Historical Data: |
2018 to 2023 |
Market Size in 2024: |
USD 2.8 Bn. |
|
Forecast Period 2024-32 CAGR: |
9.30 % |
Market Size in 2032: |
USD 5.71 Bn. |
|
Segments Covered: |
By Type |
|
|
|
By Application |
|
||
|
End-user |
|
||
|
By Region |
|
||
|
Key Market Drivers: |
|
||
|
Key Market Restraints: |
|
||
|
Key Opportunities: |
|
||
|
Companies Covered in the report: |
|
||


