


Small Scale LNG Market Synopsis:
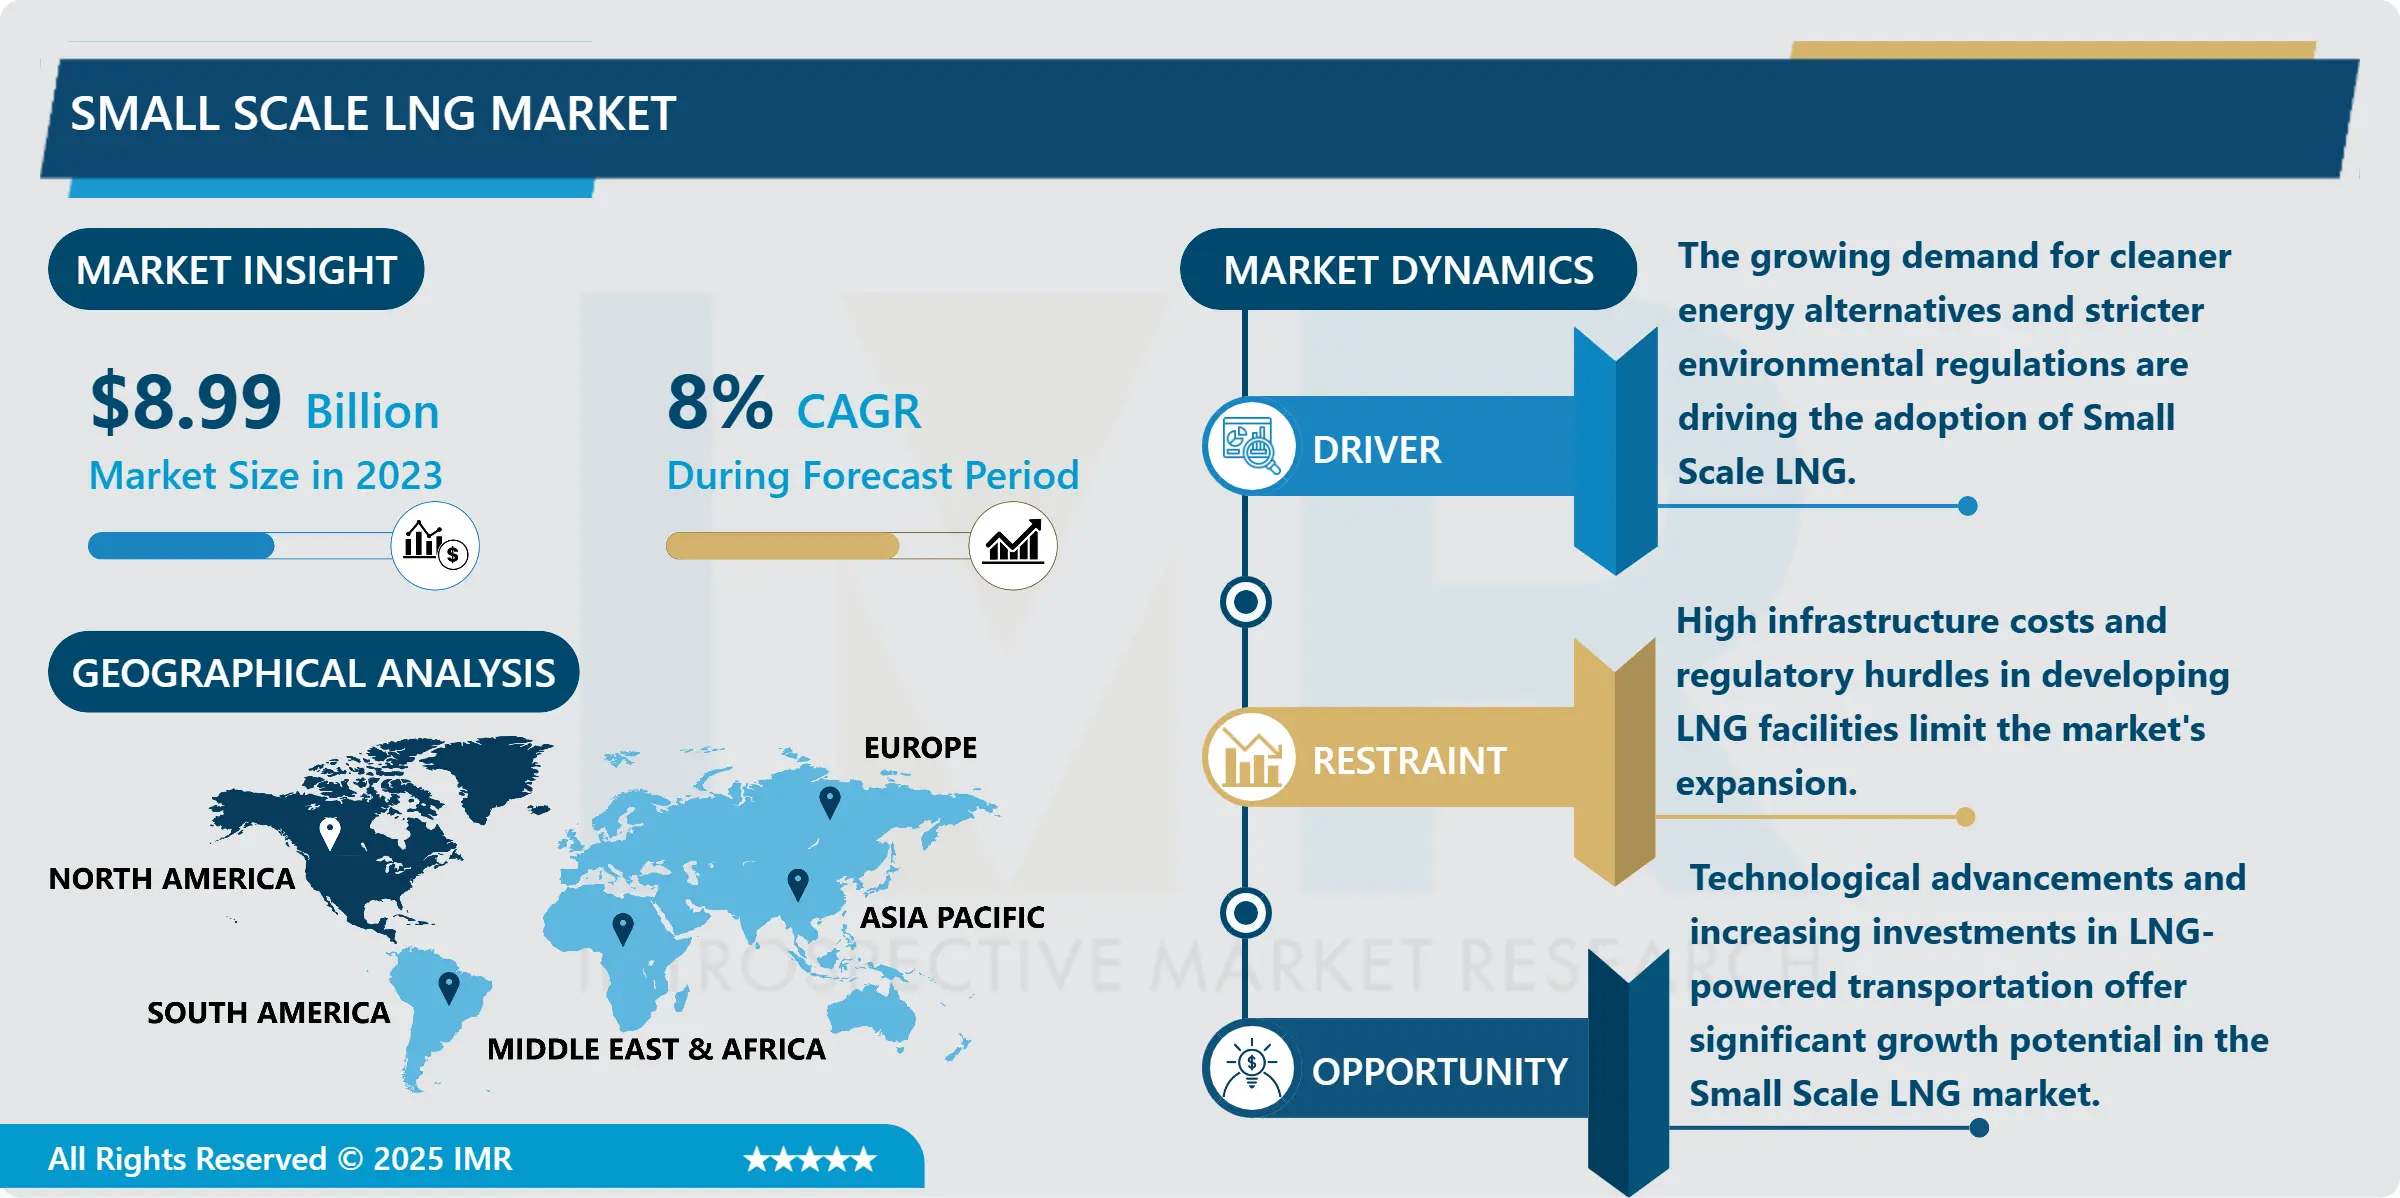
Small Scale LNG Market Size Was Valued at USD 8.99 Billion in 2023, and is Projected to Reach USD 16.59 Billion by 2032, Growing at a CAGR of 8% From 2024-2032.
The market area mainly focuses on the production, distribution, and utilization of small-small scale LNG projects that is Liquefied Natural Gas. It can be utilized in different industries, especially transportation, power production as well as in industries, primarily because it is a slim-line, flexible and cheaper source of energy. Decentralized LNG infrastructure comprises portable LNG production units, storage installations and distribution systems for implementing LNG in locations that are not central or in areas not accessible by pipeline systems. and it has got a great importance especially when it comes to emission of greenhouse gases by offering a better solution to some of the traditional products such as diesel and coal.
Some factors that shall encourage the growth Small-Scale LNG include; increasing concerns with environment, especially for regions where there are tight laws on pollution and the use of LNG in the transportation sector. Currently, there is adoption of LNG in ships, trucks and trains due to less carbon emission by LNG compared to other fuels. The decreased costs and lower capital investment per small scale LNG projects are ideal for countries and regions with tender energy demands.
Challenges affecting market include transport and infrastructure costs, policies as well as competition with renewable energy sources. Nevertheless, key limitations such as high cost of Small-Scale LNG production, slow development of regasification technologies particularly liquefaction and storage are the dampeners of Small-Scale LNG market in the future years, however, with technological improvements and rapid support by government in clean energy sector, it is anticipated that Small Scale LNG market may show a significant climbing in the forward-looking years.
Small Scale LNG Market Trend Analysis:
Growth in LNG-Powered Transportation
- Another innovative area of the small-scale LNG industry is the use of LNG as a fuel in transport. Due to new and tighter environmental standards and increasing awareness on emissions, LNG is being viewed as a cleaner fuel than diesel and even gasoline for uses in ships, trucks and trains. Especially, the shipping industry is interested in LNG as a fuel due to the regulatory drivers such as the Intergovernmental Maritime Organization (IMO) sulphur cap which restricts the sulphur content of marine fuel. The use of LNG as a fuel in the transportation industry is expected to create additional demand for small-scale liquefaction plants and LNG bunkering stations globally where mega scale LNG infrastructure is unlikely to be available.
Expansion of Off-Grid Power Solutions
- The use of Small-Scale LNG as a source of off-grid power is expanding quickly, especially in isolated and remote locations, including industrial hubs, islands, and areas with no access to national grid electricity. Small-scale LNG provides a clean and affordable alternative to diesel generators, which are both costly and environmentally degrading. The application is most common in the developing world and areas of low exposure to conventional energy infrastructure. With its scalability and carbon emissions-reducing ability, small-scale LNG is becoming the go-to option for off-grid power generation, fueling the development of sustainable and efficient energy solutions in these areas.
Small Scale LNG Market Segment Analysis:
Small Scale LNG Market is Segmented on the basis of By Type, Mode of Supply, Storage tank Capacity, Application and Region.
By Type, Liquefaction Terminal segment is expected to dominate the market during the forecast period
- The discovered main infrastructures in Small-Scale LNG sector are the liquefaction terminals and the regasification terminals. Liquefaction terminals are storage facilities which professionally process natural gas in order to convert it into LNG which is easily transportable. These terminals are very important in the small-scale production of the LNG which creates the advantage of small-scale distribution to remote or off-grid facilities. Regasification terminals, in contrast, are infrastructures where LNG is vaporized for local power generation, industry or as vehicle fuel. Liquefaction terminals meant for exporting LNG to other countries, and regasification terminals that transport LNG too far off countries which don’t have pipeline networks are opening up constantly due to the rising demand of clean energy solutions. Such terminals are crucial for the development of small-scale LNG, especially in the developing and the remote regions.
By Application, Transportation segment expected to held the largest share
- Thus, the Small-Scale LNG platform finds usage across various industries, transportation, heavy vehicles, industries and power generation. LNG is adopted today as a Clean Fuel for usage in ships, trucks and trains in the transportation sector having been prompted by environmental issues in relation to emissions. Logistics and mining industries are also getting on with LNG to reduce fuel expenses and achieve less GHG emissions. Small scale LNG plants offer energy in manufacturing procedures while off grid and remote areas utilize LNG for power in view of its efficiency and friendly nature to the environment. Other uses are the uses of LNG in residential heating and in small scale energy supply to areas that are not connected to conventional energy networks.
Small Scale LNG Market Regional Insights:
Asia-Pacific dominates the small-scale liquefied natural gas (LNG) market
- The Small-Scale LNG market in the Asia-Pacific region due to its ever growing energy demand especially in the Asian countries, accepting approach to cleaner energy solutions and availability of liquefied natural gas for infrastructure. China, Japan and India apart from many countries of South East Asia are now heavily investing on small scale LNG facilities to support requirements for off-grid island and other similar requirements in their own country and in the world at large. Small-scale LNG is also stimulated by the large coastal area possessed by the region and the rising application of LNG as a ship fuel. Further, government policies to curbing emission and shift toward cleaner energy sources are offering impetus to LNG across industries in Asia-Pacific, thus establishing its leadership.
Active Key Players in the Small-Scale LNG Market:
- Cryostar (U.S.)
- Engie (France)
- Engie (France)
- Excelerate Energy L.P (U.S)
- Gasum Ltd., (Norway)
- Gazprom (Russia)
- General Electric (U.S.)
- Hanjin Heavy Industries & Construction Holdings Co., Ltd. (South Korea)
- Honeywell International Inc. (U.S.)
- Hyundai Heavy Industries Co., Ltd., (South Korea)
- IHI Corporation (Japan)
- Kawasaki Heavy Industries, Ltd., (Japan)
- Linde plc (Germany)
- Mitsui O.S.K.Lines (Japan)
- Novatek (Russia)
- NYK Line (Japan)
- Prometheus Fuels (U.S)
- Teekay Corporation (Bermuda)
- Wärtsilä (Finland)
- Other Active Players
|
Small-Scale LNG Market |
|||
|
Base Year: |
2023 |
Forecast Period: |
2024-2032 |
|
Historical Data: |
2017 to 2023 |
Market Size in 2023: |
USD 8.99 Billion |
|
Forecast Period 2024-32 CAGR: |
8% |
Market Size in 2032: |
USD 16.59 Billion |
|
Segments Covered: |
By Type |
|
|
|
By Mode of Supply |
|
||
|
By Storage tank Capacity |
|
||
|
By Application |
|
||
|
By Region |
|
||
|
Key Market Drivers: |
|
||
|
Key Market Restraints: |
|
||
|
Key Opportunities: |
|
||
|
Companies Covered in the report: |
|
||
Chapter 1: Introduction
1.1 Scope and Coverage
Chapter 2:Executive Summary
Chapter 3: Market Landscape
3.1 Market Dynamics
3.1.1 Drivers
3.1.2 Restraints
3.1.3 Opportunities
3.1.4 Challenges
3.2 Market Trend Analysis
3.3 PESTLE Analysis
3.4 Porter's Five Forces Analysis
3.5 Industry Value Chain Analysis
3.6 Ecosystem
3.7 Regulatory Landscape
3.8 Price Trend Analysis
3.9 Patent Analysis
3.10 Technology Evolution
3.11 Investment Pockets
3.12 Import-Export Analysis
Chapter 4: Small Scale LNG Market by Type
4.1 Small Scale LNG Market Snapshot and Growth Engine
4.2 Small Scale LNG Market Overview
4.3 Liquefaction Terminal
4.3.1 Introduction and Market Overview
4.3.2 Historic and Forecasted Market Size in Value USD and Volume Units (2017-2032F)
4.3.3 Key Market Trends, Growth Factors and Opportunities
4.3.4 Liquefaction Terminal: Geographic Segmentation Analysis
4.4 Regasification Terminal
4.4.1 Introduction and Market Overview
4.4.2 Historic and Forecasted Market Size in Value USD and Volume Units (2017-2032F)
4.4.3 Key Market Trends, Growth Factors and Opportunities
4.4.4 Regasification Terminal: Geographic Segmentation Analysis
Chapter 5: Small Scale LNG Market by Mode of Supply
5.1 Small Scale LNG Market Snapshot and Growth Engine
5.2 Small Scale LNG Market Overview
5.3 Trucks
5.3.1 Introduction and Market Overview
5.3.2 Historic and Forecasted Market Size in Value USD and Volume Units (2017-2032F)
5.3.3 Key Market Trends, Growth Factors and Opportunities
5.3.4 Trucks: Geographic Segmentation Analysis
5.4 Shipment and Bunkering
5.4.1 Introduction and Market Overview
5.4.2 Historic and Forecasted Market Size in Value USD and Volume Units (2017-2032F)
5.4.3 Key Market Trends, Growth Factors and Opportunities
5.4.4 Shipment and Bunkering: Geographic Segmentation Analysis
5.5 Rail Tanks
5.5.1 Introduction and Market Overview
5.5.2 Historic and Forecasted Market Size in Value USD and Volume Units (2017-2032F)
5.5.3 Key Market Trends, Growth Factors and Opportunities
5.5.4 Rail Tanks: Geographic Segmentation Analysis
5.6 Pipeline
5.6.1 Introduction and Market Overview
5.6.2 Historic and Forecasted Market Size in Value USD and Volume Units (2017-2032F)
5.6.3 Key Market Trends, Growth Factors and Opportunities
5.6.4 Pipeline: Geographic Segmentation Analysis
5.7 Others
5.7.1 Introduction and Market Overview
5.7.2 Historic and Forecasted Market Size in Value USD and Volume Units (2017-2032F)
5.7.3 Key Market Trends, Growth Factors and Opportunities
5.7.4 Others: Geographic Segmentation Analysis
Chapter 6: Small Scale LNG Market by Storage tank Capacity
6.1 Small Scale LNG Market Snapshot and Growth Engine
6.2 Small Scale LNG Market Overview
6.3 Atmospheric
6.3.1 Introduction and Market Overview
6.3.2 Historic and Forecasted Market Size in Value USD and Volume Units (2017-2032F)
6.3.3 Key Market Trends, Growth Factors and Opportunities
6.3.4 Atmospheric: Geographic Segmentation Analysis
6.4 Pressurized and Floating Storage
6.4.1 Introduction and Market Overview
6.4.2 Historic and Forecasted Market Size in Value USD and Volume Units (2017-2032F)
6.4.3 Key Market Trends, Growth Factors and Opportunities
6.4.4 Pressurized and Floating Storage : Geographic Segmentation Analysis
Chapter 7: Small Scale LNG Market by Application
7.1 Small Scale LNG Market Snapshot and Growth Engine
7.2 Small Scale LNG Market Overview
7.3 Transportation
7.3.1 Introduction and Market Overview
7.3.2 Historic and Forecasted Market Size in Value USD and Volume Units (2017-2032F)
7.3.3 Key Market Trends, Growth Factors and Opportunities
7.3.4 Transportation: Geographic Segmentation Analysis
7.4 Heavy-Duty Vehicles
7.4.1 Introduction and Market Overview
7.4.2 Historic and Forecasted Market Size in Value USD and Volume Units (2017-2032F)
7.4.3 Key Market Trends, Growth Factors and Opportunities
7.4.4 Heavy-Duty Vehicles: Geographic Segmentation Analysis
7.5 Industrial and Power
7.5.1 Introduction and Market Overview
7.5.2 Historic and Forecasted Market Size in Value USD and Volume Units (2017-2032F)
7.5.3 Key Market Trends, Growth Factors and Opportunities
7.5.4 Industrial and Power: Geographic Segmentation Analysis
7.6 Others)
7.6.1 Introduction and Market Overview
7.6.2 Historic and Forecasted Market Size in Value USD and Volume Units (2017-2032F)
7.6.3 Key Market Trends, Growth Factors and Opportunities
7.6.4 Others) : Geographic Segmentation Analysis
Chapter 8: Company Profiles and Competitive Analysis
8.1 Competitive Landscape
8.1.1 Competitive Benchmarking
8.1.2 Small Scale LNG Market Share by Manufacturer (2023)
8.1.3 Industry BCG Matrix
8.1.4 Heat Map Analysis
8.1.5 Mergers and Acquisitions
8.2 GAZPROM (RUSSIA)
8.2.1 Company Overview
8.2.2 Key Executives
8.2.3 Company Snapshot
8.2.4 Role of the Company in the Market
8.2.5 Sustainability and Social Responsibility
8.2.6 Operating Business Segments
8.2.7 Product Portfolio
8.2.8 Business Performance
8.2.9 Key Strategic Moves and Recent Developments
8.2.10 SWOT Analysis
8.3 ENGIE (FRANCE)
8.4 HONEYWELL INTERNATIONAL INC. (U.S.)
8.5 WÄRTSILÄ (FINLAND)
8.6 LINDE PLC (GERMANY)
8.7 GASUM LTD. (NORWAY)
8.8 IHI CORPORATION (JAPAN)
8.9 EXCELERATE ENERGY L.P (U.S.)
8.10 PROMETHEUS FUELS (U.S.)
8.11 CRYOSTAR (U.S.)
8.12 GENERAL ELECTRIC (U.S.)
8.13 NOVATEK (RUSSIA)
8.14 NYK LINE (JAPAN)
8.15 MITSUI O.S.K. LINES (JAPAN)
8.16 TEEKAY CORPORATION (BERMUDA)
8.17 HYUNDAI HEAVY INDUSTRIES CO. LTD. (SOUTH KOREA)
8.18 HANJIN HEAVY INDUSTRIES & CONSTRUCTION HOLDINGS CO. LTD. (SOUTH KOREA)
8.19 KAWASAKI HEAVY INDUSTRIES
8.20 LTD. (JAPAN)
8.21 OTHER ACTIVE PLAYERS
Chapter 9: Global Small Scale LNG Market By Region
9.1 Overview
9.2. North America Small Scale LNG Market
9.2.1 Key Market Trends, Growth Factors and Opportunities
9.2.2 Top Key Companies
9.2.3 Historic and Forecasted Market Size by Segments
9.2.4 Historic and Forecasted Market Size By Type
9.2.4.1 Liquefaction Terminal
9.2.4.2 Regasification Terminal
9.2.5 Historic and Forecasted Market Size By Mode of Supply
9.2.5.1 Trucks
9.2.5.2 Shipment and Bunkering
9.2.5.3 Rail Tanks
9.2.5.4 Pipeline
9.2.5.5 Others
9.2.6 Historic and Forecasted Market Size By Storage tank Capacity
9.2.6.1 Atmospheric
9.2.6.2 Pressurized and Floating Storage
9.2.7 Historic and Forecasted Market Size By Application
9.2.7.1 Transportation
9.2.7.2 Heavy-Duty Vehicles
9.2.7.3 Industrial and Power
9.2.7.4 Others)
9.2.8 Historic and Forecast Market Size by Country
9.2.8.1 US
9.2.8.2 Canada
9.2.8.3 Mexico
9.3. Eastern Europe Small Scale LNG Market
9.3.1 Key Market Trends, Growth Factors and Opportunities
9.3.2 Top Key Companies
9.3.3 Historic and Forecasted Market Size by Segments
9.3.4 Historic and Forecasted Market Size By Type
9.3.4.1 Liquefaction Terminal
9.3.4.2 Regasification Terminal
9.3.5 Historic and Forecasted Market Size By Mode of Supply
9.3.5.1 Trucks
9.3.5.2 Shipment and Bunkering
9.3.5.3 Rail Tanks
9.3.5.4 Pipeline
9.3.5.5 Others
9.3.6 Historic and Forecasted Market Size By Storage tank Capacity
9.3.6.1 Atmospheric
9.3.6.2 Pressurized and Floating Storage
9.3.7 Historic and Forecasted Market Size By Application
9.3.7.1 Transportation
9.3.7.2 Heavy-Duty Vehicles
9.3.7.3 Industrial and Power
9.3.7.4 Others)
9.3.8 Historic and Forecast Market Size by Country
9.3.8.1 Russia
9.3.8.2 Bulgaria
9.3.8.3 The Czech Republic
9.3.8.4 Hungary
9.3.8.5 Poland
9.3.8.6 Romania
9.3.8.7 Rest of Eastern Europe
9.4. Western Europe Small Scale LNG Market
9.4.1 Key Market Trends, Growth Factors and Opportunities
9.4.2 Top Key Companies
9.4.3 Historic and Forecasted Market Size by Segments
9.4.4 Historic and Forecasted Market Size By Type
9.4.4.1 Liquefaction Terminal
9.4.4.2 Regasification Terminal
9.4.5 Historic and Forecasted Market Size By Mode of Supply
9.4.5.1 Trucks
9.4.5.2 Shipment and Bunkering
9.4.5.3 Rail Tanks
9.4.5.4 Pipeline
9.4.5.5 Others
9.4.6 Historic and Forecasted Market Size By Storage tank Capacity
9.4.6.1 Atmospheric
9.4.6.2 Pressurized and Floating Storage
9.4.7 Historic and Forecasted Market Size By Application
9.4.7.1 Transportation
9.4.7.2 Heavy-Duty Vehicles
9.4.7.3 Industrial and Power
9.4.7.4 Others)
9.4.8 Historic and Forecast Market Size by Country
9.4.8.1 Germany
9.4.8.2 UK
9.4.8.3 France
9.4.8.4 The Netherlands
9.4.8.5 Italy
9.4.8.6 Spain
9.4.8.7 Rest of Western Europe
9.5. Asia Pacific Small Scale LNG Market
9.5.1 Key Market Trends, Growth Factors and Opportunities
9.5.2 Top Key Companies
9.5.3 Historic and Forecasted Market Size by Segments
9.5.4 Historic and Forecasted Market Size By Type
9.5.4.1 Liquefaction Terminal
9.5.4.2 Regasification Terminal
9.5.5 Historic and Forecasted Market Size By Mode of Supply
9.5.5.1 Trucks
9.5.5.2 Shipment and Bunkering
9.5.5.3 Rail Tanks
9.5.5.4 Pipeline
9.5.5.5 Others
9.5.6 Historic and Forecasted Market Size By Storage tank Capacity
9.5.6.1 Atmospheric
9.5.6.2 Pressurized and Floating Storage
9.5.7 Historic and Forecasted Market Size By Application
9.5.7.1 Transportation
9.5.7.2 Heavy-Duty Vehicles
9.5.7.3 Industrial and Power
9.5.7.4 Others)
9.5.8 Historic and Forecast Market Size by Country
9.5.8.1 China
9.5.8.2 India
9.5.8.3 Japan
9.5.8.4 South Korea
9.5.8.5 Malaysia
9.5.8.6 Thailand
9.5.8.7 Vietnam
9.5.8.8 The Philippines
9.5.8.9 Australia
9.5.8.10 New Zealand
9.5.8.11 Rest of APAC
9.6. Middle East & Africa Small Scale LNG Market
9.6.1 Key Market Trends, Growth Factors and Opportunities
9.6.2 Top Key Companies
9.6.3 Historic and Forecasted Market Size by Segments
9.6.4 Historic and Forecasted Market Size By Type
9.6.4.1 Liquefaction Terminal
9.6.4.2 Regasification Terminal
9.6.5 Historic and Forecasted Market Size By Mode of Supply
9.6.5.1 Trucks
9.6.5.2 Shipment and Bunkering
9.6.5.3 Rail Tanks
9.6.5.4 Pipeline
9.6.5.5 Others
9.6.6 Historic and Forecasted Market Size By Storage tank Capacity
9.6.6.1 Atmospheric
9.6.6.2 Pressurized and Floating Storage
9.6.7 Historic and Forecasted Market Size By Application
9.6.7.1 Transportation
9.6.7.2 Heavy-Duty Vehicles
9.6.7.3 Industrial and Power
9.6.7.4 Others)
9.6.8 Historic and Forecast Market Size by Country
9.6.8.1 Turkiye
9.6.8.2 Bahrain
9.6.8.3 Kuwait
9.6.8.4 Saudi Arabia
9.6.8.5 Qatar
9.6.8.6 UAE
9.6.8.7 Israel
9.6.8.8 South Africa
9.7. South America Small Scale LNG Market
9.7.1 Key Market Trends, Growth Factors and Opportunities
9.7.2 Top Key Companies
9.7.3 Historic and Forecasted Market Size by Segments
9.7.4 Historic and Forecasted Market Size By Type
9.7.4.1 Liquefaction Terminal
9.7.4.2 Regasification Terminal
9.7.5 Historic and Forecasted Market Size By Mode of Supply
9.7.5.1 Trucks
9.7.5.2 Shipment and Bunkering
9.7.5.3 Rail Tanks
9.7.5.4 Pipeline
9.7.5.5 Others
9.7.6 Historic and Forecasted Market Size By Storage tank Capacity
9.7.6.1 Atmospheric
9.7.6.2 Pressurized and Floating Storage
9.7.7 Historic and Forecasted Market Size By Application
9.7.7.1 Transportation
9.7.7.2 Heavy-Duty Vehicles
9.7.7.3 Industrial and Power
9.7.7.4 Others)
9.7.8 Historic and Forecast Market Size by Country
9.7.8.1 Brazil
9.7.8.2 Argentina
9.7.8.3 Rest of SA
Chapter 10 Analyst Viewpoint and Conclusion
10.1 Recommendations and Concluding Analysis
10.2 Potential Market Strategies
Chapter 11 Research Methodology
11.1 Research Process
11.2 Primary Research
11.3 Secondary Research
|
Small-Scale LNG Market |
|||
|
Base Year: |
2023 |
Forecast Period: |
2024-2032 |
|
Historical Data: |
2017 to 2023 |
Market Size in 2023: |
USD 8.99 Billion |
|
Forecast Period 2024-32 CAGR: |
8% |
Market Size in 2032: |
USD 16.59 Billion |
|
Segments Covered: |
By Type |
|
|
|
By Mode of Supply |
|
||
|
By Storage tank Capacity |
|
||
|
By Application |
|
||
|
By Region |
|
||
|
Key Market Drivers: |
|
||
|
Key Market Restraints: |
|
||
|
Key Opportunities: |
|
||
|
Companies Covered in the report: |
|
||


