


Ship Anchor Chain Market Synopsis
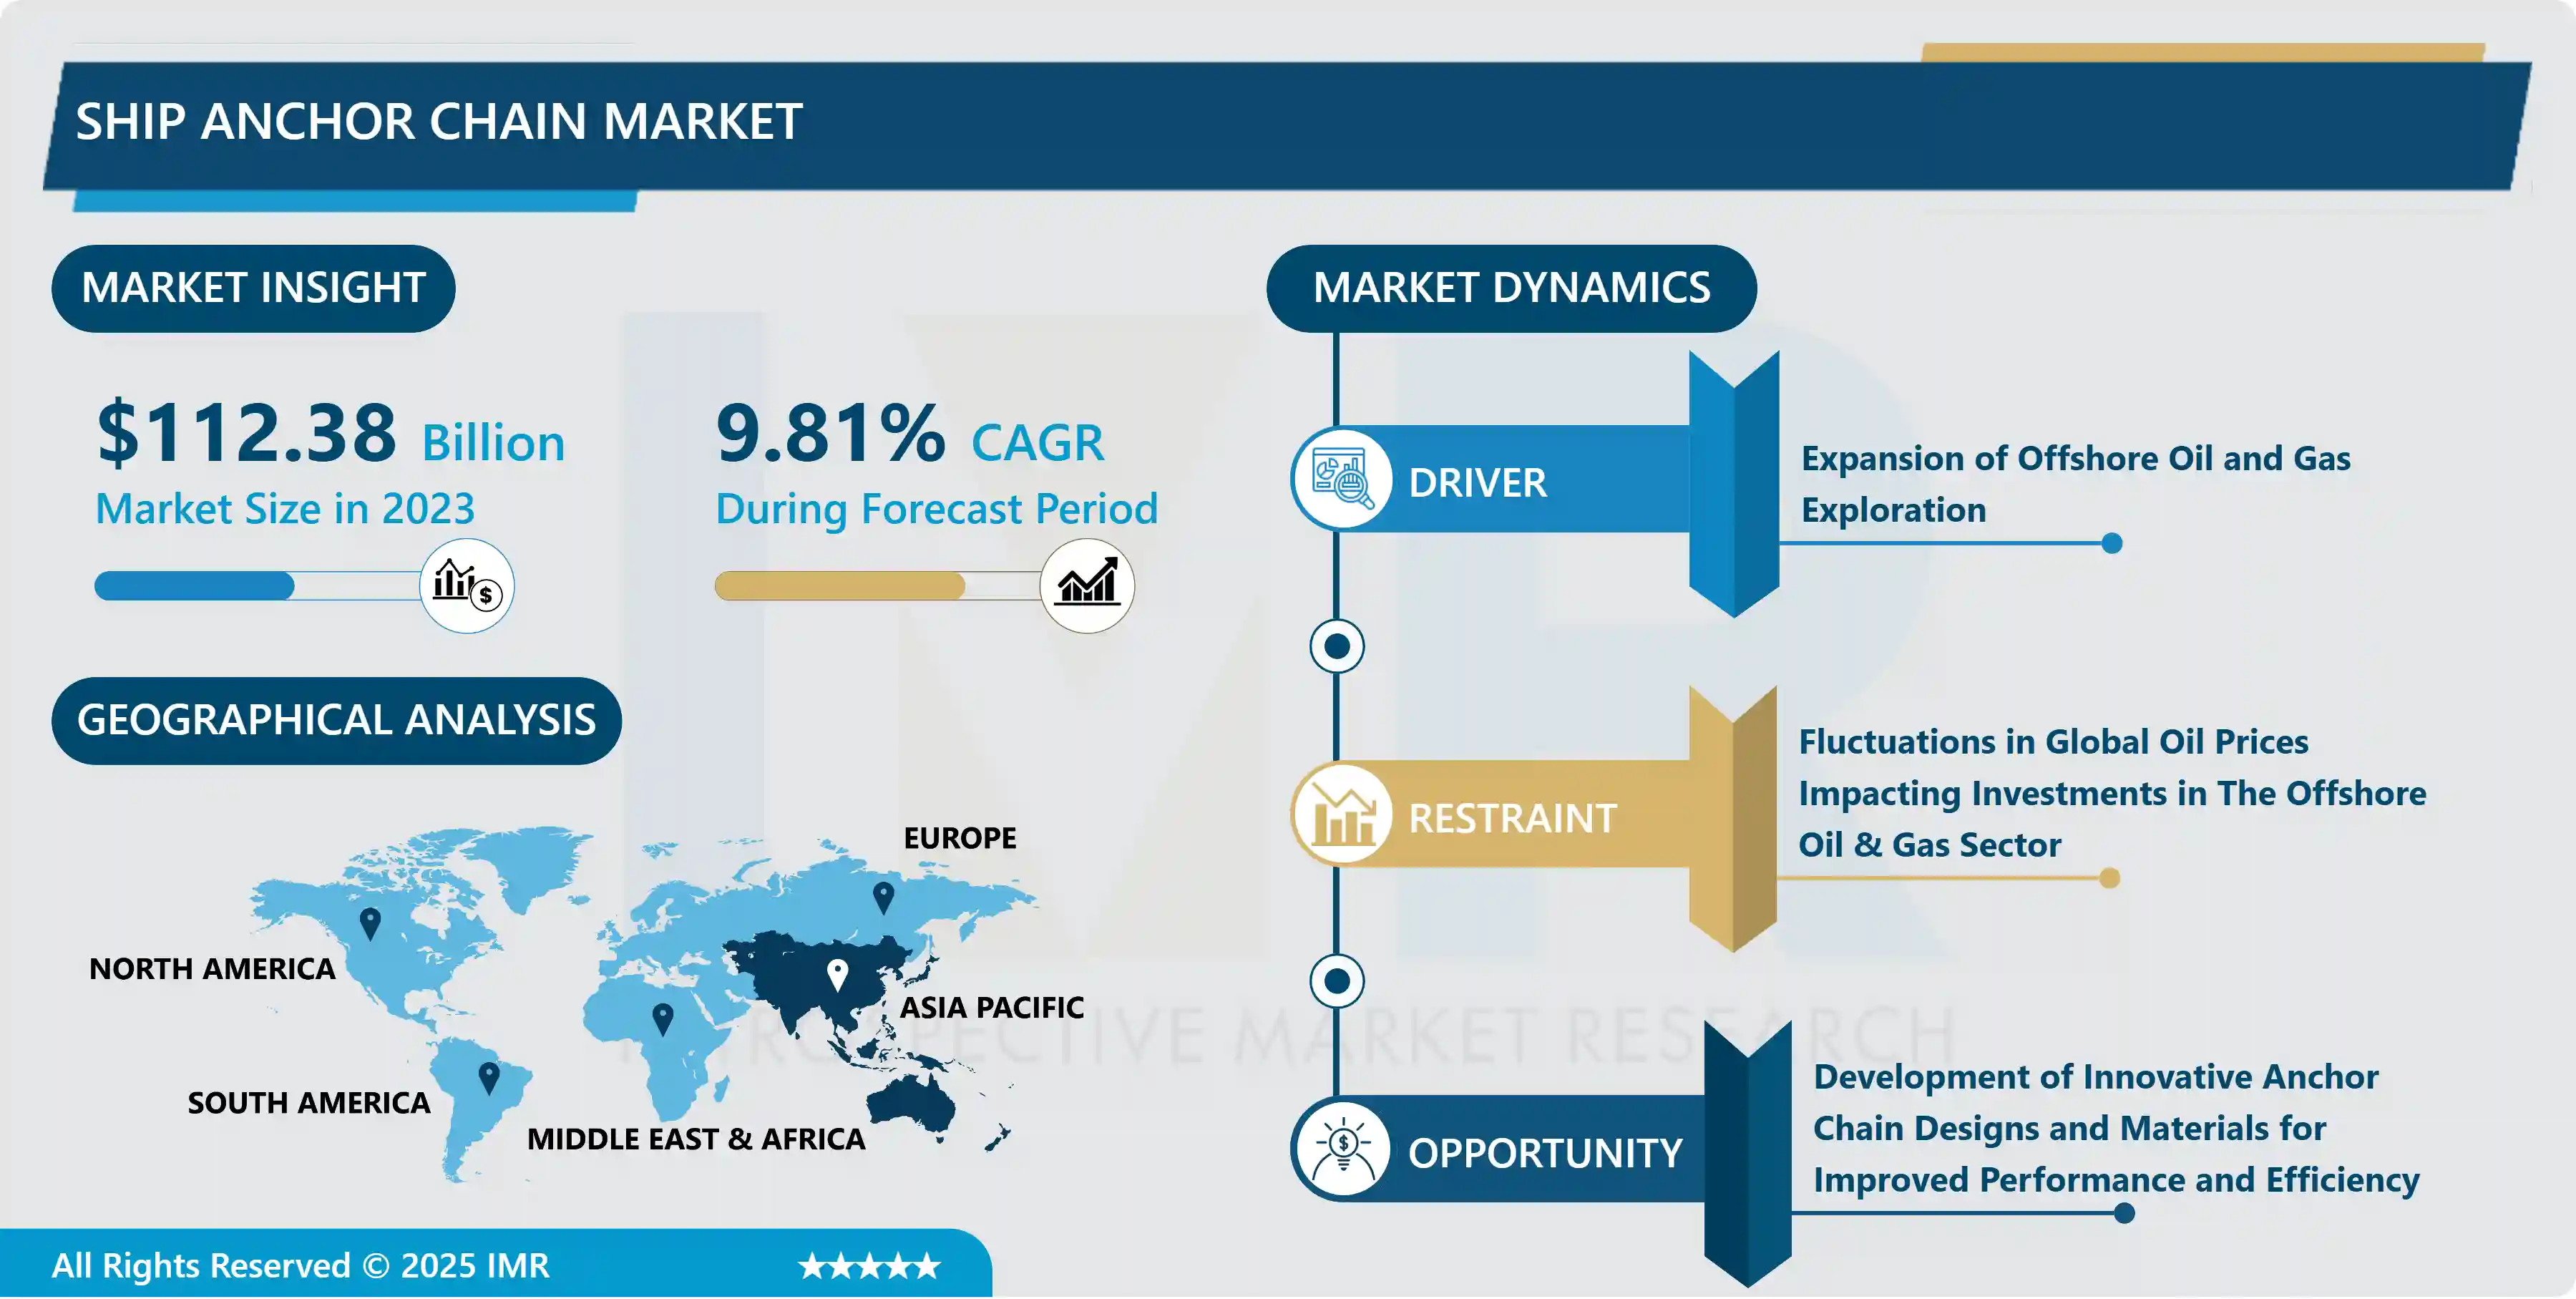
The global Ship Anchor Chain Market Size Was Valued at USD 112.38 Billion in 2023 and is Projected to Reach USD 260.9 Billion by 2032, Growing at a CAGR of 9.81% From 2024-2032.
A ship anchor chain is a critical component of maritime equipment used for anchoring vessels securely in place. Comprised of interconnected links made from durable materials such as steel, it provides the necessary strength and stability to withstand the forces exerted by wind, waves, and currents, ensuring the vessel remains safely anchored during stationary periods at sea.
The ship anchor chain plays a pivotal role in maritime operations, primarily serving as a crucial component for anchoring vessels securely in various maritime environments. Its application extends across a wide range of maritime activities, including commercial shipping, offshore oil and gas exploration, maritime transportation, and naval operations. By providing a robust and reliable means of anchoring, the anchor chain ensures the safety and stability of vessels during stationary periods, whether at sea or in port.
its exceptional strength and durability, which are essential for withstanding the harsh conditions encountered at sea. Made from high-quality materials such as steel, the anchor chain exhibits superior resistance to corrosion, abrasion, and mechanical stress, ensuring reliable performance even in challenging maritime environments. Additionally, the design of the anchor chain facilitates efficient deployment and retrieval, allowing for quick and effective anchoring operations, thereby enhancing operational efficiency and safety for maritime vessels.
As global trade continues to expand, the demand for maritime transportation services is projected to increase, leading to a higher demand for ships equipped with reliable anchoring systems. Furthermore, the growing offshore oil and gas exploration activities, coupled with the expansion of maritime infrastructure projects, are expected to fuel the demand for anchor chains in the offshore industry. Additionally, advancements in anchor chain technology, such as the development of lightweight yet high-strength materials and innovative anchoring systems, are likely to further drive market growth by offering enhanced performance and operational capabilities to maritime operators.

Ship Anchor Chain Market Trend Analysis:
Expansion of Offshore Oil and Gas Exploration
- The expansion of offshore oil and gas exploration serves as a significant driver for the growth of the ship anchor chain market. As the global energy demand continues to rise, there is a growing emphasis on tapping into offshore oil and gas reserves to meet this demand. Offshore drilling operations require reliable anchoring systems to secure drilling rigs, production platforms, and support vessels in place, especially in deepwater and harsh marine environments.
- Ship anchor chains play a critical role in offshore oil and gas exploration by providing the necessary stability and security for anchoring offshore structures. These anchor chains are designed to withstand the extreme forces exerted by waves, currents, and winds, ensuring the safety and stability of offshore installations during drilling, production, and maintenance activities. Additionally, anchor chains are essential for mooring vessels and equipment, facilitating safe and efficient operations in offshore oil and gas fields.
- Furthermore, as offshore exploration activities expand into deeper waters and more remote locations, the demand for advanced anchor chain solutions is expected to grow. Manufacturers are investing in research and development to innovate anchor chain designs, materials, and technologies to meet the evolving needs of the offshore oil and gas industry. With the increasing focus on safety, reliability, and efficiency in offshore operations, the ship anchor chain market is poised to experience significant growth driven by the expansion of offshore oil and gas exploration activities.
Development of Innovative Anchor Chain Designs and Materials for Improved Performance and Efficiency
- The development of innovative anchor chain designs and materials presents a significant opportunity for driving the growth of the ship anchor chain market. As maritime operations evolve and technological advancements continue to reshape the industry, there is a growing demand for anchor chains that offer improved performance, durability, and efficiency. Manufacturers are increasingly focusing on research and development to innovate anchor chain designs and materials, leveraging advanced engineering principles and cutting-edge materials science to meet the evolving needs of the maritime sector.
- Innovative anchor chain designs aim to enhance the performance and functionality of anchor chains, addressing challenges such as weight reduction, increased strength-to-weight ratio, and improved corrosion resistance. By incorporating features such as optimized link geometry, advanced welding techniques, and innovative coating technologies, manufacturers can develop anchor chains that offer superior performance and durability in various marine environments. These innovations not only enhance the operational efficiency of anchor chains but also contribute to the overall safety and reliability of maritime operations.
- Moreover, the development of novel materials for anchor chain construction opens up new possibilities for improving the performance and efficiency of anchor chains. Advanced materials such as high-strength steel alloys, composite materials, and corrosion-resistant coatings offer enhanced mechanical properties, durability, and longevity compared to traditional materials. By harnessing the potential of these innovative materials, manufacturers can produce anchor chains that are lighter, stronger, and more resistant to corrosion, thereby extending service life and reducing maintenance requirements. As maritime operators seek anchor chains that offer superior performance, durability, and efficiency, the development of innovative anchor chain designs and materials presents a compelling opportunity for growth in the ship anchor chain market.
Ship Anchor Chain Market Segment Analysis:
Ship Anchor Chain Market Segmented on the basis of Type, Size, Material, and Application
By Type, Stud Link Anchor Chain segment is expected to dominate the market during the forecast period
- The Stud Link Anchor Chain segment is poised to lead the growth of the Ship Anchor Chain Market. Stud Link Anchor Chains are widely used in various maritime applications due to their robustness, reliability, and ease of use. These anchor chains feature stud links that are connected by shackles, providing a strong and secure connection that is well-suited for anchoring vessels and offshore structures in demanding marine environments.
- Moreover, the Stud Link Anchor Chain segment is favored for its versatility and adaptability to different vessel types and operating conditions. Whether used for mooring large ships, securing offshore platforms, or anchoring floating structures, Stud Link Anchor Chains offer exceptional strength and stability. As maritime industries continue to expand and modernize, the demand for reliable and efficient anchoring solutions is expected to increase, further driving the growth of the Stud Link Anchor Chain segment in the Ship Anchor Chain Market.
By Distribution Channel, 3,500 - 10,000 segment held the largest share of 63.34% in 2022
- The 3,500 - 10,000 segment commands the largest share in propelling the growth of the Ship Anchor Chain Market. Anchor chains within this size range are extensively utilized across a wide range of maritime applications, including medium-sized vessels, offshore platforms, and marine infrastructure projects. This segment caters to the diverse needs of the maritime industry, providing anchor chains that offer a balance between strength, durability, and cost-effectiveness.
- Moreover, the 3,500 - 10,000 segment is favored for its versatility and suitability for various vessel sizes and operating conditions. Whether deployed for anchoring cargo ships, offshore support vessels, or drilling rigs, anchor chains within this size range provide reliable and robust anchoring solutions. As maritime activities continue to expand globally, particularly in sectors such as offshore oil and gas exploration, renewable energy, and maritime transportation, the demand for anchor chains in the 3,500 - 10,000 size segment is expected to remain strong, further driving its dominance in the Ship Anchor Chain Market.
Ship Anchor Chain Market Regional Insights:
Asia Pacific is Expected to Dominate the Market Over the Forecast period
- Asia Pacific is anticipated to emerge as the dominant region driving the growth of the Ship Anchor Chain market. The region's thriving maritime industry, fueled by increasing trade activities, port developments, and offshore exploration projects, is expected to boost the demand for ship anchor chains. Countries like China, South Korea, Japan, and India are major players in shipbuilding and maritime infrastructure development, driving the need for anchor chains in the region.
- Furthermore, the Asia Pacific region's strategic location along key shipping routes and its growing importance in global trade make it a crucial market for ship anchor chains. With increasing investments in marine transportation infrastructure and offshore developments, the demand for anchor chains is expected to witness significant growth in the coming years. Additionally, the expansion of offshore oil and gas exploration activities and the development of renewable energy projects, such as offshore wind farms, further contribute to the region's dominance in the Ship Anchor Chain market.
Ship Anchor Chain Market Top Key Players:
- FenderCare (U.S.)
- DCL Mooring and Rigging (U.S.)
- Vicinay Marinen (Spain)
- Posidonia S.r.l. (Italy)
- Sotra Marine Produkter (Norway)
- Wortelboer (Netherlands)
- Schmeding Scandinavia Ltd (Denmark)
- Damen Shipyards Group (Netherlands)
- D. Koronakis S.A. (Greece)
- Hamanaka Chain Mfg (Japan)
- Dai Han Anchor Chain (South Korea)
- Ramnas (South Korea)
- Laiwu Steel Group Zibo Anchor Chain Co., Ltd. (China)
- Qingdao Wancheng Anchor Chain (China)
- Fountom Marine (China)
- Wuhan Jiangnan Anchor Chain (China)
- Jiangsu Aohai Marine Fittings (China), and Other Major Players
Key Industry Developments in the Ship Anchor Chain Market:
- In May 2024, Damen Shipyards Group launched a pilot project exploring circular ship dismantling and recycling, aiming to become the most sustainable shipbuilder. A tugboat named Jan will be dismantled at Damen Ship Repair Rotterdam using a certified specialist. The project will provide transparency and meet EU standards, with plans for commercialization and financing in the future.
- In October 2022, James Fisher and Sons plc further increased its presence in the Middle East through a partnership between Fendercare Marine Middle East LLC and Saudi Arabia-based Intelligent Energy Services Co. Ltd, (i-Energy), facilitating the supply of high-quality marine products to Saudi customers.
|
Global Ship Anchor Chain Market |
|||
|
Base Year: |
2023 |
Forecast Period: |
2024-2032 |
|
Historical Data: |
2017 to 2023 |
Market Size in 2023: |
USD 112.38 Bn. |
|
Forecast Period 2024-32 CAGR: |
9.81% |
Market Size in 2032: |
USD 260.9 Bn. |
|
Segments Covered: |
By Type |
|
|
|
By Size |
|
||
|
By Material |
|
||
|
By Application |
|
||
|
By Region |
|
||
|
Key Market Drivers: |
|
||
|
Key Market Restraints: |
|
||
|
Key Opportunities: |
|
||
|
Companies Covered in the report: |
|
||
Chapter 1: Introduction
1.1 Scope and Coverage
Chapter 2:Executive Summary
Chapter 3: Market Landscape
3.1 Market Dynamics
3.1.1 Drivers
3.1.2 Restraints
3.1.3 Opportunities
3.1.4 Challenges
3.2 Market Trend Analysis
3.3 PESTLE Analysis
3.4 Porter's Five Forces Analysis
3.5 Industry Value Chain Analysis
3.6 Ecosystem
3.7 Regulatory Landscape
3.8 Price Trend Analysis
3.9 Patent Analysis
3.10 Technology Evolution
3.11 Investment Pockets
3.12 Import-Export Analysis
Chapter 4: Ship Anchor Chain Market by Type (2018-2032)
4.1 Ship Anchor Chain Market Snapshot and Growth Engine
4.2 Market Overview
4.3 Stud Link Anchor Chain
4.3.1 Introduction and Market Overview
4.3.2 Historic and Forecasted Market Size in Value USD and Volume Units
4.3.3 Key Market Trends, Growth Factors, and Opportunities
4.3.4 Geographic Segmentation Analysis
4.4 Studless Anchor Chain
Chapter 5: Ship Anchor Chain Market by Size (2018-2032)
5.1 Ship Anchor Chain Market Snapshot and Growth Engine
5.2 Market Overview
5.3 Up to 3
5.3.1 Introduction and Market Overview
5.3.2 Historic and Forecasted Market Size in Value USD and Volume Units
5.3.3 Key Market Trends, Growth Factors, and Opportunities
5.3.4 Geographic Segmentation Analysis
5.4 500 lbs
5.5 3
5.6 500 - 10
5.7 000 lbs
5.8 Above 10
5.9 000 lbs
Chapter 6: Ship Anchor Chain Market by Material (2018-2032)
6.1 Ship Anchor Chain Market Snapshot and Growth Engine
6.2 Market Overview
6.3 Steel
6.3.1 Introduction and Market Overview
6.3.2 Historic and Forecasted Market Size in Value USD and Volume Units
6.3.3 Key Market Trends, Growth Factors, and Opportunities
6.3.4 Geographic Segmentation Analysis
6.4 Stainless Steel
Chapter 7: Ship Anchor Chain Market by Application (2018-2032)
7.1 Ship Anchor Chain Market Snapshot and Growth Engine
7.2 Market Overview
7.3 Merchant Vessels
7.3.1 Introduction and Market Overview
7.3.2 Historic and Forecasted Market Size in Value USD and Volume Units
7.3.3 Key Market Trends, Growth Factors, and Opportunities
7.3.4 Geographic Segmentation Analysis
7.4 Offshore Support Vessels
7.5 Naval Vessels
Chapter 8: Company Profiles and Competitive Analysis
8.1 Competitive Landscape
8.1.1 Competitive Benchmarking
8.1.2 Ship Anchor Chain Market Share by Manufacturer (2024)
8.1.3 Industry BCG Matrix
8.1.4 Heat Map Analysis
8.1.5 Mergers and Acquisitions
8.2 ACS MATERIAL LLC (U.S.)
8.2.1 Company Overview
8.2.2 Key Executives
8.2.3 Company Snapshot
8.2.4 Role of the Company in the Market
8.2.5 Sustainability and Social Responsibility
8.2.6 Operating Business Segments
8.2.7 Product Portfolio
8.2.8 Business Performance
8.2.9 Key Strategic Moves and Recent Developments
8.2.10 SWOT Analysis
8.3 SIGMA-ALDRICH (U.S.)
8.4 NOAH CHEMICALS (U.S.)
8.5 AMERICAN ELEMENTS (U.S.)
8.6 MERCK KGAA (GERMANY)
8.7 FUZHOU TOPDA NEW MATERIAL COLTD. (CHINA)
8.8 SHANDONG ZHONGSHAN PHOTOELECTRIC MATERIALS COLTD (CHINA)
8.9 HUBEI ZHUOXI FLUOROCHEMICAL (CHINA)
8.10 NANJING XFNANO MATERIALS (CHINA)
8.11 DAIKIN INDUSTRIES (JAPAN)
8.12 CENTRAL GLASS COLTD. (JAPAN)
8.13 KANTO CHEMICAL COINC. (JAPAN)
8.14
Chapter 9: Global Ship Anchor Chain Market By Region
9.1 Overview
9.2. North America Ship Anchor Chain Market
9.2.1 Key Market Trends, Growth Factors and Opportunities
9.2.2 Top Key Companies
9.2.3 Historic and Forecasted Market Size by Segments
9.2.4 Historic and Forecasted Market Size by Type
9.2.4.1 Stud Link Anchor Chain
9.2.4.2 Studless Anchor Chain
9.2.5 Historic and Forecasted Market Size by Size
9.2.5.1 Up to 3
9.2.5.2 500 lbs
9.2.5.3 3
9.2.5.4 500 - 10
9.2.5.5 000 lbs
9.2.5.6 Above 10
9.2.5.7 000 lbs
9.2.6 Historic and Forecasted Market Size by Material
9.2.6.1 Steel
9.2.6.2 Stainless Steel
9.2.7 Historic and Forecasted Market Size by Application
9.2.7.1 Merchant Vessels
9.2.7.2 Offshore Support Vessels
9.2.7.3 Naval Vessels
9.2.8 Historic and Forecast Market Size by Country
9.2.8.1 US
9.2.8.2 Canada
9.2.8.3 Mexico
9.3. Eastern Europe Ship Anchor Chain Market
9.3.1 Key Market Trends, Growth Factors and Opportunities
9.3.2 Top Key Companies
9.3.3 Historic and Forecasted Market Size by Segments
9.3.4 Historic and Forecasted Market Size by Type
9.3.4.1 Stud Link Anchor Chain
9.3.4.2 Studless Anchor Chain
9.3.5 Historic and Forecasted Market Size by Size
9.3.5.1 Up to 3
9.3.5.2 500 lbs
9.3.5.3 3
9.3.5.4 500 - 10
9.3.5.5 000 lbs
9.3.5.6 Above 10
9.3.5.7 000 lbs
9.3.6 Historic and Forecasted Market Size by Material
9.3.6.1 Steel
9.3.6.2 Stainless Steel
9.3.7 Historic and Forecasted Market Size by Application
9.3.7.1 Merchant Vessels
9.3.7.2 Offshore Support Vessels
9.3.7.3 Naval Vessels
9.3.8 Historic and Forecast Market Size by Country
9.3.8.1 Russia
9.3.8.2 Bulgaria
9.3.8.3 The Czech Republic
9.3.8.4 Hungary
9.3.8.5 Poland
9.3.8.6 Romania
9.3.8.7 Rest of Eastern Europe
9.4. Western Europe Ship Anchor Chain Market
9.4.1 Key Market Trends, Growth Factors and Opportunities
9.4.2 Top Key Companies
9.4.3 Historic and Forecasted Market Size by Segments
9.4.4 Historic and Forecasted Market Size by Type
9.4.4.1 Stud Link Anchor Chain
9.4.4.2 Studless Anchor Chain
9.4.5 Historic and Forecasted Market Size by Size
9.4.5.1 Up to 3
9.4.5.2 500 lbs
9.4.5.3 3
9.4.5.4 500 - 10
9.4.5.5 000 lbs
9.4.5.6 Above 10
9.4.5.7 000 lbs
9.4.6 Historic and Forecasted Market Size by Material
9.4.6.1 Steel
9.4.6.2 Stainless Steel
9.4.7 Historic and Forecasted Market Size by Application
9.4.7.1 Merchant Vessels
9.4.7.2 Offshore Support Vessels
9.4.7.3 Naval Vessels
9.4.8 Historic and Forecast Market Size by Country
9.4.8.1 Germany
9.4.8.2 UK
9.4.8.3 France
9.4.8.4 The Netherlands
9.4.8.5 Italy
9.4.8.6 Spain
9.4.8.7 Rest of Western Europe
9.5. Asia Pacific Ship Anchor Chain Market
9.5.1 Key Market Trends, Growth Factors and Opportunities
9.5.2 Top Key Companies
9.5.3 Historic and Forecasted Market Size by Segments
9.5.4 Historic and Forecasted Market Size by Type
9.5.4.1 Stud Link Anchor Chain
9.5.4.2 Studless Anchor Chain
9.5.5 Historic and Forecasted Market Size by Size
9.5.5.1 Up to 3
9.5.5.2 500 lbs
9.5.5.3 3
9.5.5.4 500 - 10
9.5.5.5 000 lbs
9.5.5.6 Above 10
9.5.5.7 000 lbs
9.5.6 Historic and Forecasted Market Size by Material
9.5.6.1 Steel
9.5.6.2 Stainless Steel
9.5.7 Historic and Forecasted Market Size by Application
9.5.7.1 Merchant Vessels
9.5.7.2 Offshore Support Vessels
9.5.7.3 Naval Vessels
9.5.8 Historic and Forecast Market Size by Country
9.5.8.1 China
9.5.8.2 India
9.5.8.3 Japan
9.5.8.4 South Korea
9.5.8.5 Malaysia
9.5.8.6 Thailand
9.5.8.7 Vietnam
9.5.8.8 The Philippines
9.5.8.9 Australia
9.5.8.10 New Zealand
9.5.8.11 Rest of APAC
9.6. Middle East & Africa Ship Anchor Chain Market
9.6.1 Key Market Trends, Growth Factors and Opportunities
9.6.2 Top Key Companies
9.6.3 Historic and Forecasted Market Size by Segments
9.6.4 Historic and Forecasted Market Size by Type
9.6.4.1 Stud Link Anchor Chain
9.6.4.2 Studless Anchor Chain
9.6.5 Historic and Forecasted Market Size by Size
9.6.5.1 Up to 3
9.6.5.2 500 lbs
9.6.5.3 3
9.6.5.4 500 - 10
9.6.5.5 000 lbs
9.6.5.6 Above 10
9.6.5.7 000 lbs
9.6.6 Historic and Forecasted Market Size by Material
9.6.6.1 Steel
9.6.6.2 Stainless Steel
9.6.7 Historic and Forecasted Market Size by Application
9.6.7.1 Merchant Vessels
9.6.7.2 Offshore Support Vessels
9.6.7.3 Naval Vessels
9.6.8 Historic and Forecast Market Size by Country
9.6.8.1 Turkiye
9.6.8.2 Bahrain
9.6.8.3 Kuwait
9.6.8.4 Saudi Arabia
9.6.8.5 Qatar
9.6.8.6 UAE
9.6.8.7 Israel
9.6.8.8 South Africa
9.7. South America Ship Anchor Chain Market
9.7.1 Key Market Trends, Growth Factors and Opportunities
9.7.2 Top Key Companies
9.7.3 Historic and Forecasted Market Size by Segments
9.7.4 Historic and Forecasted Market Size by Type
9.7.4.1 Stud Link Anchor Chain
9.7.4.2 Studless Anchor Chain
9.7.5 Historic and Forecasted Market Size by Size
9.7.5.1 Up to 3
9.7.5.2 500 lbs
9.7.5.3 3
9.7.5.4 500 - 10
9.7.5.5 000 lbs
9.7.5.6 Above 10
9.7.5.7 000 lbs
9.7.6 Historic and Forecasted Market Size by Material
9.7.6.1 Steel
9.7.6.2 Stainless Steel
9.7.7 Historic and Forecasted Market Size by Application
9.7.7.1 Merchant Vessels
9.7.7.2 Offshore Support Vessels
9.7.7.3 Naval Vessels
9.7.8 Historic and Forecast Market Size by Country
9.7.8.1 Brazil
9.7.8.2 Argentina
9.7.8.3 Rest of SA
Chapter 10 Analyst Viewpoint and Conclusion
10.1 Recommendations and Concluding Analysis
10.2 Potential Market Strategies
Chapter 11 Research Methodology
11.1 Research Process
11.2 Primary Research
11.3 Secondary Research
|
Global Ship Anchor Chain Market |
|||
|
Base Year: |
2023 |
Forecast Period: |
2024-2032 |
|
Historical Data: |
2017 to 2023 |
Market Size in 2023: |
USD 112.38 Bn. |
|
Forecast Period 2024-32 CAGR: |
9.81% |
Market Size in 2032: |
USD 260.9 Bn. |
|
Segments Covered: |
By Type |
|
|
|
By Size |
|
||
|
By Material |
|
||
|
By Application |
|
||
|
By Region |
|
||
|
Key Market Drivers: |
|
||
|
Key Market Restraints: |
|
||
|
Key Opportunities: |
|
||
|
Companies Covered in the report: |
|
||


