


Seismic Services Market Synopsis:
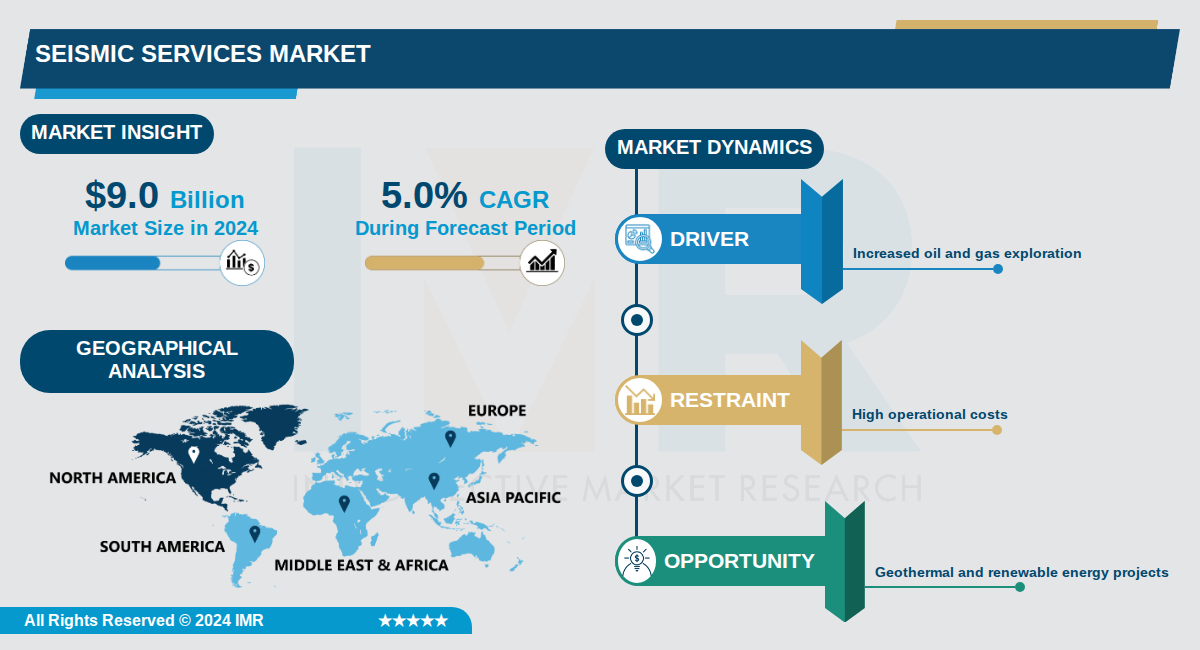
Seismic Services Market Size Was Valued at USD 9.0 Billion in 2024, and is Projected to Reach USD 15.0 Billion by 2035, Growing at a CAGR of 5.0% From 2024-2035.
The global seismic services market was valued at approximately USD 9.0 billion in 2024 and is projected to reach USD 15.0 billion by 2035, representing a compound annual growth rate (CAGR) of 5.0%. This market encompasses a range of geophysical surveying technologies and services used primarily for subsurface imaging and resource exploration. The market encompasses various seismic imaging technologies, including 2D, 3D, and 4D seismic surveys, which have become essential tools across multiple industries.
North America dominates the global seismic services market, accounting for over 39% of market share in 2024, with the United States alone representing more than 82% of North American demand. The region's leadership is driven by substantial investments in oil and gas exploration, technological infrastructure, and increasing renewable energy projects. Key market players including Schlumberger (SLB) and CGG maintain dominant positions through advanced 3D and 4D seismic imaging capabilities and extensive geographical presence.
The oil and gas industry remains the largest application segment, commanding approximately 54.7% of market share, while 3D imaging technology leads the market with around 40% of the seismic services market share in 2024. Onshore seismic services dominate due to high exploration activity and infrastructure development, though offshore operations, particularly in the Gulf of Mexico, continue to expand. Innovations in artificial intelligence, Internet of Things, and wireless sensor technologies are enhancing data accuracy and operational efficiency across the sector.
Seismic Services Market Trend Analysis:
Integration of AI and Machine Learning in Seismic Data Processing
- Nearly 50% of seismic firms are prioritizing AI and cloud-based systems for data processing, with 62% of surveys now using advanced digital technologies for sharper subsurface visibility. Companies like Schlumberger and CGG lead this shift by deploying AI algorithms for automated data interpretation, reducing exploration timelines by enhancing prediction accuracy. This integration allows operators to process vast datasets from 3D and 4D imaging more efficiently, minimizing errors in reservoir characterization.
- Machine learning models analyze seismic data to identify subtle patterns in unconventional reservoirs like shale formations in the Permian Basin, where North American market value reached USD 3.06 billion in 2026. TGS has partnered with tech providers to accelerate these upgrades, enabling real-time decision-making during offshore surveys. As a result, exploration costs drop significantly, with operators reporting up to 20% faster project completions.
- Emerging applications include VR for data visualization and fiber optic sensing for continuous monitoring, adopted by firms in deepwater projects to improve operational efficiency. This trend supports sustainable growth by offering precise imaging services that align with enhanced safety regulations in seismically active regions like California.
Expansion into Offshore and Deepwater Exploration
- Offshore seismic services captured 62.42% market share in 2026, driven by demand for hydrocarbons in deepwater and ultra-deepwater environments using specialized vessels and 4D imaging. In the U.S., offshore wind projects in the Atlantic and Pacific regions pushed the market to USD 2.69 billion in 2026, requiring detailed subsurface mapping for turbine foundations. Companies like Schlumberger invest heavily in marine equipment to map complex geological structures.
- Asia Pacific is growing at 8.28% CAGR, reaching USD 2.72 billion in 2026, fueled by energy demands and deepwater E&P in unconventional sources like shale and tight reservoirs. This segment benefits from customized surveys with fast data turnaround, particularly for independent ventures in developing markets. Technological investments shorten timelines for ultra-deepwater surveys, boosting returns on hydrocarbon exploration.
- The trend extends to renewable energy, with seismic services aiding geothermal assessments and offshore wind stability, as seen in collaborative projects emphasizing high-precision monitoring.
Rise of Seismic Risk Assessment and Monitoring
- Increasing natural disasters and urbanization in seismic-prone areas like California drive demand, with ShakeAlert early warning system operational since 2023 relying on real-time seismic data to alert residents. Investments in earthquake monitoring systems mitigate infrastructure risks, particularly in North America and Asia Pacific where urban populations grow rapidly. This has amplified the need for advanced 3D imaging in civil engineering projects.
- 54% of operators adopt seismic services for precise data to enhance safety and planning, supporting enhanced oil recovery and ground stability assessments in mining. U.S. market growth to USD 1.35 billion by 2035 reflects regulatory compliance shaping dynamics, with focus on resilience in infrastructure development. Environmental regulations mandate these surveys, reducing hazards during operations.
- Innovations like near-surface seismic analysis and UAVs for data acquisition improve cost-efficiency and safety, as mining companies detect mineral deposits more accurately.
Seismic Services Market Segment Analysis:
Seismic Services Market is Segmented on the basis of By Service, By Location of Deployment, By Seismic Technology
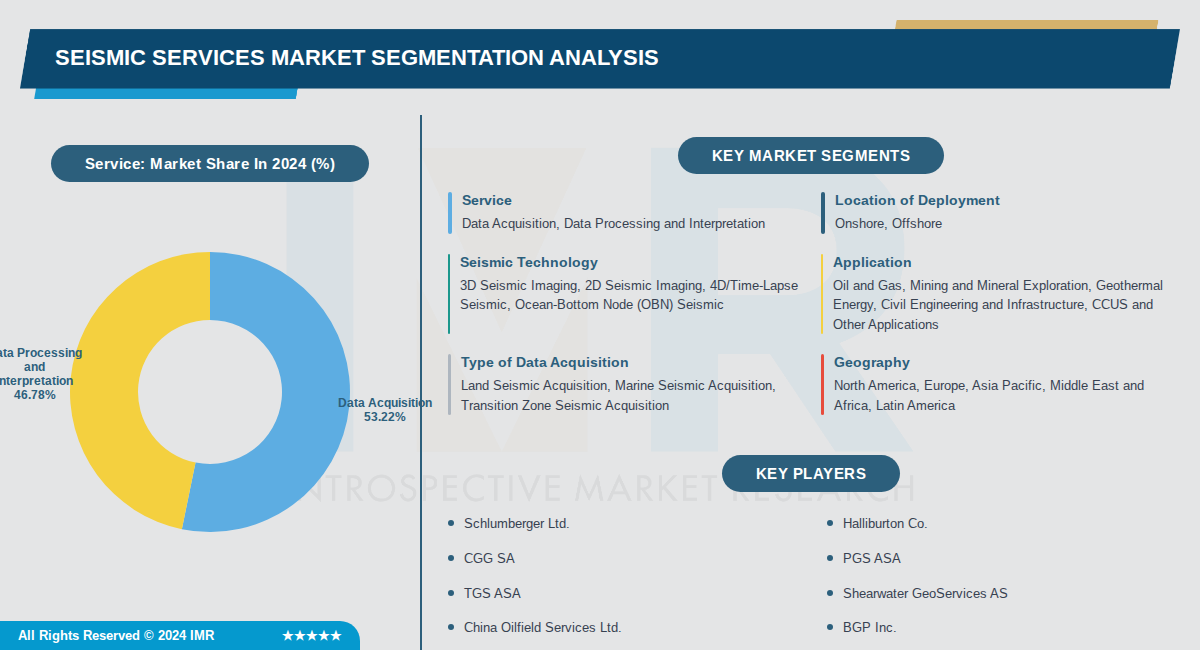
By Service, Data Acquisition segment is expected to dominate the market during the forecast period
- Data acquisition dominates with 53.22% market share due to increasing global energy demands and technological advancements in seismic imaging that require high-quality subsurface data collection through sophisticated equipment and methodologies.
- Growing infrastructure development projects worldwide necessitate advanced exploration techniques that leverage nodal seismic systems and wireless sensors, further driving demand for data acquisition services over interpretation services.
By Location of Deployment, Onshore segment is expected to dominate the market during the forecast period
- Onshore seismic services dominate due to high oil and gas exploration activity, extensive infrastructure development projects, and widespread geohazard assessments across populated regions requiring earthquake risk evaluation.
- Land-based seismic surveys are more cost-effective and accessible for hydrocarbon exploration, mining, and construction projects, with governments and private companies investing heavily in advanced nodal seismic systems and AI-driven data processing to enhance efficiency.
By Seismic Technology, 3D Seismic Imaging segment is expected to dominate the market during the forecast period
- 3D seismic imaging leads with 45% market share due to its superior ability to locate and evaluate underground oil and gas reserves with enhanced accuracy, significantly reducing drilling risks and improving extraction efficiency compared to 2D methods.
- Advancements in 3D and 4D imaging technologies, combined with AI and IoT integration, have dramatically improved data accuracy and exploration efficiency, making these technologies the preferred choice for modern hydrocarbon exploration and reservoir management applications.
By Application, Oil and Gas segment is expected to dominate the market during the forecast period
- Oil and gas dominates with 54.7% market share because the industry fundamentally relies on seismic surveys for hydrocarbon exploration, reservoir management, and production optimization, with 2D, 3D, and 4D seismic imaging being essential for locating and evaluating underground reserves.
- The global competition for strategic minerals has significantly increased seismic service adoption in mining for mineral deposit detection and resource extraction optimization, while growing demand for earthquake-resistant infrastructure in seismic-prone regions drives adoption in civil engineering and construction sectors.
By Type of Data Acquisition, Land Seismic Acquisition segment is expected to dominate the market during the forecast period
- Land seismic acquisition dominates with 58% market share due to extensive onshore oil and gas exploration activities, lower operational costs compared to marine surveys, and widespread use across mining, geothermal, and infrastructure development projects requiring subsurface geological insights.
- Advanced nodal seismic systems and wireless sensor technologies have significantly enhanced the cost-effectiveness and efficiency of land-based surveys, making them the preferred choice for hydrocarbon exploration, earthquake hazard assessment, and construction site evaluations across diverse geographic regions.
By Geography, North America segment is expected to dominate the market during the forecast period
- North America dominates with 39% market share driven by substantial oil and gas exploration and production activities, technological advancements in 3D and 4D seismic imaging, and stringent earthquake risk assessment requirements in seismically active regions.
- The region's mature energy infrastructure, significant investment in advanced seismic technologies including AI-driven data processing, and regulatory requirements for earthquake-resistant construction in high-risk areas position North America as the global leader in seismic services market demand.
Seismic Services Market Regional Insights:
North America is Expected to Dominate the Market Over the Forecast Period
- North America dominates the seismic services market, holding 36.7% of global revenue in 2025, primarily driven by the United States, Canada, and Mexico. The U.S. leads due to extensive Gulf of Mexico deepwater developments and Permian Basin shale activities, while Canada contributes through Atlantic prospects and Alberta aquifer surveys. This region's mature infrastructure and high exploration volumes solidify its leading position.
- Advanced infrastructure supports high-resolution 3D and 4D seismic imaging, bolstered by U.S. policies like the Inflation Reduction Act incentivizing carbon capture and storage surveys. Regulatory frameworks and investments in shale gas extraction promote continuous technological upgrades. Market factors include strong oil and gas demand, enabling precise subsurface mapping in challenging terrains.
- Major players are investing heavily in North America, with developments in wide-azimuth data acquisition in the Gulf of Mexico and North Sea-adjacent operations. U.S. firms lead in fleet redeployment and advanced vessel utilization for premium day rates. Recent Canadian Clean Fuel Standard initiatives have spurred new seismic programs targeting saline aquifers.
Active Key Players in the Seismic Services Market:
- Schlumberger Ltd. (USA)
- Halliburton Co. (USA)
- CGG SA (France)
- PGS ASA (Norway)
- TGS ASA (Norway)
- Shearwater GeoServices AS (Norway)
- China Oilfield Services Ltd. (China)
- BGP Inc. (China)
- Fugro NV (Netherlands)
- Viridien SA (France)
- SeaBird Exploration Plc (Norway)
- Fairfield Geotechnologies (USA)
- Dawson Geophysical Co. (USA)
- Asian Energy Services Ltd (India)
- Alphageo India Ltd. (India)
- Amerapex Corp. (USA)
- GeoKinetics (USA)
- Pulse Seismic Inc. (Canada)
- Other Active Players
|
Seismic Services Market |
|||
|
Base Year: |
2024 |
Forecast Period: |
2024-2035 |
|
Historical Data: |
2017 to 2024 |
Market Size in 2024: |
USD 9.0 Billion |
|
Forecast Period 2024-2035 CAGR: |
5.0 % |
Market Size in 2035: |
USD 15.0 Billion |
|
Segments Covered: |
By Service |
|
|
|
By Location of Deployment |
|
||
|
By Seismic Technology |
|
||
|
By Application |
|
||
|
By Type of Data Acquisition |
|
||
|
By Geography |
|
||
|
By Region |
|
||
|
Key Market Drivers: |
|
||
|
Key Market Restraints: |
|
||
|
Key Opportunities: |
|
||
|
Companies Covered in the report: |
|
||
Chapter 1: Introduction
1.1 Scope and Coverage
Chapter 2: Executive Summary
Chapter 3: Market Landscape
3.1 Market Dynamics and Opportunity Analysis
3.1.1 Growth Drivers
3.1.2 Limiting Factors
3.1.3 Growth Opportunities
3.1.4 Challenges and Risks
3.2 Market Trend Analysis
3.3 Industry Ecosystem
3.4 Industry Value Chain Mapping
3.5 Strategic PESTLE Overview
3.6 Porter's Five Forces Framework
3.7 Regulatory Framework
3.8 Pricing Trend Analysis
3.9 Intellectual Property Review
3.10 Technology Evolution
3.11 Import-Export Analysis
3.12 Consumer Behavior Analysis
3.13 Investment Pocket Analysis
3.14 Go-To Market Strategy
Chapter 4: Seismic Services Market by Service (2017-2035)
4.1 Seismic Services Market Snapshot and Growth Engine
4.2 Market Overview
4.3 Data Acquisition
4.3.1 Introduction and Market Overview
4.3.2 Historic and Forecasted Market Size in Value USD and Volume Units
4.3.3 Key Market Trends, Growth Factors, and Opportunities
4.3.4 Geographic Segmentation Analysis
4.4 Data Processing and Interpretation
Chapter 5: Seismic Services Market by Location of Deployment (2017-2035)
5.1 Seismic Services Market Snapshot and Growth Engine
5.2 Market Overview
5.3 Onshore
5.3.1 Introduction and Market Overview
5.3.2 Historic and Forecasted Market Size in Value USD and Volume Units
5.3.3 Key Market Trends, Growth Factors, and Opportunities
5.3.4 Geographic Segmentation Analysis
5.4 Offshore
Chapter 6: Seismic Services Market by Seismic Technology (2017-2035)
6.1 Seismic Services Market Snapshot and Growth Engine
6.2 Market Overview
6.3 3D Seismic Imaging
6.3.1 Introduction and Market Overview
6.3.2 Historic and Forecasted Market Size in Value USD and Volume Units
6.3.3 Key Market Trends, Growth Factors, and Opportunities
6.3.4 Geographic Segmentation Analysis
6.4 2D Seismic Imaging
6.5 4D/Time-Lapse Seismic
6.6 Ocean-Bottom Node (OBN) Seismic
Chapter 7: Seismic Services Market by Application (2017-2035)
7.1 Seismic Services Market Snapshot and Growth Engine
7.2 Market Overview
7.3 Oil and Gas
7.3.1 Introduction and Market Overview
7.3.2 Historic and Forecasted Market Size in Value USD and Volume Units
7.3.3 Key Market Trends, Growth Factors, and Opportunities
7.3.4 Geographic Segmentation Analysis
7.4 Mining and Mineral Exploration
7.5 Geothermal Energy
7.6 Civil Engineering and Infrastructure
7.7 CCUS and Other Applications
Chapter 8: Seismic Services Market by Type of Data Acquisition (2017-2035)
8.1 Seismic Services Market Snapshot and Growth Engine
8.2 Market Overview
8.3 Land Seismic Acquisition
8.3.1 Introduction and Market Overview
8.3.2 Historic and Forecasted Market Size in Value USD and Volume Units
8.3.3 Key Market Trends, Growth Factors, and Opportunities
8.3.4 Geographic Segmentation Analysis
8.4 Marine Seismic Acquisition
8.5 Transition Zone Seismic Acquisition
Chapter 9: Seismic Services Market by Geography (2017-2035)
9.1 Seismic Services Market Snapshot and Growth Engine
9.2 Market Overview
9.3 North America
9.3.1 Introduction and Market Overview
9.3.2 Historic and Forecasted Market Size in Value USD and Volume Units
9.3.3 Key Market Trends, Growth Factors, and Opportunities
9.3.4 Geographic Segmentation Analysis
9.4 Europe
9.5 Asia Pacific
9.6 Middle East and Africa
9.7 Latin America
Chapter 10: Company Profiles and Competitive Analysis
10.1 Competitive Landscape
10.1.1 Competitive Benchmarking
10.1.2 Seismic Services Market Share by Manufacturer/Service Provider (2024)
10.1.3 Industry BCG Matrix
10.1.4 Partnerships, Mergers & Acquisitions
10.2 SCHLUMBERGER LTD.
10.2.1 Company Overview
10.2.2 Key Executives
10.2.3 Company Snapshot
10.2.4 Role of the Company in the Market
10.2.5 Sustainability and Social Responsibility
10.2.6 Operating Business Segments
10.2.7 Product Portfolio
10.2.8 Business Performance
10.2.9 Recent News & Developments
10.2.10 SWOT Analysis
10.3 HALLIBURTON CO.
10.4 CGG SA
10.5 PGS ASA
10.6 TGS ASA
10.7 SHEARWATER GEOSERVICES AS
10.8 CHINA OILFIELD SERVICES LTD.
10.9 BGP INC.
10.10 FUGRO NV
10.11 VIRIDIEN SA
10.12 SEABIRD EXPLORATION PLC
10.13 FAIRFIELD GEOTECHNOLOGIES
10.14 DAWSON GEOPHYSICAL CO.
10.15 ASIAN ENERGY SERVICES LTD
10.16 ALPHAGEO INDIA LTD.
10.17 AMERAPEX CORP.
10.18 GEOKINETICS
10.19 PULSE SEISMIC INC.
Chapter 11: Global Seismic Services Market By Region
11.1 Overview
11.2. North America Seismic Services Market
11.2.1 Key Market Trends, Growth Factors and Opportunities
11.2.2 Top Key Companies
11.2.3 Historic and Forecasted Market Size by Segments
11.2.4 Historic and Forecast Market Size by Country
11.3. Eastern Europe Seismic Services Market
11.3.1 Key Market Trends, Growth Factors and Opportunities
11.3.2 Top Key Companies
11.3.3 Historic and Forecasted Market Size by Segments
11.3.4 Historic and Forecast Market Size by Country
11.4. Western Europe Seismic Services Market
11.4.1 Key Market Trends, Growth Factors and Opportunities
11.4.2 Top Key Companies
11.4.3 Historic and Forecasted Market Size by Segments
11.4.4 Historic and Forecast Market Size by Country
11.5. Asia Pacific Seismic Services Market
11.5.1 Key Market Trends, Growth Factors and Opportunities
11.5.2 Top Key Companies
11.5.3 Historic and Forecasted Market Size by Segments
11.5.4 Historic and Forecast Market Size by Country
11.6. Middle East & Africa Seismic Services Market
11.6.1 Key Market Trends, Growth Factors and Opportunities
11.6.2 Top Key Companies
11.6.3 Historic and Forecasted Market Size by Segments
11.6.4 Historic and Forecast Market Size by Country
11.7. South America Seismic Services Market
11.7.1 Key Market Trends, Growth Factors and Opportunities
11.7.2 Top Key Companies
11.7.3 Historic and Forecasted Market Size by Segments
11.7.4 Historic and Forecast Market Size by Country
Chapter 12: Analyst Viewpoint and Conclusion
Chapter 13: Research Methodology
13.1 Research Process
13.2 Primary Research
13.3 Secondary Research
Chapter 14: Case Study
Chapter 15: Appendix
15.1 Sources
15.2 List of Tables and Figures
15.3 Short Forms and Citations
15.4 Assumption and Conversion
15.5 Disclaimer
|
Seismic Services Market |
|||
|
Base Year: |
2024 |
Forecast Period: |
2024-2035 |
|
Historical Data: |
2017 to 2024 |
Market Size in 2024: |
USD 9.0 Billion |
|
Forecast Period 2024-2035 CAGR: |
5.0 % |
Market Size in 2035: |
USD 15.0 Billion |
|
Segments Covered: |
By Service |
|
|
|
By Location of Deployment |
|
||
|
By Seismic Technology |
|
||
|
By Application |
|
||
|
By Type of Data Acquisition |
|
||
|
By Geography |
|
||
|
By Region |
|
||
|
Key Market Drivers: |
|
||
|
Key Market Restraints: |
|
||
|
Key Opportunities: |
|
||
|
Companies Covered in the report: |
|
||


