


Microencapsulation Technology Market Synopsis
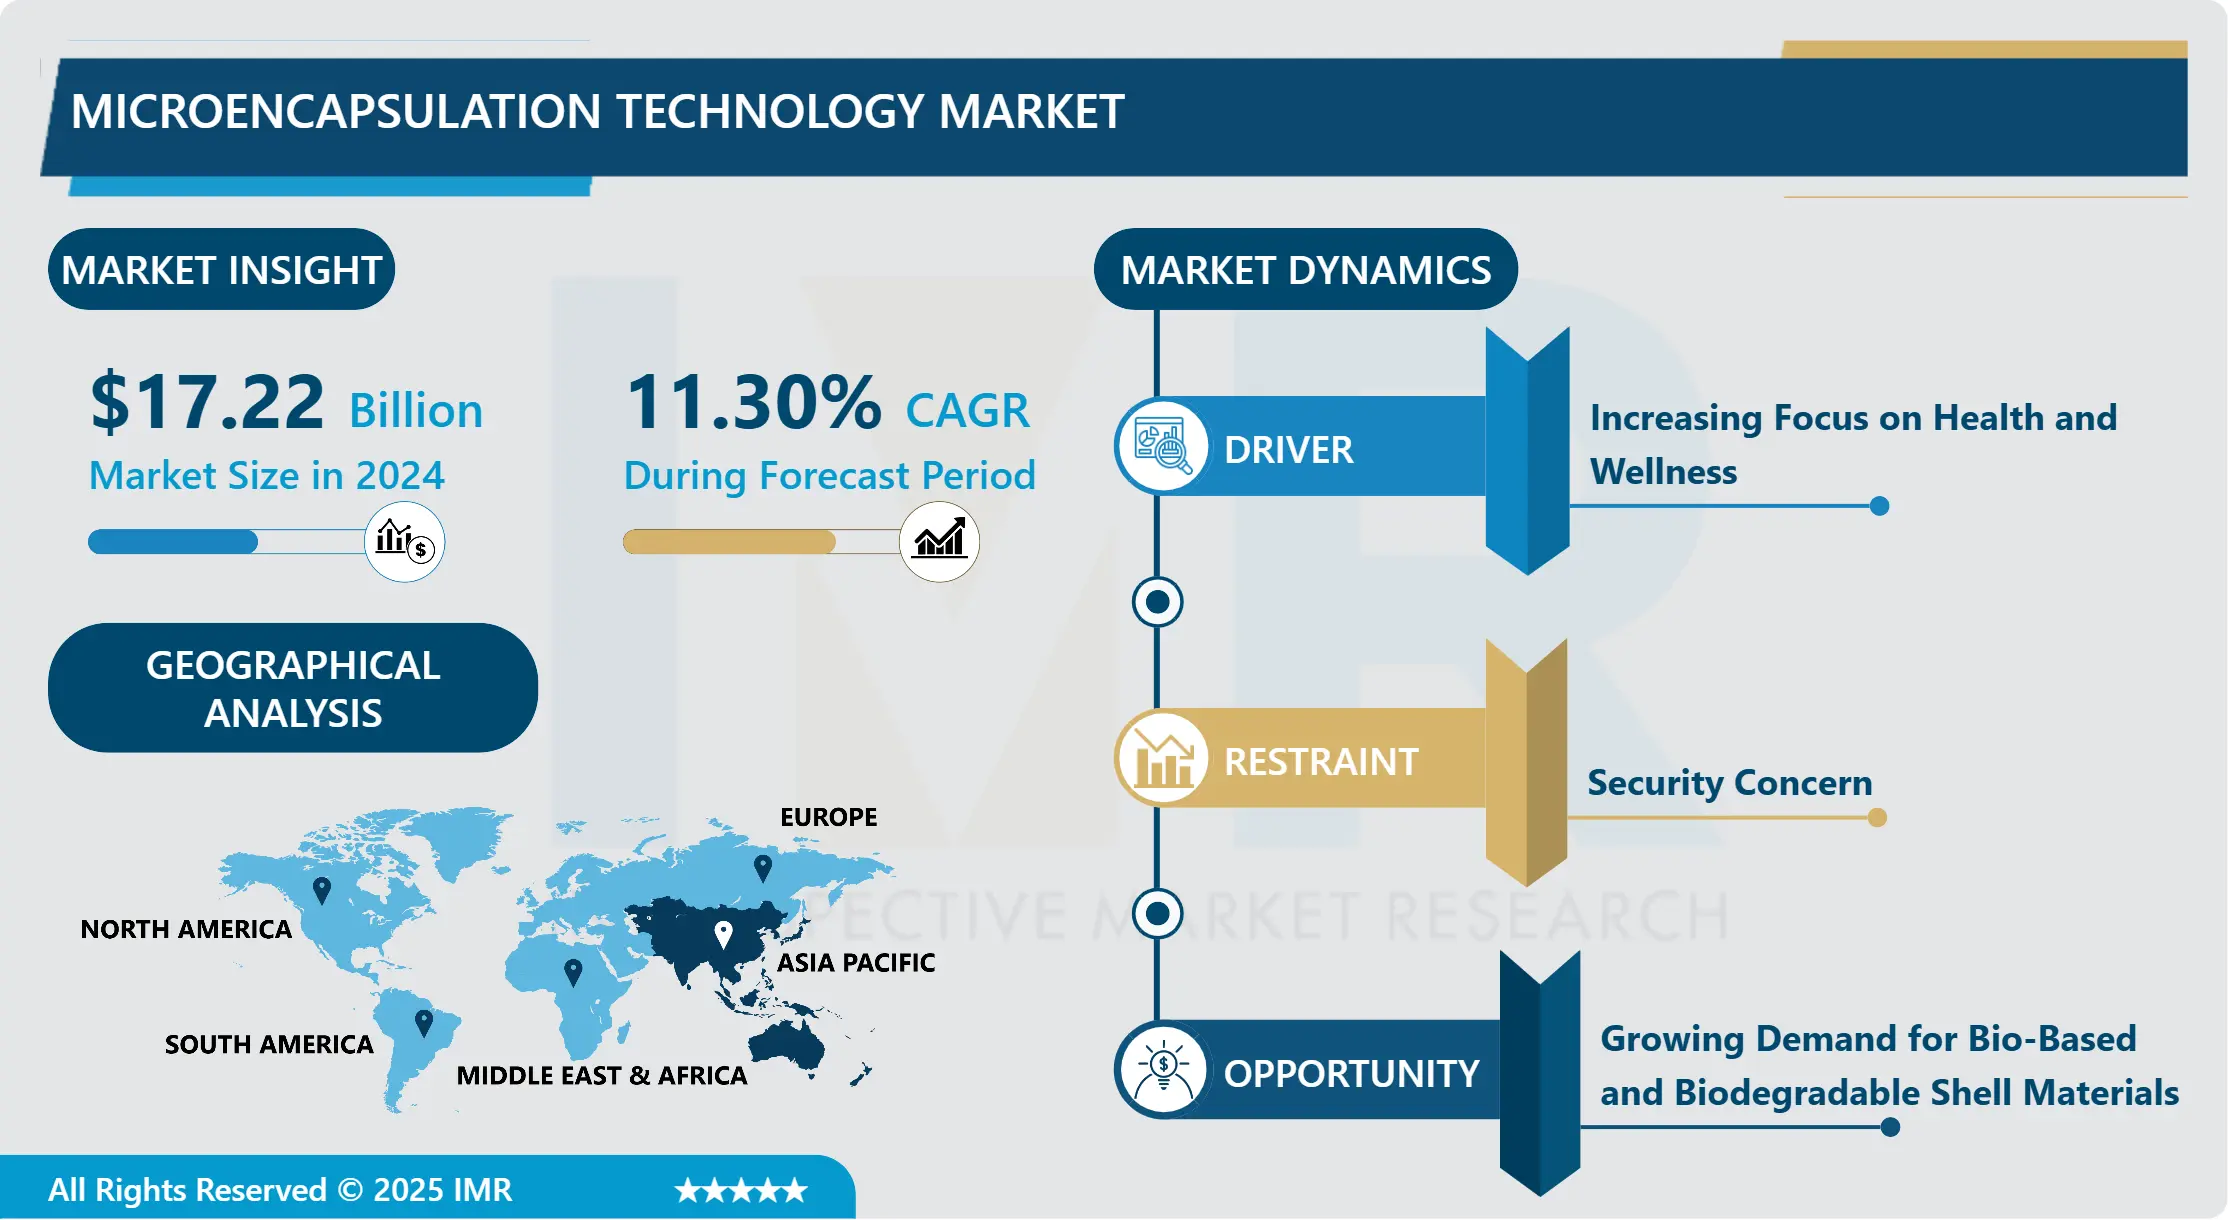
Global Microencapsulation Technology Market Size Was Valued at USD 17.22 Billion in 2024 and is Projected to Reach USD 40.55 Billion by 2032, Growing at a CAGR of 11.30% From 2025-2032.
Microencapsulation Technology involves encapsulating tiny particles or droplets of active ingredients or core materials within a protective coating. This process creates micro-sized capsules that can be used to deliver substances such as drugs, flavors, fragrances, or nutrients in a controlled manner.
Microencapsulation Technology finds diverse applications across various industries, offering numerous advantages and driving future demand growth. In pharmaceuticals, it enables controlled drug release, improved bioavailability, and targeted delivery, enhancing treatment efficacy and patient compliance. Additionally, microencapsulation facilitates taste masking, protection of sensitive compounds, and stabilization of pharmaceutical formulations, leading to extended shelf life and improved patient experience.
Microencapsulation is utilized for encapsulating flavors, colors, vitamins, and nutrients, enhancing product stability, sensory attributes, and nutritional value. It enables the development of functional foods with controlled release properties, prolonged shelf life, and improved consumer acceptance. Moreover, microencapsulation technology provides opportunities for innovation in food processing, enabling the development of fortified foods, dietary supplements, and specialty ingredients to meet evolving consumer demands for health and wellness products.
As industries increasingly prioritize product differentiation, sustainability, and consumer-centric innovation, the demand for microencapsulation technology is expected to witness significant growth. Future applications may include the development of personalized medicine, advanced functional foods, and environmentally sustainable agricultural practices. Additionally, advancements in microencapsulation techniques, such as nanoencapsulation and coacervation, are anticipated to expand the scope of applications and drive further adoption across industries.

Microencapsulation Technology Market Trend Analysis:
Increasing Focus on Health and Wellness
- The increasing focus on health and wellness is a major driver propelling the growth of the microencapsulation technology market. Consumers are becoming more health-conscious, seeking products that offer functional benefits and improved efficacy. Microencapsulation plays a crucial role in enhancing the delivery and stability of active ingredients in various health and wellness products, including dietary supplements, functional foods, and pharmaceuticals. This technology enables the controlled release and targeted delivery of bioactive compounds, ensuring optimal absorption and bioavailability for consumers.
- Another factor driving the adoption of microencapsulation technology in the health and wellness sector is the demand for value-added products with enhanced sensory attributes and prolonged shelf life. Microencapsulation helps mask unpleasant tastes or odors, improve product texture, and protect sensitive ingredients from degradation due to environmental factors or processing conditions. This is particularly beneficial in developing functional beverages, nutraceuticals, and personal care products that meet consumer expectations for quality, convenience, and effectiveness.
- Furthermore, the growing interest in personalized nutrition and tailored healthcare solutions is fueling the demand for innovative microencapsulation techniques. Companies are leveraging microencapsulation to create customized formulations with specific release profiles, catering to individual health needs and preferences. With ongoing advancements in microencapsulation technology and its applications across diverse industries, the market is poised for continued growth as health and wellness remain key priorities for consumers worldwide.
Growing Demand for Bio-Based and Biodegradable Shell Materials
- The growing demand for bio-based and biodegradable shell materials presents a significant opportunity for the growth of the microencapsulation technology market. As industries and consumers increasingly prioritize sustainability and environmental responsibility, there is a shift towards utilizing eco-friendly materials in various applications, including microencapsulation. Bio-based and biodegradable shells offer advantages such as reduced environmental impact, compatibility with green initiatives, and compliance with regulations promoting sustainability.
- Bio-based and biodegradable shell materials in microencapsulation are their ability to address concerns related to plastic pollution and waste management. Traditional microencapsulation techniques often rely on synthetic polymers that contribute to environmental pollution and pose disposal challenges. By transitioning to bio-based and biodegradable alternatives, companies can align their products with eco-conscious consumer preferences while meeting regulatory requirements focused on reducing plastic waste.
- Furthermore, advancements in research and development have led to the availability of bio-based materials with comparable or superior encapsulation properties to synthetic counterparts. This has expanded the scope of applications for microencapsulation technology across industries such as pharmaceuticals, food and beverages, cosmetics, and agriculture. As demand continues to grow for sustainable solutions, the integration of bio-based and biodegradable shell materials in microencapsulation is expected to drive innovation and market expansion, contributing to the overall growth of the microencapsulation technology sector.
Microencapsulation Technology Market Segment Analysis:
Microencapsulation Technology Market Segmented on the basis of Technology, Shell Material, Core Material, and Application.
By Type, Spray Technology segment is expected to dominate the market during the forecast period
- The spray technology segment is poised to dominate the growth of the microencapsulation technology market. This dominance can be attributed to the versatility and efficiency of spray-based encapsulation methods in delivering a wide range of active ingredients. Spray technology allows for precise control over particle size, distribution, and encapsulation efficiency, making it suitable for applications in pharmaceuticals, food additives, fragrances, and agricultural chemicals.
- Additionally, spray-based microencapsulation techniques, such as spray drying and spray chilling, offer advantages such as scalability, cost-effectiveness, and rapid processing times. These factors contribute to the widespread adoption of spray technology in industries requiring microencapsulation solutions for improved product performance, stability, and controlled release of bioactive compounds. As demand grows for advanced encapsulation methods that meet stringent quality standards and regulatory requirements, the spray technology segment is expected to maintain its dominant position and drive further innovation in the microencapsulation technology market.
By Application, Polymers segment held the largest share
- The polymers segment has emerged as the leading contributor to the growth of the microencapsulation technology market, holding the largest share. This growth can be attributed to several factors, including the versatility and widespread applicability of polymer-based encapsulation materials in various industries. Polymers offer unique properties such as controlled release, protection of active ingredients, and compatibility with different formulations, making them suitable for applications in pharmaceuticals, cosmetics, food additives, and agricultural chemicals.
- The polymer segment in the microencapsulation market is the continuous innovation and development of advanced polymer materials tailored for specific encapsulation requirements. Polymer-based microencapsulation techniques, such as coacervation, emulsion polymerization, and interfacial polymerization, offer precise control over particle size, morphology, and release kinetics, enhancing the efficacy and performance of encapsulated products. Additionally, polymers exhibit excellent stability, allowing for prolonged shelf life and improved product integrity, which are essential factors driving their widespread adoption across diverse industry verticals.
Microencapsulation Technology Market Regional Insights:
Asia Pacific is Expected to Dominate the Market Over the Forecast Period
- Asia Pacific is expected to dominate the region for the growth of the microencapsulation technology market. This dominance can be attributed to several factors, including rapid industrialization, increasing investments in research and development, and the rising demand for advanced encapsulation solutions across various sectors such as pharmaceuticals, food and beverages, cosmetics, and agriculture. Countries like China, India, Japan, and South Korea are witnessing significant growth in microencapsulation technology adoption due to their expanding manufacturing capabilities and supportive regulatory frameworks.
- Furthermore, the growing awareness regarding the benefits of microencapsulation, such as improved product stability, enhanced bioavailability of active ingredients, and extended shelf life, is driving market growth in the Asia Pacific region. Additionally, the region's thriving healthcare and pharmaceutical industries, coupled with the rising consumer demand for functional foods and personalized nutrition, are fueling the demand for innovative microencapsulation techniques. As Asia Pacific continues to emerge as a hub for technological advancements and manufacturing excellence, it is expected to maintain its dominance in the microencapsulation technology market, driving further innovation and market expansion.
Microencapsulation Technology Market Top Key Players:
- Balchem Corporation (US)
- Encapsys (US)
- Arcade Beauty (US)
- International Flavors & Fragrances (US)
- Sensient Technologies (US)
- Ingredion Incorporation (US)
- Cargill (US)
- Dupont (US)
- Aveka Group (US)
- Advanced Bionutrition Corp (US)
- Microtek (US)
- BASF (Germany)
- Symrise (Germany)
- Koehler Innovative Solutions (Germany)
- Tastetech Encapsulation Solutions (UK)
- Lycored Corp. (UK)
- Kerry (Ireland)
- Royal FrieslandCampina (Netherlands)
- Koninklijke DSM (Netherlands)
- Vitasquare (Netherlands)
- Syngenta Crop Protection (Switzerland)
- Givaudan (Switzerland)
- Firmenich Incorporation (Switzerland)
- Sphera Encapsulation (Italy)
- Clextral (France)
- Reed Pacific Pty Ltd. (Australia), and Other Active Players
Key Industry Developments in the Microencapsulation Technology Market:
- In March 2023, Reed Pacific introduced a revolutionary cosmetic-grade microcapsule called "Potenza Argan Oil." This microcapsule, developed for cosmetic purposes, enables the absorption of high quantities of argan oil into water-based formulations without jeopardizing the finished product's stability. Potenza Argan Oil's encapsulation considerably improves its efficiency and shelf life, limiting oxidation of its fatty acids by minimizing exposure to light and air.
- In August 2023, Spray-Tek, LLC, backed by Aurora Capital, expanded into the biodegradable microencapsulation market through the acquisition of TRuCapSol. The acquisition, announced today, saw Spray-Tek, a leading provider of specialized spray drying and ingredient processing solutions in North America, purchasing TRuCapSol, a renowned provider of biodegradable encapsulation technologies. The transaction details were not disclosed. TRuCapSol boasted a robust intellectual property portfolio and a team of skilled R&D professionals, offering biodegradable microencapsulation technologies for various demanding end markets.
|
Global Microencapsulation Technology Market |
|||
|
Base Year: |
2024 |
Forecast Period: |
2025-2032 |
|
Historical Data: |
2018 to 2023 |
Market Size in 2024: |
USD 17.22 Bn. |
|
Forecast Period 2024-32 CAGR: |
11.30 % |
Market Size in 2032: |
USD 40.55 Bn. |
|
Segments Covered: |
By Type |
|
|
|
By Shell Material |
|
||
|
By Core Material |
|
||
|
By Application |
|
||
|
By Region |
|
||
|
Key Market Drivers: |
|
||
|
Key Market Restraints: |
|
||
|
Key Opportunities: |
|
||
|
Companies Covered in the report: |
|
||
Chapter 1: Introduction
1.1 Scope and Coverage
Chapter 2:Executive Summary
Chapter 3: Market Landscape
3.1 Market Dynamics
3.1.1 Drivers
3.1.2 Restraints
3.1.3 Opportunities
3.1.4 Challenges
3.2 Market Trend Analysis
3.3 PESTLE Analysis
3.4 Porter's Five Forces Analysis
3.5 Industry Value Chain Analysis
3.6 Ecosystem
3.7 Regulatory Landscape
3.8 Price Trend Analysis
3.9 Patent Analysis
3.10 Technology Evolution
3.11 Investment Pockets
3.12 Import-Export Analysis
Chapter 4: Microencapsulation Technology Market by Type (2018-2032)
4.1 Microencapsulation Technology Market Snapshot and Growth Engine
4.2 Market Overview
4.3 Spray Technology
4.3.1 Introduction and Market Overview
4.3.2 Historic and Forecasted Market Size in Value USD and Volume Units
4.3.3 Key Market Trends, Growth Factors, and Opportunities
4.3.4 Geographic Segmentation Analysis
4.4 Dripping Technology
4.5 Emulsion Technology
4.6 Coating Technology
4.7 Physicochemical Technology
4.8 Chemical Technology
Chapter 5: Microencapsulation Technology Market by Shell Material (2018-2032)
5.1 Microencapsulation Technology Market Snapshot and Growth Engine
5.2 Market Overview
5.3 Polymers
5.3.1 Introduction and Market Overview
5.3.2 Historic and Forecasted Market Size in Value USD and Volume Units
5.3.3 Key Market Trends, Growth Factors, and Opportunities
5.3.4 Geographic Segmentation Analysis
5.4 Lipids
5.5 Carbohydrates
5.6 Protein
5.7 Gums & Resins
Chapter 6: Microencapsulation Technology Market by Core Material (2018-2032)
6.1 Microencapsulation Technology Market Snapshot and Growth Engine
6.2 Market Overview
6.3 Food Additives
6.3.1 Introduction and Market Overview
6.3.2 Historic and Forecasted Market Size in Value USD and Volume Units
6.3.3 Key Market Trends, Growth Factors, and Opportunities
6.3.4 Geographic Segmentation Analysis
6.4 Agricultural Inputs
6.5 Fragrances
6.6 Phase Change Material
6.7 Pharmaceutical & Healthcare Drugs
6.8 Paper & Printing
Chapter 7: Microencapsulation Technology Market by Application (2018-2032)
7.1 Microencapsulation Technology Market Snapshot and Growth Engine
7.2 Market Overview
7.3 Household & Personal Care Products
7.3.1 Introduction and Market Overview
7.3.2 Historic and Forecasted Market Size in Value USD and Volume Units
7.3.3 Key Market Trends, Growth Factors, and Opportunities
7.3.4 Geographic Segmentation Analysis
7.4 Agrochemicals
7.5 Construction Material
7.6 Textiles
7.7 Food & Beverages
7.8 Pharmaceutical & Healthcare Products
Chapter 8: Company Profiles and Competitive Analysis
8.1 Competitive Landscape
8.1.1 Competitive Benchmarking
8.1.2 Microencapsulation Technology Market Share by Manufacturer (2024)
8.1.3 Industry BCG Matrix
8.1.4 Heat Map Analysis
8.1.5 Mergers and Acquisitions
8.2 THOMSON REUTERS (US)
8.2.1 Company Overview
8.2.2 Key Executives
8.2.3 Company Snapshot
8.2.4 Role of the Company in the Market
8.2.5 Sustainability and Social Responsibility
8.2.6 Operating Business Segments
8.2.7 Product Portfolio
8.2.8 Business Performance
8.2.9 Key Strategic Moves and Recent Developments
8.2.10 SWOT Analysis
8.3 VERITONE (US)
8.4 IMANAGE (US)
8.5 LEXISNEXIS (US)
8.6 NEOTA LOGIC (US)
8.7 EVERLAW (US)
8.8 LEGALSIFTER (US)
8.9 COGNITIV+ (US)
8.10 CASETEXT (US)
8.11 KLARITY (US)
8.12 OMNI SOFTWARE SYSTEMS (US)
8.13 LEXISNEXIS GROUP INC (US)
8.14 LAWGEEX (US)
8.15 ROSS INTELLIGENCE (CANADA)
8.16 OPENTEXT (CANADA)
8.17 KIRA (CANADA)
8.18 EY RIVERVIEW LAW (UK)
8.19 LUMINANCE (UK)
8.20 NALANDA TECHNOLOGY (UK)
8.21 RRADAR (UK)
8.22 LUMINANCE TECHNOLOGIES LTD. (UK)
8.23
Chapter 9: Global Microencapsulation Technology Market By Region
9.1 Overview
9.2. North America Microencapsulation Technology Market
9.2.1 Key Market Trends, Growth Factors and Opportunities
9.2.2 Top Key Companies
9.2.3 Historic and Forecasted Market Size by Segments
9.2.4 Historic and Forecasted Market Size by Type
9.2.4.1 Spray Technology
9.2.4.2 Dripping Technology
9.2.4.3 Emulsion Technology
9.2.4.4 Coating Technology
9.2.4.5 Physicochemical Technology
9.2.4.6 Chemical Technology
9.2.5 Historic and Forecasted Market Size by Shell Material
9.2.5.1 Polymers
9.2.5.2 Lipids
9.2.5.3 Carbohydrates
9.2.5.4 Protein
9.2.5.5 Gums & Resins
9.2.6 Historic and Forecasted Market Size by Core Material
9.2.6.1 Food Additives
9.2.6.2 Agricultural Inputs
9.2.6.3 Fragrances
9.2.6.4 Phase Change Material
9.2.6.5 Pharmaceutical & Healthcare Drugs
9.2.6.6 Paper & Printing
9.2.7 Historic and Forecasted Market Size by Application
9.2.7.1 Household & Personal Care Products
9.2.7.2 Agrochemicals
9.2.7.3 Construction Material
9.2.7.4 Textiles
9.2.7.5 Food & Beverages
9.2.7.6 Pharmaceutical & Healthcare Products
9.2.8 Historic and Forecast Market Size by Country
9.2.8.1 US
9.2.8.2 Canada
9.2.8.3 Mexico
9.3. Eastern Europe Microencapsulation Technology Market
9.3.1 Key Market Trends, Growth Factors and Opportunities
9.3.2 Top Key Companies
9.3.3 Historic and Forecasted Market Size by Segments
9.3.4 Historic and Forecasted Market Size by Type
9.3.4.1 Spray Technology
9.3.4.2 Dripping Technology
9.3.4.3 Emulsion Technology
9.3.4.4 Coating Technology
9.3.4.5 Physicochemical Technology
9.3.4.6 Chemical Technology
9.3.5 Historic and Forecasted Market Size by Shell Material
9.3.5.1 Polymers
9.3.5.2 Lipids
9.3.5.3 Carbohydrates
9.3.5.4 Protein
9.3.5.5 Gums & Resins
9.3.6 Historic and Forecasted Market Size by Core Material
9.3.6.1 Food Additives
9.3.6.2 Agricultural Inputs
9.3.6.3 Fragrances
9.3.6.4 Phase Change Material
9.3.6.5 Pharmaceutical & Healthcare Drugs
9.3.6.6 Paper & Printing
9.3.7 Historic and Forecasted Market Size by Application
9.3.7.1 Household & Personal Care Products
9.3.7.2 Agrochemicals
9.3.7.3 Construction Material
9.3.7.4 Textiles
9.3.7.5 Food & Beverages
9.3.7.6 Pharmaceutical & Healthcare Products
9.3.8 Historic and Forecast Market Size by Country
9.3.8.1 Russia
9.3.8.2 Bulgaria
9.3.8.3 The Czech Republic
9.3.8.4 Hungary
9.3.8.5 Poland
9.3.8.6 Romania
9.3.8.7 Rest of Eastern Europe
9.4. Western Europe Microencapsulation Technology Market
9.4.1 Key Market Trends, Growth Factors and Opportunities
9.4.2 Top Key Companies
9.4.3 Historic and Forecasted Market Size by Segments
9.4.4 Historic and Forecasted Market Size by Type
9.4.4.1 Spray Technology
9.4.4.2 Dripping Technology
9.4.4.3 Emulsion Technology
9.4.4.4 Coating Technology
9.4.4.5 Physicochemical Technology
9.4.4.6 Chemical Technology
9.4.5 Historic and Forecasted Market Size by Shell Material
9.4.5.1 Polymers
9.4.5.2 Lipids
9.4.5.3 Carbohydrates
9.4.5.4 Protein
9.4.5.5 Gums & Resins
9.4.6 Historic and Forecasted Market Size by Core Material
9.4.6.1 Food Additives
9.4.6.2 Agricultural Inputs
9.4.6.3 Fragrances
9.4.6.4 Phase Change Material
9.4.6.5 Pharmaceutical & Healthcare Drugs
9.4.6.6 Paper & Printing
9.4.7 Historic and Forecasted Market Size by Application
9.4.7.1 Household & Personal Care Products
9.4.7.2 Agrochemicals
9.4.7.3 Construction Material
9.4.7.4 Textiles
9.4.7.5 Food & Beverages
9.4.7.6 Pharmaceutical & Healthcare Products
9.4.8 Historic and Forecast Market Size by Country
9.4.8.1 Germany
9.4.8.2 UK
9.4.8.3 France
9.4.8.4 The Netherlands
9.4.8.5 Italy
9.4.8.6 Spain
9.4.8.7 Rest of Western Europe
9.5. Asia Pacific Microencapsulation Technology Market
9.5.1 Key Market Trends, Growth Factors and Opportunities
9.5.2 Top Key Companies
9.5.3 Historic and Forecasted Market Size by Segments
9.5.4 Historic and Forecasted Market Size by Type
9.5.4.1 Spray Technology
9.5.4.2 Dripping Technology
9.5.4.3 Emulsion Technology
9.5.4.4 Coating Technology
9.5.4.5 Physicochemical Technology
9.5.4.6 Chemical Technology
9.5.5 Historic and Forecasted Market Size by Shell Material
9.5.5.1 Polymers
9.5.5.2 Lipids
9.5.5.3 Carbohydrates
9.5.5.4 Protein
9.5.5.5 Gums & Resins
9.5.6 Historic and Forecasted Market Size by Core Material
9.5.6.1 Food Additives
9.5.6.2 Agricultural Inputs
9.5.6.3 Fragrances
9.5.6.4 Phase Change Material
9.5.6.5 Pharmaceutical & Healthcare Drugs
9.5.6.6 Paper & Printing
9.5.7 Historic and Forecasted Market Size by Application
9.5.7.1 Household & Personal Care Products
9.5.7.2 Agrochemicals
9.5.7.3 Construction Material
9.5.7.4 Textiles
9.5.7.5 Food & Beverages
9.5.7.6 Pharmaceutical & Healthcare Products
9.5.8 Historic and Forecast Market Size by Country
9.5.8.1 China
9.5.8.2 India
9.5.8.3 Japan
9.5.8.4 South Korea
9.5.8.5 Malaysia
9.5.8.6 Thailand
9.5.8.7 Vietnam
9.5.8.8 The Philippines
9.5.8.9 Australia
9.5.8.10 New Zealand
9.5.8.11 Rest of APAC
9.6. Middle East & Africa Microencapsulation Technology Market
9.6.1 Key Market Trends, Growth Factors and Opportunities
9.6.2 Top Key Companies
9.6.3 Historic and Forecasted Market Size by Segments
9.6.4 Historic and Forecasted Market Size by Type
9.6.4.1 Spray Technology
9.6.4.2 Dripping Technology
9.6.4.3 Emulsion Technology
9.6.4.4 Coating Technology
9.6.4.5 Physicochemical Technology
9.6.4.6 Chemical Technology
9.6.5 Historic and Forecasted Market Size by Shell Material
9.6.5.1 Polymers
9.6.5.2 Lipids
9.6.5.3 Carbohydrates
9.6.5.4 Protein
9.6.5.5 Gums & Resins
9.6.6 Historic and Forecasted Market Size by Core Material
9.6.6.1 Food Additives
9.6.6.2 Agricultural Inputs
9.6.6.3 Fragrances
9.6.6.4 Phase Change Material
9.6.6.5 Pharmaceutical & Healthcare Drugs
9.6.6.6 Paper & Printing
9.6.7 Historic and Forecasted Market Size by Application
9.6.7.1 Household & Personal Care Products
9.6.7.2 Agrochemicals
9.6.7.3 Construction Material
9.6.7.4 Textiles
9.6.7.5 Food & Beverages
9.6.7.6 Pharmaceutical & Healthcare Products
9.6.8 Historic and Forecast Market Size by Country
9.6.8.1 Turkiye
9.6.8.2 Bahrain
9.6.8.3 Kuwait
9.6.8.4 Saudi Arabia
9.6.8.5 Qatar
9.6.8.6 UAE
9.6.8.7 Israel
9.6.8.8 South Africa
9.7. South America Microencapsulation Technology Market
9.7.1 Key Market Trends, Growth Factors and Opportunities
9.7.2 Top Key Companies
9.7.3 Historic and Forecasted Market Size by Segments
9.7.4 Historic and Forecasted Market Size by Type
9.7.4.1 Spray Technology
9.7.4.2 Dripping Technology
9.7.4.3 Emulsion Technology
9.7.4.4 Coating Technology
9.7.4.5 Physicochemical Technology
9.7.4.6 Chemical Technology
9.7.5 Historic and Forecasted Market Size by Shell Material
9.7.5.1 Polymers
9.7.5.2 Lipids
9.7.5.3 Carbohydrates
9.7.5.4 Protein
9.7.5.5 Gums & Resins
9.7.6 Historic and Forecasted Market Size by Core Material
9.7.6.1 Food Additives
9.7.6.2 Agricultural Inputs
9.7.6.3 Fragrances
9.7.6.4 Phase Change Material
9.7.6.5 Pharmaceutical & Healthcare Drugs
9.7.6.6 Paper & Printing
9.7.7 Historic and Forecasted Market Size by Application
9.7.7.1 Household & Personal Care Products
9.7.7.2 Agrochemicals
9.7.7.3 Construction Material
9.7.7.4 Textiles
9.7.7.5 Food & Beverages
9.7.7.6 Pharmaceutical & Healthcare Products
9.7.8 Historic and Forecast Market Size by Country
9.7.8.1 Brazil
9.7.8.2 Argentina
9.7.8.3 Rest of SA
Chapter 10 Analyst Viewpoint and Conclusion
10.1 Recommendations and Concluding Analysis
10.2 Potential Market Strategies
Chapter 11 Research Methodology
11.1 Research Process
11.2 Primary Research
11.3 Secondary Research
|
Global Microencapsulation Technology Market |
|||
|
Base Year: |
2024 |
Forecast Period: |
2025-2032 |
|
Historical Data: |
2018 to 2023 |
Market Size in 2024: |
USD 17.22 Bn. |
|
Forecast Period 2024-32 CAGR: |
11.30 % |
Market Size in 2032: |
USD 40.55 Bn. |
|
Segments Covered: |
By Type |
|
|
|
By Shell Material |
|
||
|
By Core Material |
|
||
|
By Application |
|
||
|
By Region |
|
||
|
Key Market Drivers: |
|
||
|
Key Market Restraints: |
|
||
|
Key Opportunities: |
|
||
|
Companies Covered in the report: |
|
||


