


Data Center Power Market Synopsis
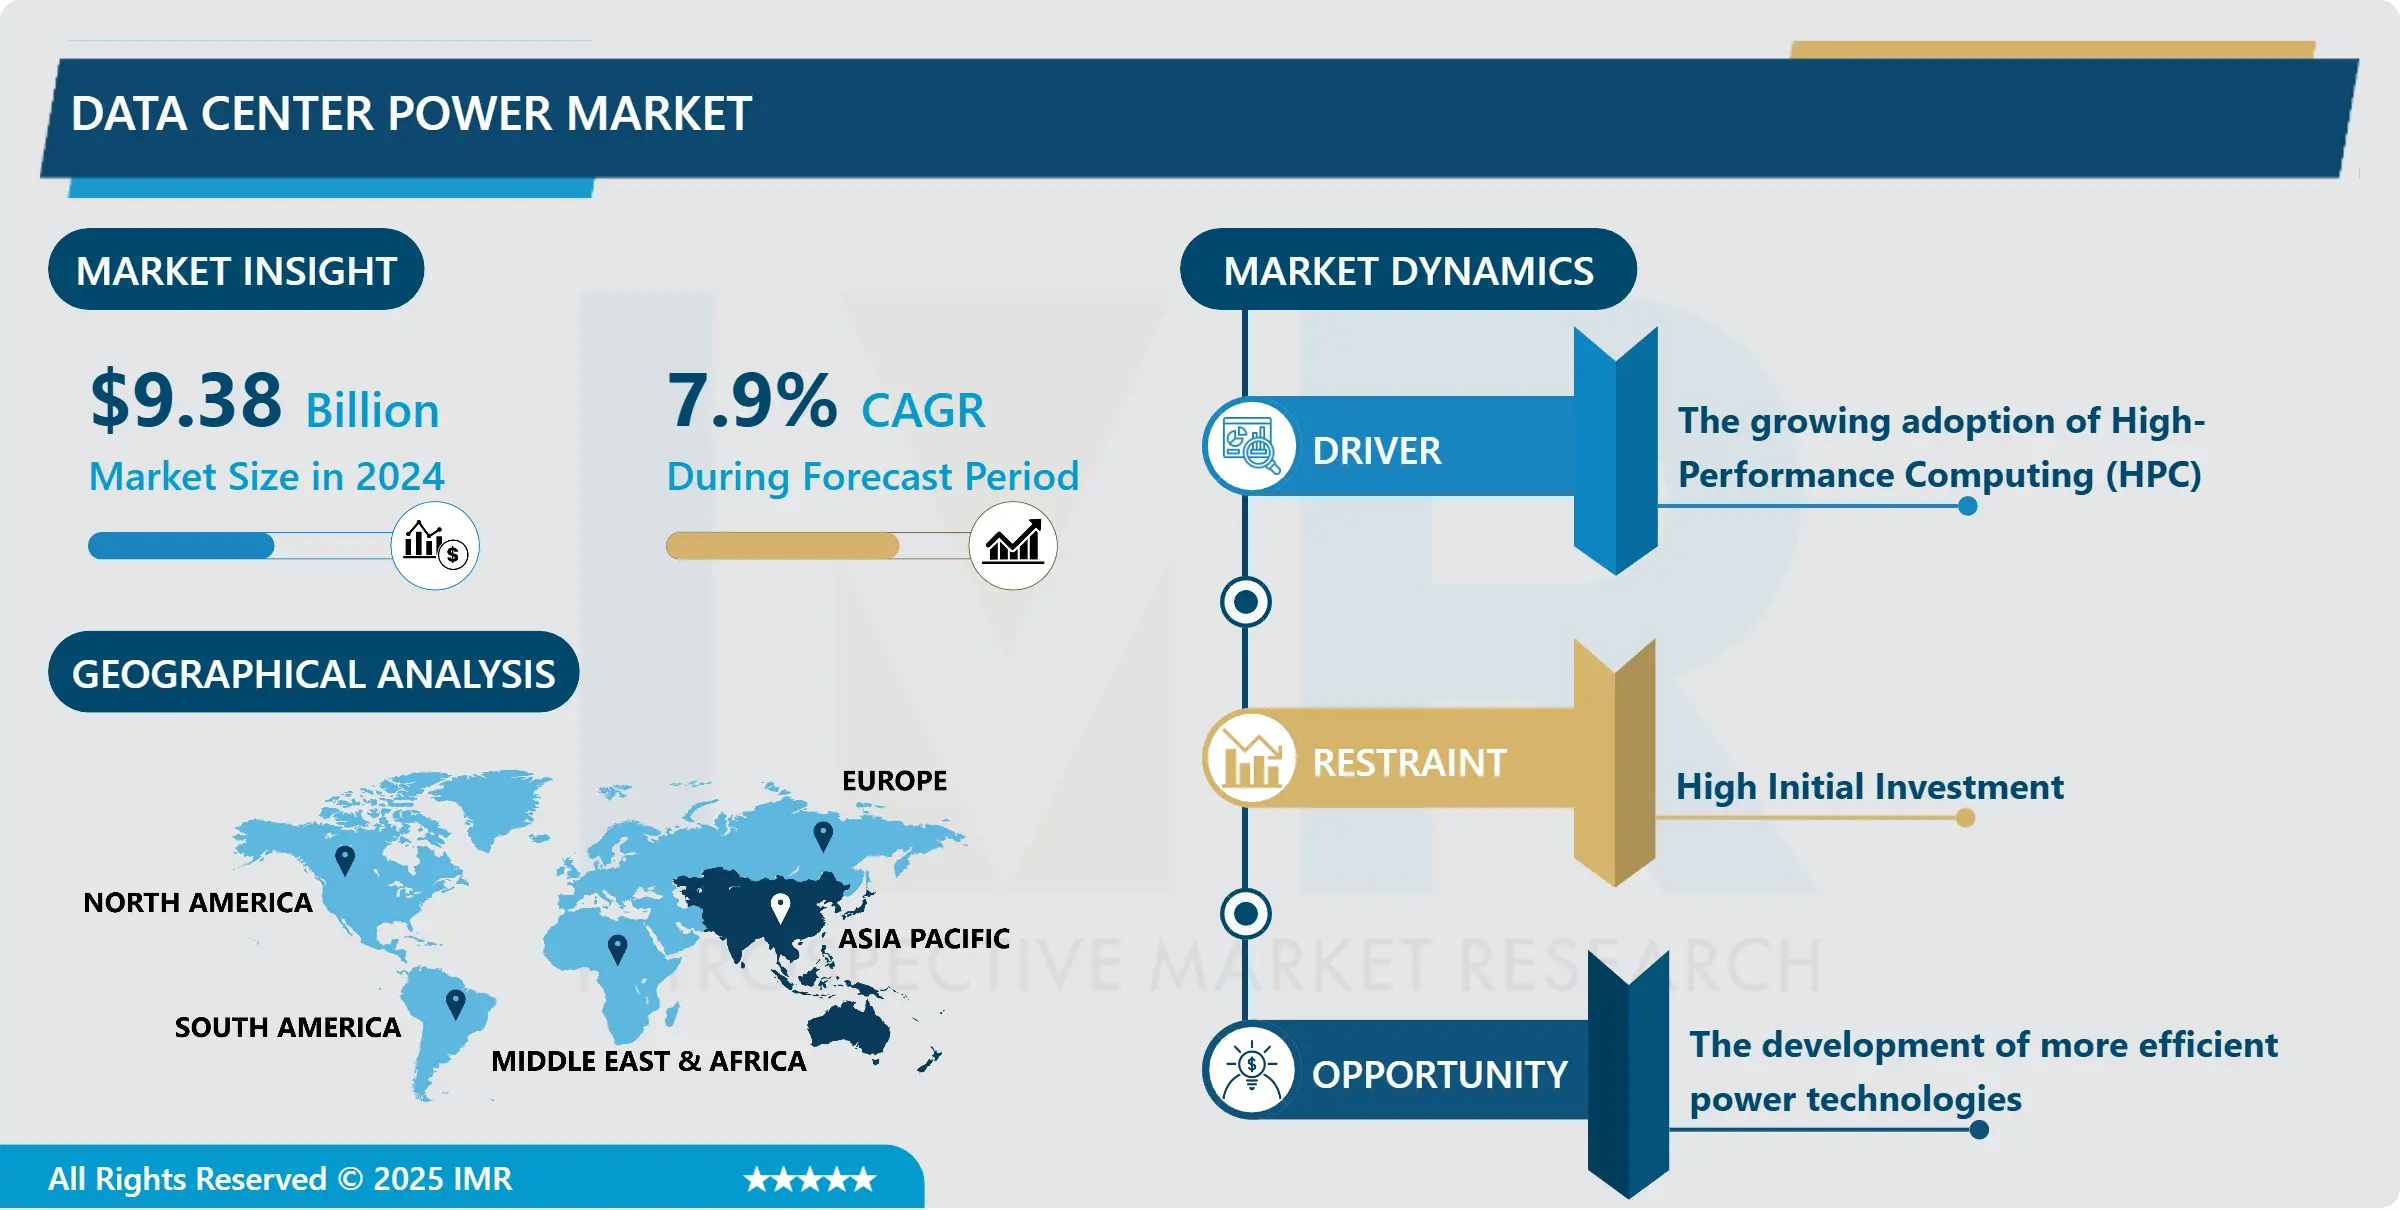
Data Center Power Market Size Was Valued at USD 9.38 Billion in 2024, and is Projected to Reach USD 17.23 Billion by 2032, Growing at a CAGR of 7.9% From 2025-2032.
Data center power relates to the electrical energy that has to be consumed to maintain the functionality of a data center, which is the physical nondigital support system that underlies today’s computing and Internet services.
These facilities accommodate many servers, network gears, and storage devices used in hosting websites, cloud businesses and other internet large-scale data processing businesses such as data analyzing businesses. Concerning the power, the need for data center power has significantly increased due to the rapid expansion of data and the increased dependency on internet-related products in all sectors.
Data center power or as it is often referred to, power usage is the power drawn by the IT loads and the power for cooling and supporting infrastructure. The management of the power used in the data centers is an important aspect that must be observed to enhance on the reliability, reduce on the downtime and minimize on the cost of operating these data centers.
In light of the fact that data centers have grown in size and complexity to accommodate the increasing consumption needs of the new era, increasing the level of power usage efficiency with the help of advanced technology and infrastructure is becoming a crucial factor that more and more companies and organizations pay attention to while aiming at the improvement of the performances and at the same time, the decrease of the impact on the environment.
Data Center Power Market Trend Analysis
Data Center Power Market Drivers- The growing adoption of High-Performance Computing (HPC)
- High performance computing [HPC] is one of the biggest trends that is already influencing the demand of data center power. High Dimensional Parallel Computing can be described as a process that enables or attempts to enable the resolution of huge, complicated mathematical problems expediently.
- With the rising need for data processing in fields like finance, healthcare, scientific research, and AI, HPC has also become a crucial need for employments like simulations, modeling, and data analysis; and the need for high-powered servers and infrastructure within data centers has increased. These High Performance Computing systems come with demanding power systems that need to deliver electricity to fuel the high computational throughput necessary for these systems. Therefore, data center operators are exploring ways to improve the reduce power consumption as well as embracing other technologies and physical infrastructure enhancements to support the rising power requirements of HPC workloads, without compromising reliability or costs.
- In addition, borne out by the cancer and climate modeling examples, the uptake of HPC is spurring developments in density and efficiency in data centers. In order to meet the density requirements without significant increases in power and facility space as well as cooling costs, data center operators have opted for more efficient server solutions and implementing liquid cooling and power supply architectures.
- This trend of achieving higher power density and efficiency not only benefits the HPC system wanted performance but actively contributes towards initiatives that focus on energy conservation and cutting down on carbon footprint. With the increase in application of HPC in numerous sectors, there is even more likely to be a revolution in data center power market to cater for the new changes in HPC sector.
Data Center Power Market Opportunity- The development of more efficient power technologies
- Availability of new technologies in power is a key factor of potential in the data center power market. This is because with the increasing demand for data center services, it is increasingly necessary to look at the ways of using available power and resources while aiming at low cost of operation and long term stability in service delivery.
- Modern power products like modular UPS systems, smart PDUs, and energy-saving cooling systems can help data center owners and managers to achieve greater power use effectiveness, implement reliable and redundant power supply distribution, and reduce data center outages. These technologies help to better manage the power usage for a more efficient utilization of the resources to increase the overall capacity of the data centers to handle more work without compromising on quality and efficiency.
- Also, the increasing use of renewable sources of energy for electricity generation which includes power assortment for solar and wind, battery and fly wheel also provide additional options to the data center power market. Incorporation of renewable energy into data center power systems plays a key role in decreasing reliance on non-renewable power grid electricity while at the same time serves as a significant platform for achieving green energy achievements due to lowered carbon footprint.
- Moreover, with the help of fresh developments in power management software and analytics, data center managers are provided with diverse tools utilizing powerful analytical and diagnostic to monitor and control power leveraging in a data center and recognize the inefficiencies in terms of resource usage and measure. It is in this context that through these efficient power technologies, data centers can play its part in meeting increasing the demands of the digital economy as well as being environmentally sustainable.
Data Center Power Market Segment Analysis:
Data Center Power Market is segmented based on Component, Solutions, Services and End-use.
By Component, Services is expected to dominate the market during the forecast period
- Among the segments in the Data Center Power market, the component sector has the propensity to be ahead. The components occupy this place because they are one of the central links in positioning power infrastructure in data centers. The equipment include uninterrupted power supplies (UPS), power distribution units (PDUs), batteries, generators and transformers which are crucial for power conditioning, power backup, and to safeguard the electronics equipment from power related problems such as fluctuations and outages.
- The computational and storage requirements of online services and data centers are constantly evolving as they grow and modernize their setups, and thus, there is a constant need for quality power components to guarantee uncompromising efficiency, durability, and scalability. In this way, the producers and providers of power components remain potential giants of the data center power market to embrace changes and create competitive platforms for data center operators.
- They are equally important in the data center power ecosystem, though they are often adjuncts to power components as opposed to a mainline offering. These are combinations of power management systems powering, cooling solutions, and power architectures intended for improving efficiency at data centers while consuming optimum power.
- Services incorporating confer setting up, upkeep, and consulting offered by vendors or third-party specialists for constructing, implementing, and managing the data center power segment. Although solutions and services add value and differentiate industry offering and performance of data center power systems, the often the component segment is considered the bedrock of the market since fulfills the fundamental need of delivering power to critical IT loads and ensuring their availability..
By Solutions, Uninterruptible Power Supply (UPS) segment held the largest share in 2024
- In the Data Center Power Market the segments which are commonly popular are Uninterruptible Power Supply (UPS). UPS systems are very crucial parts in data centers since they supply power to the center in case of failure or fluctuations in the utility power hence avoiding cases of a power outage or fluctuation which may lead to data loss this is because data centers are very sensitive parts that require deep consideration while exposing them to uncertain sources of power.
- By virtue of their importance to ensuring the survival of data centre operations, UPS systems are integral to the power architecture. Indeed, as data centers aim at achieving higher degrees of resilience it seems that UPS systems with the capabilities of scalability, efficiency, modularity, and ease of integration with energy storage systems are in constant demand. Therefore, UPS vendors supplying products that are essential to data center power controls a large market share of the sector and the demand for new and improved UPS systems in the data center market increases competition among vendors.
- Other products including power distribution unit (PDU), bus way, and other power distribution products are also crucial because of the way they help distribute power within and between data centers but because UPS provides backup power which supports the IT load they remain the central component.
- PDUs distribution power from UPS systems to servers and networking equipment and busway system helps in accomplishing high power distribution in data center environment systematically and efficiently. Further, other solutions including energy storage systems as well as incorporation of renewable energy in the power utility systems complement the UPS segment in providing reliability and efficiency. Yet, from a market standpoint, UPS systems are more of a square one for data center power as they play a crucial part in maintaining availability and dependability of data centers.
Data Center Power Market Regional Insights:
Asia Pacific is Expected to Dominate the Market Over the Forecast Period
- Power used in data centers in Asia Pacific region is growing at a healthy Compound Annual Growth Rate of 8%. According to this segment, colocation data centers are expected to grow by 7% from the year 2024 to 2030 in main emerging markets like India and China. These factors including the use of smartphones and tablets to access the internet increases the telecom subscribers across the region hence; this growth. The need for data centers to facilitate vo…center services and storage as these devices continue to gain popularity will experience immense growth in the future. This trend is believed to persist in the future that is foreseen and readily anticipated, thus giving the market the impetus for growth that it requires.
- According to this research report China data center power market is emerging at a fastest CAGR of 11 percent, and is expected to grow in the future. They estimate the increase rate to be 2 % for the duration, from 2024 up to 2030. The rising demand for storage and compute capabilities to cater for the massive amounts of data, electronic commerce, and other online services available in China. This means that in the current decades there has been a kind of revolution made by the Chinese population concerning facets associated with the digital world such as videos, images, and sharing.
- For example, in the same month of the year, the Chinese government initiated the East Data, West Computing campaign. It also seeks to develop eight computing sites and ten national data center sites across the country. Its primary mission is to rebalance the computing resources to make the computers imported from the economically more developed eastern regions of China available to the underdeveloped resource-rich western regions of the country.
- Of all the power data center segments of the market, the market in India was observed to dominate in terms of revenue in the year 2023. The Indian government has set its vision for making the country a digitally empowered society and the knowledge economy with the given campaign. This has made it possible for most organizations to quickly integrate various digital technologies making demands for data centres in support of the digital services and e-governance as well as online transactions.
- The Japan data center power market is developing significantly at a CAGR of 6. XYZ. According to the studies, the rise in cancer cases is expected to increase from 9% between the years 2024 and 2030. due to the growth of edge computing and the IoT, the decentralization of compute resources and storage is taking place, which results in edge data centers and micro data centers, which can be located near end-users and IoT devices. The edge facilities are not only power-sensitive but also demand smaller and more efficient power systems due to limited space which would continue to create market demand in the data center power industry.
- For instance, AWS and Google Cloud are estimating that in January 2024, there will be increased investment on data center operations while at the same time acknowledging the fact that the segment is energetic hence the call for sustainability measures. AWS declared USD 35 Billion Cloud Data Center Campuses in Virginia, U. S. , by 2040 and USD 15 Billion in augmentation of the existing data centre regions in Japan by 2027.
Active Key Players in the Data Center Power Market
- ABB (Switzerland)
- Black Box (United States)
- CyrusOne (United States)
- Eaton (Ireland)
- Equinix Inc. (United States)
- GDS Holdings (China)
- Generac Power Systems, Inc. (United States)
- General Electric Company (United States)
- Huawei Technologies Co., Ltd. (China)
- Legrand (France)
- N1 Critical Technologies (United States)
- NTT Global Data Centers (Japan)
- Raman Power Technologies (India)
- Rittal GmbH & Co. KG (Germany)
- Schneider Electric (France)
- Vertiv Group Corp. (United States)
- Other Active Players
Key Industry Developments in the Data Center Power Market:
- In October 2023, ABB Equity released information that ZincFive is now among the list of authorized UPS products vendors. This progression brings nickel-zinc batteries in a position to compete with lithium-ion and lead-acid batteries that are currently incorporated and backed inside of ABB’s UPS solutions.
- In July 2023, At a recent event in Bangalore, ABB India’s Electrification launched simply the MegaFlex DPA UPS solutions developed for the Indian market. Integrated into ABB EcoSolutions, this pioneering efficient and sustainable UPS can be regarded as in compliance with the ABB circularity framework. Built specifically for use in data centres and other high density computing environments, this is the most energy efficient model, taking up minimal space. With the trending use of SaaS and IaaS Apps by enterprises, it is important that data center offers high availability.
Global Data Center Power Market Scope:
|
Global Data Center Power Market |
|||
|
Base Year: |
2024 |
Forecast Period: |
2025-2032 |
|
Historical Data: |
2018 to 2023 |
Market Size in 2024: |
USD 9.38 Bn. |
|
Forecast Period 2023-32 CAGR: |
7.9 % |
Market Size in 2032: |
USD 17.23 Bn. |
|
Segments Covered: |
By Component |
|
|
|
By Solutions |
|
||
|
By Services |
|
||
|
By End-use |
|
||
|
By Region |
|
||
|
Key Market Drivers: |
|
||
|
Key Market Restraints: |
|
||
|
Key Opportunities: |
|
||
|
Companies Covered in the report: |
|
||
Chapter 1: Introduction
1.1 Scope and Coverage
Chapter 2:Executive Summary
Chapter 3: Market Landscape
3.1 Market Dynamics
3.1.1 Drivers
3.1.2 Restraints
3.1.3 Opportunities
3.1.4 Challenges
3.2 Market Trend Analysis
3.3 PESTLE Analysis
3.4 Porter's Five Forces Analysis
3.5 Industry Value Chain Analysis
3.6 Ecosystem
3.7 Regulatory Landscape
3.8 Price Trend Analysis
3.9 Patent Analysis
3.10 Technology Evolution
3.11 Investment Pockets
3.12 Import-Export Analysis
Chapter 4: Data Center Power Market by Component (2018-2032)
4.1 Data Center Power Market Snapshot and Growth Engine
4.2 Market Overview
4.3 Lithium-ion
4.3.1 Introduction and Market Overview
4.3.2 Historic and Forecasted Market Size in Value USD and Volume Units
4.3.3 Key Market Trends, Growth Factors, and Opportunities
4.3.4 Geographic Segmentation Analysis
4.4 Lead Acid
4.5 Others
Chapter 5: Data Center Power Market by Solutions (2018-2032)
5.1 Data Center Power Market Snapshot and Growth Engine
5.2 Market Overview
5.3 End of life
5.3.1 Introduction and Market Overview
5.3.2 Historic and Forecasted Market Size in Value USD and Volume Units
5.3.3 Key Market Trends, Growth Factors, and Opportunities
5.3.4 Geographic Segmentation Analysis
5.4 Production Scrap
Chapter 6: Data Center Power Market by Services (2018-2032)
6.1 Data Center Power Market Snapshot and Growth Engine
6.2 Market Overview
6.3 Passenger Cars
6.3.1 Introduction and Market Overview
6.3.2 Historic and Forecasted Market Size in Value USD and Volume Units
6.3.3 Key Market Trends, Growth Factors, and Opportunities
6.3.4 Geographic Segmentation Analysis
6.4 Buses
6.5 Vans
6.6 Others
Chapter 7: Data Center Power Market by End-use (2018-2032)
7.1 Data Center Power Market Snapshot and Growth Engine
7.2 Market Overview
7.3 IT & Telecommunications
7.3.1 Introduction and Market Overview
7.3.2 Historic and Forecasted Market Size in Value USD and Volume Units
7.3.3 Key Market Trends, Growth Factors, and Opportunities
7.3.4 Geographic Segmentation Analysis
7.4 BFSI
7.5 Government
7.6 Energy
7.7 Healthcare
7.8 Retail
7.9 Others
Chapter 8: Company Profiles and Competitive Analysis
8.1 Competitive Landscape
8.1.1 Competitive Benchmarking
8.1.2 Data Center Power Market Share by Manufacturer (2024)
8.1.3 Industry BCG Matrix
8.1.4 Heat Map Analysis
8.1.5 Mergers and Acquisitions
8.2 AAON INC. (USA)
8.2.1 Company Overview
8.2.2 Key Executives
8.2.3 Company Snapshot
8.2.4 Role of the Company in the Market
8.2.5 Sustainability and Social Responsibility
8.2.6 Operating Business Segments
8.2.7 Product Portfolio
8.2.8 Business Performance
8.2.9 Key Strategic Moves and Recent Developments
8.2.10 SWOT Analysis
8.3 AIREDALE AIR CONDITIONING LTD. (UNITED KINGDOM)
8.4 BLACK BOX CORP OF PENNSYLVANIA (USA)
8.5 DATA AIRE INC. (USA)
8.6 DELTA ELECTRONICS INC. (TAIWAN)
8.7 MITSUBISHI ELECTRIC CORP. (JAPAN)
8.8 RITTAL GMBH & CO. KG (GERMANY)
8.9 SCHNEIDER ELECTRIC SE (FRANCE)
8.10 STULZ GMBH (GERMANY)
8.11 VERTIV HOLDINGS CO. (USA)
8.12 OTHERS
Chapter 9: Global Data Center Power Market By Region
9.1 Overview
9.2. North America Data Center Power Market
9.2.1 Key Market Trends, Growth Factors and Opportunities
9.2.2 Top Key Companies
9.2.3 Historic and Forecasted Market Size by Segments
9.2.4 Historic and Forecasted Market Size by Component
9.2.4.1 Lithium-ion
9.2.4.2 Lead Acid
9.2.4.3 Others
9.2.5 Historic and Forecasted Market Size by Solutions
9.2.5.1 End of life
9.2.5.2 Production Scrap
9.2.6 Historic and Forecasted Market Size by Services
9.2.6.1 Passenger Cars
9.2.6.2 Buses
9.2.6.3 Vans
9.2.6.4 Others
9.2.7 Historic and Forecasted Market Size by End-use
9.2.7.1 IT & Telecommunications
9.2.7.2 BFSI
9.2.7.3 Government
9.2.7.4 Energy
9.2.7.5 Healthcare
9.2.7.6 Retail
9.2.7.7 Others
9.2.8 Historic and Forecast Market Size by Country
9.2.8.1 US
9.2.8.2 Canada
9.2.8.3 Mexico
9.3. Eastern Europe Data Center Power Market
9.3.1 Key Market Trends, Growth Factors and Opportunities
9.3.2 Top Key Companies
9.3.3 Historic and Forecasted Market Size by Segments
9.3.4 Historic and Forecasted Market Size by Component
9.3.4.1 Lithium-ion
9.3.4.2 Lead Acid
9.3.4.3 Others
9.3.5 Historic and Forecasted Market Size by Solutions
9.3.5.1 End of life
9.3.5.2 Production Scrap
9.3.6 Historic and Forecasted Market Size by Services
9.3.6.1 Passenger Cars
9.3.6.2 Buses
9.3.6.3 Vans
9.3.6.4 Others
9.3.7 Historic and Forecasted Market Size by End-use
9.3.7.1 IT & Telecommunications
9.3.7.2 BFSI
9.3.7.3 Government
9.3.7.4 Energy
9.3.7.5 Healthcare
9.3.7.6 Retail
9.3.7.7 Others
9.3.8 Historic and Forecast Market Size by Country
9.3.8.1 Russia
9.3.8.2 Bulgaria
9.3.8.3 The Czech Republic
9.3.8.4 Hungary
9.3.8.5 Poland
9.3.8.6 Romania
9.3.8.7 Rest of Eastern Europe
9.4. Western Europe Data Center Power Market
9.4.1 Key Market Trends, Growth Factors and Opportunities
9.4.2 Top Key Companies
9.4.3 Historic and Forecasted Market Size by Segments
9.4.4 Historic and Forecasted Market Size by Component
9.4.4.1 Lithium-ion
9.4.4.2 Lead Acid
9.4.4.3 Others
9.4.5 Historic and Forecasted Market Size by Solutions
9.4.5.1 End of life
9.4.5.2 Production Scrap
9.4.6 Historic and Forecasted Market Size by Services
9.4.6.1 Passenger Cars
9.4.6.2 Buses
9.4.6.3 Vans
9.4.6.4 Others
9.4.7 Historic and Forecasted Market Size by End-use
9.4.7.1 IT & Telecommunications
9.4.7.2 BFSI
9.4.7.3 Government
9.4.7.4 Energy
9.4.7.5 Healthcare
9.4.7.6 Retail
9.4.7.7 Others
9.4.8 Historic and Forecast Market Size by Country
9.4.8.1 Germany
9.4.8.2 UK
9.4.8.3 France
9.4.8.4 The Netherlands
9.4.8.5 Italy
9.4.8.6 Spain
9.4.8.7 Rest of Western Europe
9.5. Asia Pacific Data Center Power Market
9.5.1 Key Market Trends, Growth Factors and Opportunities
9.5.2 Top Key Companies
9.5.3 Historic and Forecasted Market Size by Segments
9.5.4 Historic and Forecasted Market Size by Component
9.5.4.1 Lithium-ion
9.5.4.2 Lead Acid
9.5.4.3 Others
9.5.5 Historic and Forecasted Market Size by Solutions
9.5.5.1 End of life
9.5.5.2 Production Scrap
9.5.6 Historic and Forecasted Market Size by Services
9.5.6.1 Passenger Cars
9.5.6.2 Buses
9.5.6.3 Vans
9.5.6.4 Others
9.5.7 Historic and Forecasted Market Size by End-use
9.5.7.1 IT & Telecommunications
9.5.7.2 BFSI
9.5.7.3 Government
9.5.7.4 Energy
9.5.7.5 Healthcare
9.5.7.6 Retail
9.5.7.7 Others
9.5.8 Historic and Forecast Market Size by Country
9.5.8.1 China
9.5.8.2 India
9.5.8.3 Japan
9.5.8.4 South Korea
9.5.8.5 Malaysia
9.5.8.6 Thailand
9.5.8.7 Vietnam
9.5.8.8 The Philippines
9.5.8.9 Australia
9.5.8.10 New Zealand
9.5.8.11 Rest of APAC
9.6. Middle East & Africa Data Center Power Market
9.6.1 Key Market Trends, Growth Factors and Opportunities
9.6.2 Top Key Companies
9.6.3 Historic and Forecasted Market Size by Segments
9.6.4 Historic and Forecasted Market Size by Component
9.6.4.1 Lithium-ion
9.6.4.2 Lead Acid
9.6.4.3 Others
9.6.5 Historic and Forecasted Market Size by Solutions
9.6.5.1 End of life
9.6.5.2 Production Scrap
9.6.6 Historic and Forecasted Market Size by Services
9.6.6.1 Passenger Cars
9.6.6.2 Buses
9.6.6.3 Vans
9.6.6.4 Others
9.6.7 Historic and Forecasted Market Size by End-use
9.6.7.1 IT & Telecommunications
9.6.7.2 BFSI
9.6.7.3 Government
9.6.7.4 Energy
9.6.7.5 Healthcare
9.6.7.6 Retail
9.6.7.7 Others
9.6.8 Historic and Forecast Market Size by Country
9.6.8.1 Turkiye
9.6.8.2 Bahrain
9.6.8.3 Kuwait
9.6.8.4 Saudi Arabia
9.6.8.5 Qatar
9.6.8.6 UAE
9.6.8.7 Israel
9.6.8.8 South Africa
9.7. South America Data Center Power Market
9.7.1 Key Market Trends, Growth Factors and Opportunities
9.7.2 Top Key Companies
9.7.3 Historic and Forecasted Market Size by Segments
9.7.4 Historic and Forecasted Market Size by Component
9.7.4.1 Lithium-ion
9.7.4.2 Lead Acid
9.7.4.3 Others
9.7.5 Historic and Forecasted Market Size by Solutions
9.7.5.1 End of life
9.7.5.2 Production Scrap
9.7.6 Historic and Forecasted Market Size by Services
9.7.6.1 Passenger Cars
9.7.6.2 Buses
9.7.6.3 Vans
9.7.6.4 Others
9.7.7 Historic and Forecasted Market Size by End-use
9.7.7.1 IT & Telecommunications
9.7.7.2 BFSI
9.7.7.3 Government
9.7.7.4 Energy
9.7.7.5 Healthcare
9.7.7.6 Retail
9.7.7.7 Others
9.7.8 Historic and Forecast Market Size by Country
9.7.8.1 Brazil
9.7.8.2 Argentina
9.7.8.3 Rest of SA
Chapter 10 Analyst Viewpoint and Conclusion
10.1 Recommendations and Concluding Analysis
10.2 Potential Market Strategies
Chapter 11 Research Methodology
11.1 Research Process
11.2 Primary Research
11.3 Secondary Research
Global Data Center Power Market Scope:
|
Global Data Center Power Market |
|||
|
Base Year: |
2024 |
Forecast Period: |
2025-2032 |
|
Historical Data: |
2018 to 2023 |
Market Size in 2024: |
USD 9.38 Bn. |
|
Forecast Period 2023-32 CAGR: |
7.9 % |
Market Size in 2032: |
USD 17.23 Bn. |
|
Segments Covered: |
By Component |
|
|
|
By Solutions |
|
||
|
By Services |
|
||
|
By End-use |
|
||
|
By Region |
|
||
|
Key Market Drivers: |
|
||
|
Key Market Restraints: |
|
||
|
Key Opportunities: |
|
||
|
Companies Covered in the report: |
|
||


