


Data Center Fire Detection and Suppression Market Synopsis
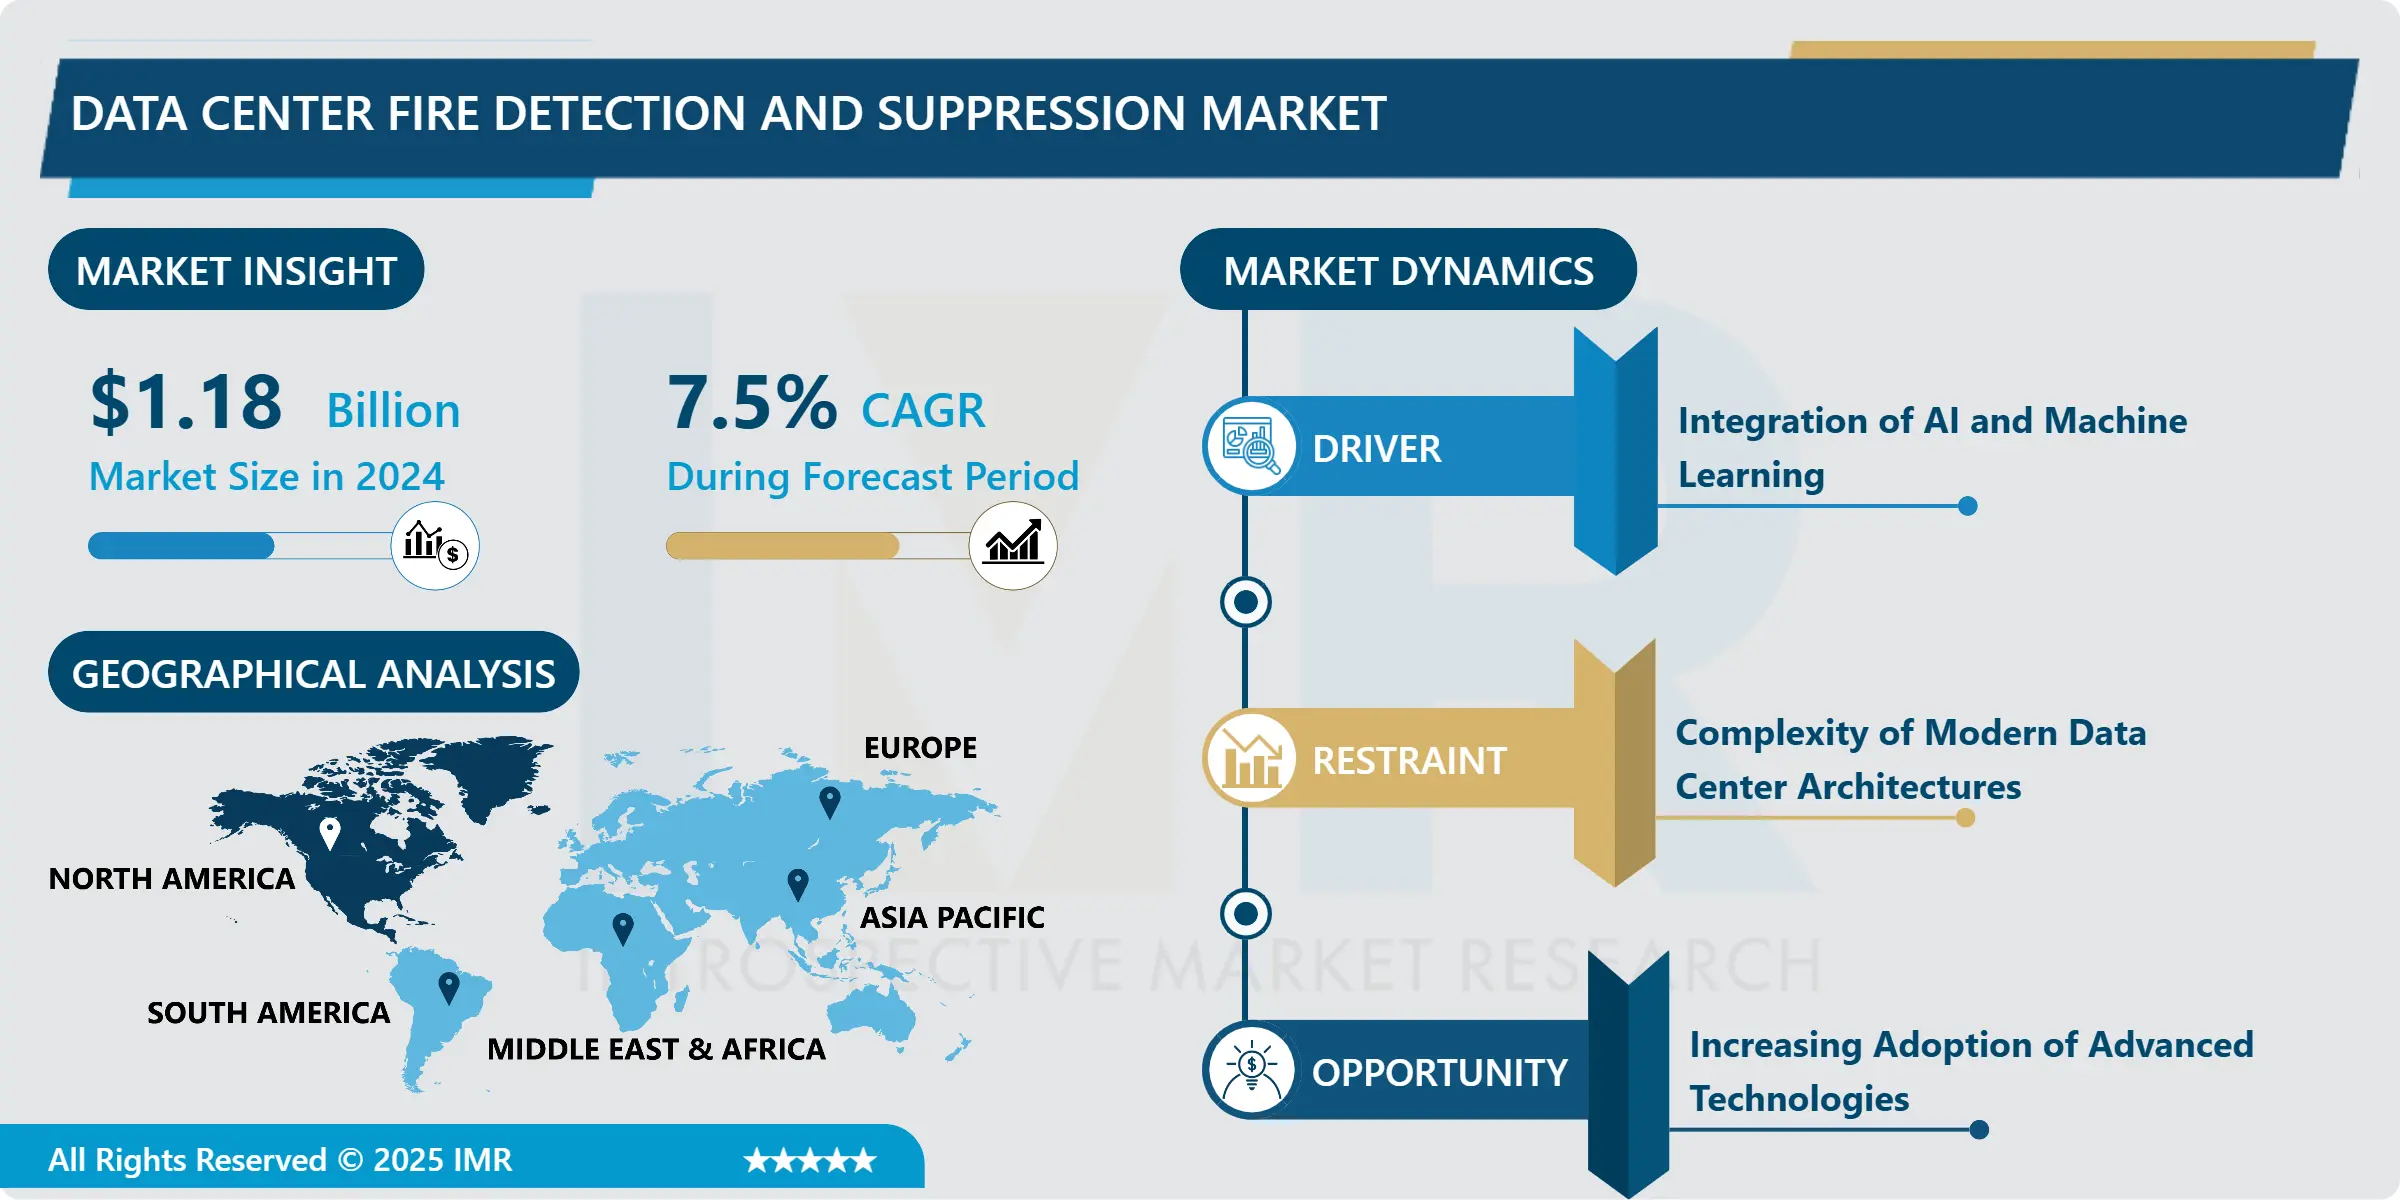
Data Center Fire Detection and Suppression Market Size Was Valued at USD 1.18 Billion in 2024 and is Projected to Reach USD 2.1 Billion by 2032, Growing at a CAGR of 7.5% From 2025-2032.
Data Center Fire Detection and Suppression entails the systems and technologies used to prevent fire occurrence within the data center and if it occurs, it brings under control. These systems are important in protecting the valuable information and tools, and making certain that the firm remains functional. They commonly featured improved smoke detector systems, fire alarms, and fire extinguishing tools that are clean agents or gaseous substances. Data center fire detection and suppression are essential in minimizing and preventing the occurrence of fires, which led to immense data loss and high costs of downtime. These systems help in quick action and prevent extensive damage by identifying fires in their initial stages and uses suitable extinguishing mechanisms that do not pose any threats to valuable electrical appliances.
Data centers are planned and built for mission critical purposes to process data from consumers and business end-users. Telecommunication broadband connectivity or fiber optic cables interfaced with satellites or satellites link the data centers with customers and companies. They include IT assets like servers, storage, networks and links to process and store users data. They also have power and cooling infrastructures to provide end users highly available, reliable and scalable services. Construction of data centers can cost anywhere from thousands to billions of dollars depending on their location, size, and capacity.
Fire detection and suppression systems are configured and incorporated in data centers to counter fire break out within the facility data floor area, technical zones, and support plant. Recently the fire incidents have caused outages in data centers leading to downtime which has prompted investment in these systems in data centers. Data center operators are incorporating fire suppression systems in a bid to provide the facility with the best form of protection. In the context of fire protection in a data center it is possible to differentiate the rack, room, and building levels. Some standards have been set by the National Fire Protection Association for data center operators around the world. These standards are effective in enabling several facilities with different architectural layouts receive protection for their systems against the dangers of fire.
On the account of increasing demands and challenges within data centers, and the necessity of protecting these essential infrastructures against fire-related threats, the Global Data Center Fire Detection and Suppression Market have seen considerable growth. As the complexity of the data stored in data centers continues to grow, proper and precise detection of fire and getting ready to extinguish it is of great significance. The following factors enshrine this market –Higher regulatory standards for the implementation of appropriate fire safety measures and, an increased use of innovative solutions to counter the threats that may occur.
Moreover, more complex layout of data center architectures in terms of expanded sizes has also contributed to the need for advanced fire detectable and extinguishable infrastructures. Such solutions consist of a scale of uniques including early warning mechanisms, new age suppression chemicals and smart monitoring tools that give quick and accurate responses to fire occurrences. Furthermore, the increase in knowledge among enterprises concerning the potential adversative impact of data center fire occurrences may lead to investment in protective devices to enhance the market impetus. Unquestionably, the need to secure the world’s data centers shall persist as more organizations rely on the facilities as the nervous systems of their operations The Global Data Center Fire Detection and Suppression Market shall therefore, remain on an upward trajectory in the foreseeable future.

Data Center Fire Detection and Suppression Market Trend Analysis
Rising fire incidences at data center facilities
- This is due to the rising fire incidences at data center facilities across the globe and the need to adopt more sensitive smoke detection system and a quick-fire suppression mechanism to prevent fire breakouts and for protection of IT equipments. For example, in November 2020, Global Switch Sydney data center had a power blackout as an effect of a false alarm that triggered the fire suppression and detection systems installed at the computing facility.
- To ensure that such circumstances do not occur, data center operators must pay attention in detailling the appropriate fire suppression and detection systems depending on the needs of the said facility. Some of the vendors providing fire and safety systems are also coming out with new products in terms of minimizing the possibilities of equipment failure. The operators could control the fire systems from the comfort of their desks. There is an increase in construction activities for hyperscale data centers and hence the industry requires fire suppression and detection systems with latest technological features to safeguard their data assets which is expected to bolster the market growth.
Growth in the rack power density
- The rise in the rack power density has led to the evolution of solutions such as a rack-level UPS system and various electricity feeds on racks and facility configurations. Indeed, most of the large and mega data center possess power infrastructure that can support as much as 50 kW of rack density. This installation will also grow further with the new data center projects and create the future demand on power infrastructure solutions in the forecast period.
- On average, the AI workload requires significantly higher energy consumption compared to numerous modern data center power densities per rack that currently stand at 7 kW on the average. Some applications consume more than 30 kW/rack, pushing up rack power density. The specifications for higher rack power density facilities should include equipments for heat and smoke detection and facilities for rapid fire suppression if there is an outbreak of fire or smoke to prevent incidences of fire. This has led to the deployment of over and above fire and safety solutions in a market expected to experience growth.
Data Center Fire Detection and Suppression Market Segment Analysis:
Data Center Fire Detection and Suppression Market is segmented based on Fire Safety Systems, Deployment Locations and Region.
By Fire Safety Systems, fire suppression systems segment is expected to dominate the market during the forecast period
- Depending on the type of fire safety systems, the global data center fire detection and suppression market is segmented into fire detection and fire suppression systems.
- The fire suppression systems segment leads the global market and is anticipated to have a CAGR of 7 percent. This is estimated to grow an average of 45% over the forecast period. The simplest form of extinguishing is the wet pipe sprinkler system. Where pipes are always full of water, one of the possibilities includes false discharge and water leaks or pipe failure. Hence, this system is typically not recommended to be implemented in data centers. Moreover, such occurrences can harm the physical assets or negatively affect service delivery. Therefore, to counteract these problems, welded pipe systems are used, however, mechanical pipe connections are still detected in many existing industrial facilities. Currently data center operators use two types of water based fire suppression methods known as single and double interlock systems.
- Also, the rising cases of data center outages that have been attributed to fire based incidents have made it compulsory for operator’s data centers to go for the procurement of fire based suppression systems. This has led to the expansion of the market through the construction of data center facilities across the world. The construction of hyperscale facilities will also serve as a strong driving force for the market, with core and shell development incorporating these systems throughout the development of the project.
- Fire detectors are important elements of the fire and safety systems used in data center premises. These detectors include sensors that are used to measure the density of the smoke and sound a loud alarm when the density of the smoke is beyond a given limit. There is a wide range of smoke detection methods available, which can be implemented in data centers to produce an initial alarm of fire. The methods of smoke detection generally encompass entities such as spot-type smoke detection, air-aspirating smoke detection, or both. Currently, the most popular approach used in data center is the spot-type smoke detection which is easy to install and less costly.
By Deployment Locations, technical space/room level segment held the largest share in 2024
- The technical space/room level segment takes the largest market share and is predicted to have a CAGR of 7 percent. The New Zealand’s defence budget is expected to grow at a compounded rate of 61% during the forecast period. Room-level fire protection mostly acts on server rooms and data halls. It may even be an on-premise data center facility or simply a data center.
- At the room level the National Fire Protection Association NFPA has established several standard, rules and regulations. The NFPA 75 is the one which defines protection from fire for cables computer equipment and other items. The requirements, addressed in this standard, are basic and pertain to protection of IT infrastructure and areas from fire or its by-products like smoke, corrosion and heat. Furthermore, the revised version of the standard draws extra attention in determining the effect to the use of containment cooling by data center operators. Hence, the sprinkler systems require modification to ensure that they pose protection over other areas that embrace confined aisles.
Data Center Fire Detection and Suppression Market Regional Insights:
North America is Expected to Dominate the Market Over the Forecast period
- Currently, North America is the largest global data center fire detection and suppression market and is expected to grow at a CAGR of 6%. to 36% in the forecasting period, according to the obtained results. Satellites or Telecommunication broadband connectivity link the data centre with the customer and the company through the fiber optic cables. The geographical area is strategic and plays the role of an incumbent in the market of technological innovations within the data center industry. The major leaders operating in North America market include Facebook, Google, Microsoft, AWS, Equinix, Digital Realty, Compass Datacenters, Cologix, Vantage Data Centers, NTT Global Data Centers, QTS Realty Trust, CoreSite Realty, CyrusOne, and Switch. In addition, the US is the pioneer country of the North American region. The need for fire suppression systems has also increased because there has been a rise in the use of data centers in various organizations.
Active Key Players in the Data Center Fire Detection and Suppression Market
- Johnson Controls International plc
- Honeywell International Inc.
- Siemens AG
- VFP Fire Systems, Inc.
- Halma plc
- Hochiki America Corporation
- Fike Corporation
- Gentex Corporation
- Bosch Sicherheitssysteme GmbH
- Minimax GmbH
- Other Active Players
|
Global Data Center Fire Detection and Suppression Market |
|||
|
Base Year: |
2024 |
Forecast Period: |
2025-2032 |
|
Historical Data: |
2018 to 2023 |
Market Size in 2024: |
USD 1.18 Bn. |
|
Forecast Period 2025-32 CAGR: |
7.5% |
Market Size in 2032: |
USD 2.1 Bn. |
|
Segments Covered: |
By Fire Safety Systems |
|
|
|
By Deployment Locations |
|
||
|
By Region |
|
||
|
Key Market Drivers: |
|
||
|
Key Market Restraints: |
|
||
|
Key Opportunities: |
|
||
|
Companies Covered in the report: |
|
||
Chapter 1: Introduction
1.1 Scope and Coverage
Chapter 2:Executive Summary
Chapter 3: Market Landscape
3.1 Market Dynamics
3.1.1 Drivers
3.1.2 Restraints
3.1.3 Opportunities
3.1.4 Challenges
3.2 Market Trend Analysis
3.3 PESTLE Analysis
3.4 Porter's Five Forces Analysis
3.5 Industry Value Chain Analysis
3.6 Ecosystem
3.7 Regulatory Landscape
3.8 Price Trend Analysis
3.9 Patent Analysis
3.10 Technology Evolution
3.11 Investment Pockets
3.12 Import-Export Analysis
Chapter 4: Data Center Fire Detection and Suppression Market by Fire Safety Systems (2018-2032)
4.1 Data Center Fire Detection and Suppression Market Snapshot and Growth Engine
4.2 Market Overview
4.3 Fire Detection
4.3.1 Introduction and Market Overview
4.3.2 Historic and Forecasted Market Size in Value USD and Volume Units
4.3.3 Key Market Trends, Growth Factors, and Opportunities
4.3.4 Geographic Segmentation Analysis
4.4 Fire Suppression
Chapter 5: Data Center Fire Detection and Suppression Market by Deployment Locations (2018-2032)
5.1 Data Center Fire Detection and Suppression Market Snapshot and Growth Engine
5.2 Market Overview
5.3 In-Cabinet Level
5.3.1 Introduction and Market Overview
5.3.2 Historic and Forecasted Market Size in Value USD and Volume Units
5.3.3 Key Market Trends, Growth Factors, and Opportunities
5.3.4 Geographic Segmentation Analysis
5.4 Technical Space/Room Level
5.5 Other Space/Building Level
Chapter 6: Company Profiles and Competitive Analysis
6.1 Competitive Landscape
6.1.1 Competitive Benchmarking
6.1.2 Data Center Fire Detection and Suppression Market Share by Manufacturer (2024)
6.1.3 Industry BCG Matrix
6.1.4 Heat Map Analysis
6.1.5 Mergers and Acquisitions
6.2 CISCO SYSTEMS INC. (U.S.)
6.2.1 Company Overview
6.2.2 Key Executives
6.2.3 Company Snapshot
6.2.4 Role of the Company in the Market
6.2.5 Sustainability and Social Responsibility
6.2.6 Operating Business Segments
6.2.7 Product Portfolio
6.2.8 Business Performance
6.2.9 Key Strategic Moves and Recent Developments
6.2.10 SWOT Analysis
6.3 JUNIPER NETWORKS INC. (U.S.)
6.4 ARISTA NETWORKS INC. (U.S.)
6.5 VMWARE INC. (U.S.)
6.6 HEWLETT PACKARD ENTERPRISE (U.S.)
6.7 DELL INC. (U.S.)
6.8 IBM CORPORATION (U.S.)
6.9 INTEL CORPORATION (U.S.)
6.10 MICROSOFT CORPORATION (U.S.)
6.11 AVAYA INC. (U.S.)
6.12 EXTREME NETWORKS (U.S.)
6.13 EQUINIX INC. (U.S.)
6.14 CURVATURE (U.S.)
6.15 PLURIBUS NETWORKS (U.S.)
6.16 APSTRA (U.S.)
6.17 BROADCOM (U.S.)
6.18 RAHI SYSTEMS (U.S.)
6.19 ALE INTERNATIONAL (FRANCE)
6.20 NEC CORPORATION (JAPAN)
6.21 H3C HOLDING LIMITED (CHINA)
6.22 HUAWEI TECHNOLOGIES CO. LTD. (CHINA)
6.23
Chapter 7: Global Data Center Fire Detection and Suppression Market By Region
7.1 Overview
7.2. North America Data Center Fire Detection and Suppression Market
7.2.1 Key Market Trends, Growth Factors and Opportunities
7.2.2 Top Key Companies
7.2.3 Historic and Forecasted Market Size by Segments
7.2.4 Historic and Forecasted Market Size by Fire Safety Systems
7.2.4.1 Fire Detection
7.2.4.2 Fire Suppression
7.2.5 Historic and Forecasted Market Size by Deployment Locations
7.2.5.1 In-Cabinet Level
7.2.5.2 Technical Space/Room Level
7.2.5.3 Other Space/Building Level
7.2.6 Historic and Forecast Market Size by Country
7.2.6.1 US
7.2.6.2 Canada
7.2.6.3 Mexico
7.3. Eastern Europe Data Center Fire Detection and Suppression Market
7.3.1 Key Market Trends, Growth Factors and Opportunities
7.3.2 Top Key Companies
7.3.3 Historic and Forecasted Market Size by Segments
7.3.4 Historic and Forecasted Market Size by Fire Safety Systems
7.3.4.1 Fire Detection
7.3.4.2 Fire Suppression
7.3.5 Historic and Forecasted Market Size by Deployment Locations
7.3.5.1 In-Cabinet Level
7.3.5.2 Technical Space/Room Level
7.3.5.3 Other Space/Building Level
7.3.6 Historic and Forecast Market Size by Country
7.3.6.1 Russia
7.3.6.2 Bulgaria
7.3.6.3 The Czech Republic
7.3.6.4 Hungary
7.3.6.5 Poland
7.3.6.6 Romania
7.3.6.7 Rest of Eastern Europe
7.4. Western Europe Data Center Fire Detection and Suppression Market
7.4.1 Key Market Trends, Growth Factors and Opportunities
7.4.2 Top Key Companies
7.4.3 Historic and Forecasted Market Size by Segments
7.4.4 Historic and Forecasted Market Size by Fire Safety Systems
7.4.4.1 Fire Detection
7.4.4.2 Fire Suppression
7.4.5 Historic and Forecasted Market Size by Deployment Locations
7.4.5.1 In-Cabinet Level
7.4.5.2 Technical Space/Room Level
7.4.5.3 Other Space/Building Level
7.4.6 Historic and Forecast Market Size by Country
7.4.6.1 Germany
7.4.6.2 UK
7.4.6.3 France
7.4.6.4 The Netherlands
7.4.6.5 Italy
7.4.6.6 Spain
7.4.6.7 Rest of Western Europe
7.5. Asia Pacific Data Center Fire Detection and Suppression Market
7.5.1 Key Market Trends, Growth Factors and Opportunities
7.5.2 Top Key Companies
7.5.3 Historic and Forecasted Market Size by Segments
7.5.4 Historic and Forecasted Market Size by Fire Safety Systems
7.5.4.1 Fire Detection
7.5.4.2 Fire Suppression
7.5.5 Historic and Forecasted Market Size by Deployment Locations
7.5.5.1 In-Cabinet Level
7.5.5.2 Technical Space/Room Level
7.5.5.3 Other Space/Building Level
7.5.6 Historic and Forecast Market Size by Country
7.5.6.1 China
7.5.6.2 India
7.5.6.3 Japan
7.5.6.4 South Korea
7.5.6.5 Malaysia
7.5.6.6 Thailand
7.5.6.7 Vietnam
7.5.6.8 The Philippines
7.5.6.9 Australia
7.5.6.10 New Zealand
7.5.6.11 Rest of APAC
7.6. Middle East & Africa Data Center Fire Detection and Suppression Market
7.6.1 Key Market Trends, Growth Factors and Opportunities
7.6.2 Top Key Companies
7.6.3 Historic and Forecasted Market Size by Segments
7.6.4 Historic and Forecasted Market Size by Fire Safety Systems
7.6.4.1 Fire Detection
7.6.4.2 Fire Suppression
7.6.5 Historic and Forecasted Market Size by Deployment Locations
7.6.5.1 In-Cabinet Level
7.6.5.2 Technical Space/Room Level
7.6.5.3 Other Space/Building Level
7.6.6 Historic and Forecast Market Size by Country
7.6.6.1 Turkiye
7.6.6.2 Bahrain
7.6.6.3 Kuwait
7.6.6.4 Saudi Arabia
7.6.6.5 Qatar
7.6.6.6 UAE
7.6.6.7 Israel
7.6.6.8 South Africa
7.7. South America Data Center Fire Detection and Suppression Market
7.7.1 Key Market Trends, Growth Factors and Opportunities
7.7.2 Top Key Companies
7.7.3 Historic and Forecasted Market Size by Segments
7.7.4 Historic and Forecasted Market Size by Fire Safety Systems
7.7.4.1 Fire Detection
7.7.4.2 Fire Suppression
7.7.5 Historic and Forecasted Market Size by Deployment Locations
7.7.5.1 In-Cabinet Level
7.7.5.2 Technical Space/Room Level
7.7.5.3 Other Space/Building Level
7.7.6 Historic and Forecast Market Size by Country
7.7.6.1 Brazil
7.7.6.2 Argentina
7.7.6.3 Rest of SA
Chapter 8 Analyst Viewpoint and Conclusion
8.1 Recommendations and Concluding Analysis
8.2 Potential Market Strategies
Chapter 9 Research Methodology
9.1 Research Process
9.2 Primary Research
9.3 Secondary Research
|
Global Data Center Fire Detection and Suppression Market |
|||
|
Base Year: |
2024 |
Forecast Period: |
2025-2032 |
|
Historical Data: |
2018 to 2023 |
Market Size in 2024: |
USD 1.18 Bn. |
|
Forecast Period 2025-32 CAGR: |
7.5% |
Market Size in 2032: |
USD 2.1 Bn. |
|
Segments Covered: |
By Fire Safety Systems |
|
|
|
By Deployment Locations |
|
||
|
By Region |
|
||
|
Key Market Drivers: |
|
||
|
Key Market Restraints: |
|
||
|
Key Opportunities: |
|
||
|
Companies Covered in the report: |
|
||


