


Contactless Payment Market Synopsis
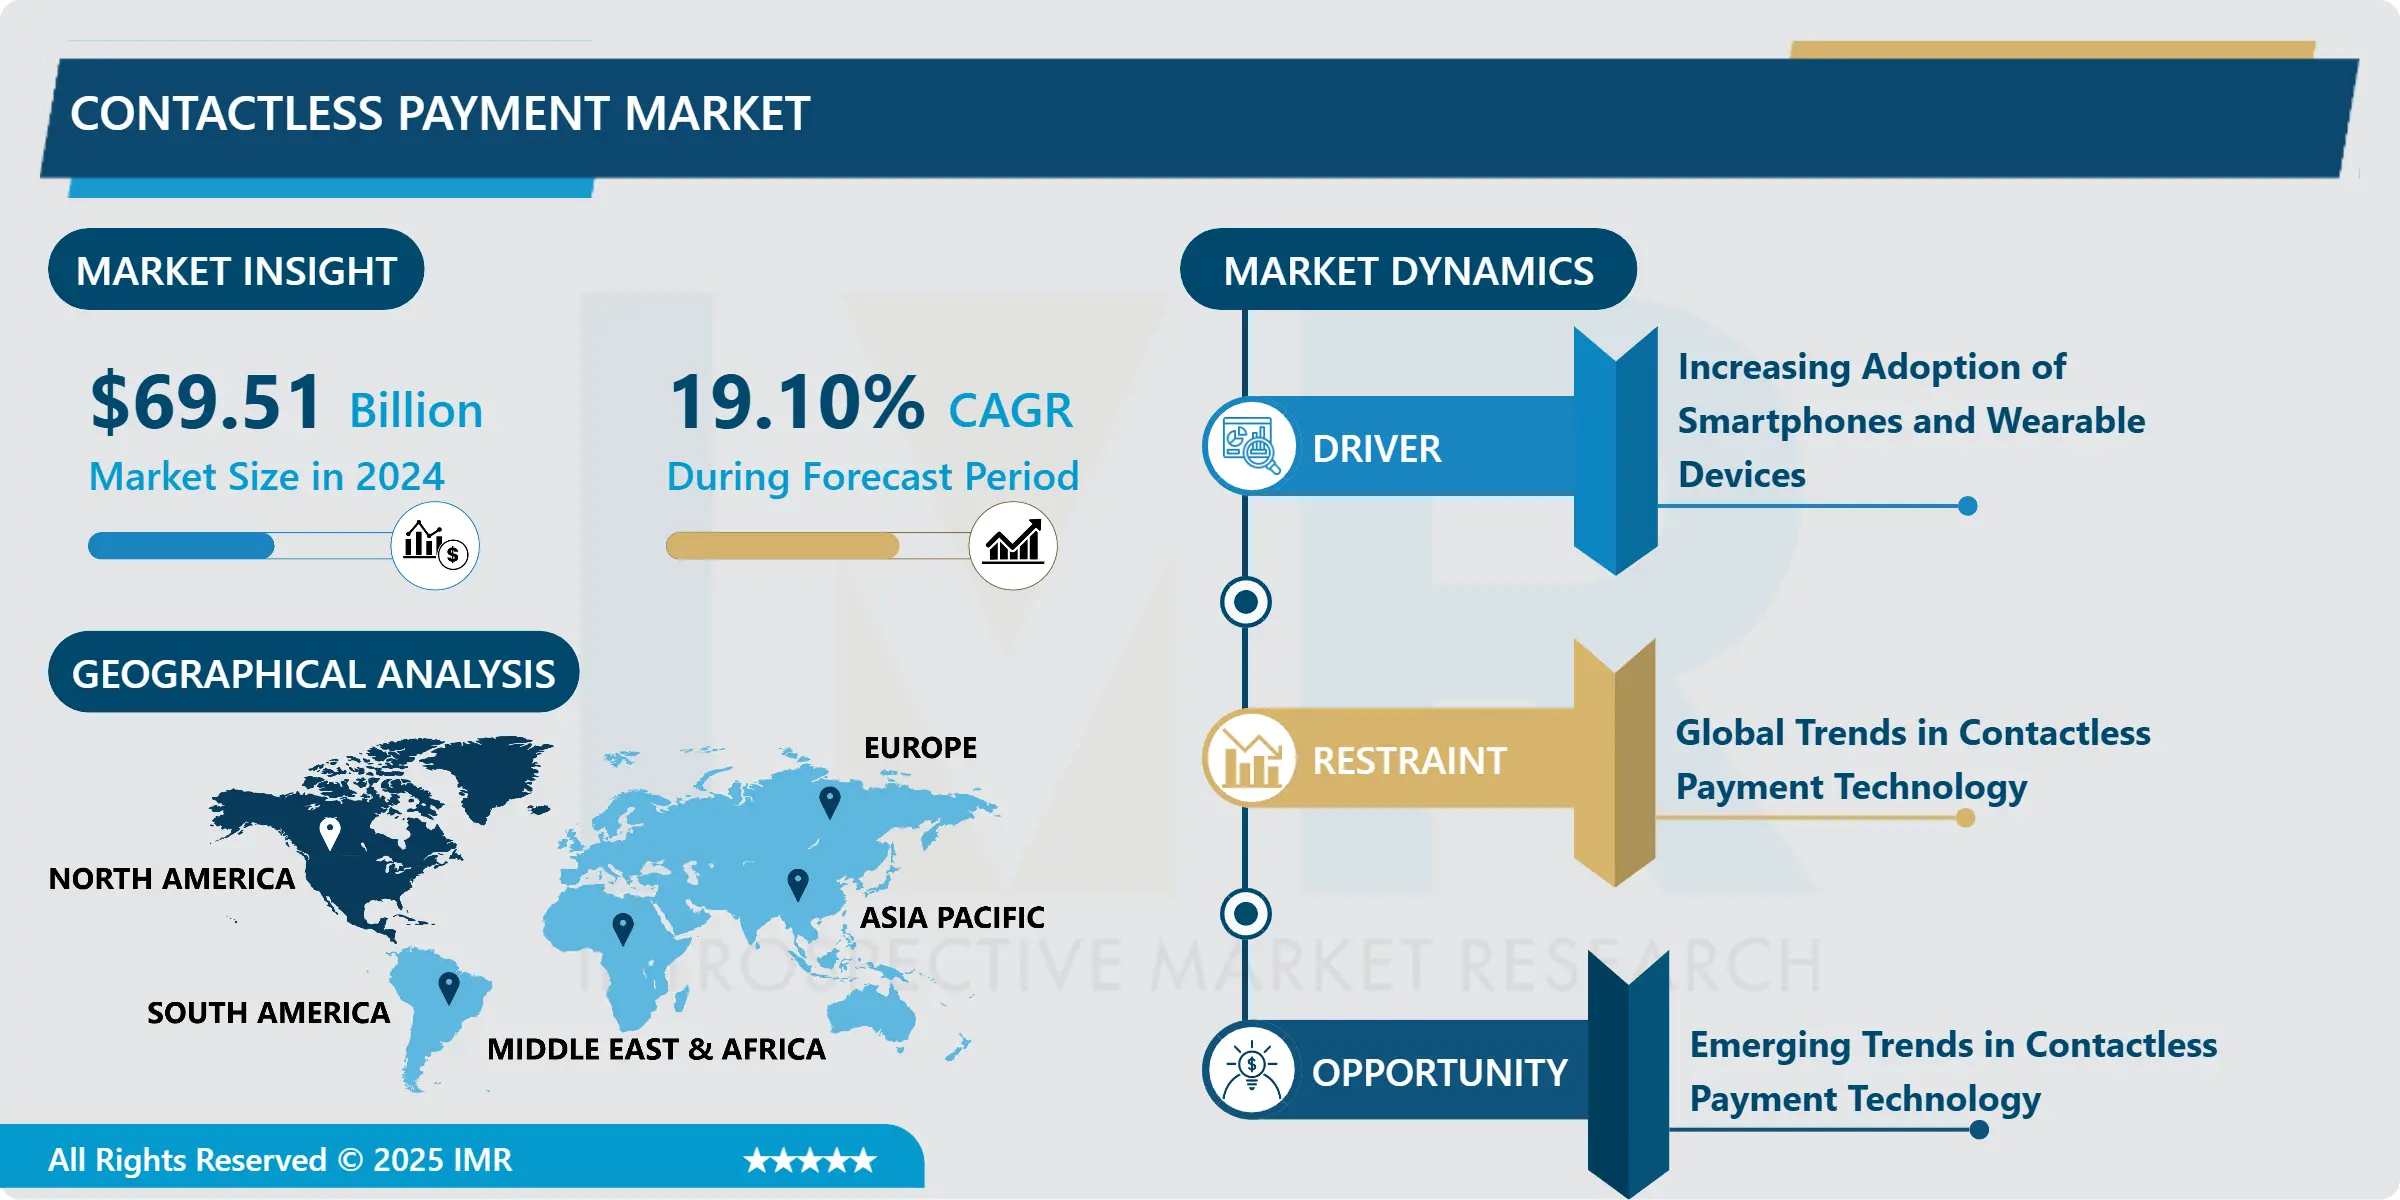
Contactless Payment Market Size is Valued at USD 69.51 Billion in 2024, and is Projected to Reach USD 281.41 Billion by 2032, Growing at a CAGR of 19.10% From 2025-2032.
The global contactless payment market place refers to the systems and technologies that let merchandise through physical contact that is less. This includes but is not limited to Point-of-Sale terminals, smart cards, Near Field Communication Chips, and many more, payment processing software and services, and transaction management software and services. Technological advancement at the center of the market is elements such as Near Field Communication (NFC), Radio Frequency Identification (RFID), and Host Card Emulation (HCE). The market targets different device types such as mobile devices, Wearable devices, Contactless cards and targets all segments of the retail market, transportation, health sectors, and banks. By region, it is present in the North America, Europe, Asia and Pacific, South and Central Americas, and Middle East and Africa regions.
The major driving factor that fuels the contactless payment market is the enhancement in the use of digital payment systems that is hereby accompanied by improving demands for easy, secured, and fast payment solutions. Smart phone usage and mobile wallets are some of the major factors that have boosted the market considerably. Furthermore, changes in near-field communication (NFC) and radio-frequency identification (RFID) have increased the effectivity and safety in periodless charges thus forcing customers and companies to embrace such as medium. The outbreak of the COVID-19 pandemic has also changed the trend of the use of cashless payments, as many people and companies try to avoid any physical contact and thereby the possibility of infecting the virus.
Another positive influencer is the favorable regulations and governmental and financial institutions’ agendas encouraging the use of electronic payments. Many governments worldwide are regulating the initiation of minimal cash use strategies and advocating for the contactless payment methods to boost efficiency and integrity in the sector. Besides, contactless payment solutions’ application in various industries like retail, transportation, and healthcare sector as well as hospitality extended the market’s opportunities. Similarly, the strategic advancements and incremental capital investments of the key players to create higher value contactless payment solutions and facilities are also driving the market.

Contactless Payment Market Trend Analysis
Smartphones, Wearables, and the Rise of Contactless Payments
- The market for contactless payment has been on the rise due to availably of the digital payment method and the time involvement in the transaction process. The COVID-19 pandemic led to the increase of purchasing without direct physical contact with the payment media as customers and merchants looked for less risky ways of completing transactions. Smartphones with NFC technology and increasing usage of contactless POS terminals have also supported this flow over time. In the same respect, the features of innovational payment technologies, which are biometric authentication and the application of blockchain as secure approaches to contactless payments are framing the features of the future contactless payment market.
- Furthermore, smart wearables that have started emerging in the market and the feature of contactless payment which is integrated into smart watches and several fitness trackers are helping in increasing its horizon. More and more financial organizations and payment systems attract technology companies as partners to create new contactless payment systems. The changing consumer behaviour via the use of smart devices is also instrumental in the growth of the market through te use of digital wallets like; Apple Pay, Google Wallet and Samsung Pay among others. It should be noted that there are differences between countries – America and European countries are currently leading in this sphere, while Asia-Pacific region demonstrates high potential of growth because of the high rates of using smartphones and governmental support. Since the adoption of contactless payments is set to increase over the years, due to increased consciousness among the customers and advancement in technologies, the global market is expected to maintain its growth continuously in the future.
Harnessing Contactless Payment Solutions for a Digital Future
- This market proposes the contactless payment due to the increases on the use of digital payments and the demand for more secure payment methods with shorter processing times. Hence, an increase in the availability of smart phones and wearable devices in the market with NFC and RFID capability has provided increased convenience to the consumers in the contactless payment sector. Also, due to the COVID-19 outbreak that made consumers and businesses reduce face-to-face interactions, more consumers and businesses embraced contactless transactions to boost the market. Especially, the level of contactless payments is increasing more and more in the retail industry as a way to provide better experience and make checking easier.
- In addition, it identified that growing markets can be found on emerging economies where governments and financial institutions are focusing on developing more digital environment and encouraging the less cash society. Smart city projects and digital banking reforms which are being implemented are helping in creating a suitable ecosystem needed for growth of contactless payments. I also notice that the transportation and healthcare industries also look towards contactless for optimization and cleanliness. Thus, in the context of constant development of technologies that provide greater security and compatibility, it is possible to state about the continued further development of the market with both the interest of consumers and institutional support.
Contactless Payment Market Segment Analysis:
Contactless Payment Market Segmented on the basis of type, application, and end-users.
By Component, Software segment is expected to dominate the market during the forecast period
- The contactless payment market is segmented by component into three main categories: primary components which are hardware, software, and services. POS terminals and smart cards, NFC chips and any other related equipment come under the heading of Hardware. Software consists of the payment gateway solutions, payment processing, and transaction solutions, among others. Services are categorized depending on whether they are professional services or managed services, all of which concern the put into place, support and fine-tuning of the accepted contactless payments options.
By Device Type, Smartphones segment held the largest share in 2024
- The contactless payment market based on the device type is divided into smartphones, smart cards, wearable devices, contactless terminals, and others. As the use of mobile phones become more and more prevalent, especially smartphones that are NFC enabled, consumer are now using the mobile phones for payments instead of cash. Credit cards with chip or magnetic strip information and identity cards are also available for the employees who prefer card-based transactions.
- Smartwatches and fitness trackers are also common form factors because they enable people to make payments conveniently and do not require the ownership of other gadgets. Merchants cannot operate without contactless terminals since these facilitate several types of contactless payments. Other devices under this segment are other convenient payment solutions such as key fobs and tags which enrich the contactless payment market.
Contactless Payment Market Regional Insights:
North America is Expected to Dominate the Market Over the Forecast period
- The North American contactless payment market is growing rapidly due to increasing instances of NFC technology integration across the markets. Due to the well-developed FinTech market and a high level of smartphone usage, contactless payments have emerged earlier in the region. Retailing large stores are adopting contactless payment terminals in the market for fast and efficient payment solutions that meet the consumers’ needs. Furthermore, the current COVID-19 pandemic situation has also fueled the use of contactless payments since consumers are becoming more conscious of health issues concerning hygiene. Thus, besides retail, various transportation facilities and entertainment venues in North America adopt the means of contactless payments to speed up the ticketing processes and optimize the activity.
- Currently, the American and Canadian financial institutes are pushing consumer’s chances to use contactless payment methods, including credit/debit cards with NFC payments and mobile payment applications. Large technology corporations and payment solutions leaders are also ramping up the development of contactless payments integration across devices and platforms. Thus, strong development of such an ecosystem together with constant advancements in payment technologies reveals North America as one of the leading regions of contactless payments’ growth, with further across-industry extension expected over the years to come.
Active Key Players in the Contactless Payment Market
- Thales (France)
- Visa Inc. (United States)
- Giesecke & Devrient GmbH (Germany)
- MasterCard (United States)
- Apple Inc. (United States)
- PayPal Holdings Inc. (United States)
- American Express Company (United States)
- Amazon.com, Inc. (United States)
- Alibaba.com (China)
- PayU (Netherlands)
- Others Active Players
|
Global Contactless Payment Market |
|||
|
Base Year: |
2024 |
Forecast Period: |
2025-2032 |
|
Historical Data: |
2018 to 2023 |
Market Size in 2024: |
USD 69.51 Bn. |
|
Forecast Period 2024-32 CAGR: |
19.10 % |
Market Size in 2032: |
USD 281.41 Bn. |
|
Segments Covered: |
By Component |
|
|
|
Device Type |
|
||
|
By End User |
|
||
|
By Region |
|
||
|
Key Market Drivers: |
|
||
|
Key Market Restraints: |
|
||
|
Key Opportunities: |
|
||
|
Companies Covered in the report: |
|
||
Chapter 1: Introduction
1.1 Scope and Coverage
Chapter 2:Executive Summary
Chapter 3: Market Landscape
3.1 Market Dynamics
3.1.1 Drivers
3.1.2 Restraints
3.1.3 Opportunities
3.1.4 Challenges
3.2 Market Trend Analysis
3.3 PESTLE Analysis
3.4 Porter's Five Forces Analysis
3.5 Industry Value Chain Analysis
3.6 Ecosystem
3.7 Regulatory Landscape
3.8 Price Trend Analysis
3.9 Patent Analysis
3.10 Technology Evolution
3.11 Investment Pockets
3.12 Import-Export Analysis
Chapter 4: Contactless Payment Market by Component (2018-2032)
4.1 Contactless Payment Market Snapshot and Growth Engine
4.2 Market Overview
4.3 Hardware
4.3.1 Introduction and Market Overview
4.3.2 Historic and Forecasted Market Size in Value USD and Volume Units
4.3.3 Key Market Trends, Growth Factors, and Opportunities
4.3.4 Geographic Segmentation Analysis
4.4 Software
4.5 Service
4.6 Device Type
4.7 Smartphones
4.8 Smart Cards
4.9 Wearables
4.10 Contactless Terminals
4.11 Other Devices
Chapter 5: Contactless Payment Market by End User (2018-2032)
5.1 Contactless Payment Market Snapshot and Growth Engine
5.2 Market Overview
5.3 Retail
5.3.1 Introduction and Market Overview
5.3.2 Historic and Forecasted Market Size in Value USD and Volume Units
5.3.3 Key Market Trends, Growth Factors, and Opportunities
5.3.4 Geographic Segmentation Analysis
5.4 Transportation
5.5 Healthcare
5.6 Hospitality
5.7 BFSI
5.8 Government
5.9 Entertainment and Media
5.10 Other
Chapter 6: Company Profiles and Competitive Analysis
6.1 Competitive Landscape
6.1.1 Competitive Benchmarking
6.1.2 Contactless Payment Market Share by Manufacturer (2024)
6.1.3 Industry BCG Matrix
6.1.4 Heat Map Analysis
6.1.5 Mergers and Acquisitions
6.2 THALES (FRANCE)
6.2.1 Company Overview
6.2.2 Key Executives
6.2.3 Company Snapshot
6.2.4 Role of the Company in the Market
6.2.5 Sustainability and Social Responsibility
6.2.6 Operating Business Segments
6.2.7 Product Portfolio
6.2.8 Business Performance
6.2.9 Key Strategic Moves and Recent Developments
6.2.10 SWOT Analysis
6.3 VISA INC. (UNITED STATES)
6.4 GIESECKE & DEVRIENT GMBH (GERMANY)
6.5 MASTERCARD (UNITED STATES)
6.6 APPLE INC. (UNITED STATES)
6.7 PAYPAL HOLDINGS INC. (UNITED STATES)
6.8 AMERICAN EXPRESS COMPANY (UNITED STATES)
6.9 AMAZON.COM INC. (UNITED STATES)
6.10 ALIBABA.COM (CHINA)
6.11 PAYU (NETHERLANDS)
6.12 OTHERS
Chapter 7: Global Contactless Payment Market By Region
7.1 Overview
7.2. North America Contactless Payment Market
7.2.1 Key Market Trends, Growth Factors and Opportunities
7.2.2 Top Key Companies
7.2.3 Historic and Forecasted Market Size by Segments
7.2.4 Historic and Forecasted Market Size by Component
7.2.4.1 Hardware
7.2.4.2 Software
7.2.4.3 Service
7.2.4.4 Device Type
7.2.4.5 Smartphones
7.2.4.6 Smart Cards
7.2.4.7 Wearables
7.2.4.8 Contactless Terminals
7.2.4.9 Other Devices
7.2.5 Historic and Forecasted Market Size by End User
7.2.5.1 Retail
7.2.5.2 Transportation
7.2.5.3 Healthcare
7.2.5.4 Hospitality
7.2.5.5 BFSI
7.2.5.6 Government
7.2.5.7 Entertainment and Media
7.2.5.8 Other
7.2.6 Historic and Forecast Market Size by Country
7.2.6.1 US
7.2.6.2 Canada
7.2.6.3 Mexico
7.3. Eastern Europe Contactless Payment Market
7.3.1 Key Market Trends, Growth Factors and Opportunities
7.3.2 Top Key Companies
7.3.3 Historic and Forecasted Market Size by Segments
7.3.4 Historic and Forecasted Market Size by Component
7.3.4.1 Hardware
7.3.4.2 Software
7.3.4.3 Service
7.3.4.4 Device Type
7.3.4.5 Smartphones
7.3.4.6 Smart Cards
7.3.4.7 Wearables
7.3.4.8 Contactless Terminals
7.3.4.9 Other Devices
7.3.5 Historic and Forecasted Market Size by End User
7.3.5.1 Retail
7.3.5.2 Transportation
7.3.5.3 Healthcare
7.3.5.4 Hospitality
7.3.5.5 BFSI
7.3.5.6 Government
7.3.5.7 Entertainment and Media
7.3.5.8 Other
7.3.6 Historic and Forecast Market Size by Country
7.3.6.1 Russia
7.3.6.2 Bulgaria
7.3.6.3 The Czech Republic
7.3.6.4 Hungary
7.3.6.5 Poland
7.3.6.6 Romania
7.3.6.7 Rest of Eastern Europe
7.4. Western Europe Contactless Payment Market
7.4.1 Key Market Trends, Growth Factors and Opportunities
7.4.2 Top Key Companies
7.4.3 Historic and Forecasted Market Size by Segments
7.4.4 Historic and Forecasted Market Size by Component
7.4.4.1 Hardware
7.4.4.2 Software
7.4.4.3 Service
7.4.4.4 Device Type
7.4.4.5 Smartphones
7.4.4.6 Smart Cards
7.4.4.7 Wearables
7.4.4.8 Contactless Terminals
7.4.4.9 Other Devices
7.4.5 Historic and Forecasted Market Size by End User
7.4.5.1 Retail
7.4.5.2 Transportation
7.4.5.3 Healthcare
7.4.5.4 Hospitality
7.4.5.5 BFSI
7.4.5.6 Government
7.4.5.7 Entertainment and Media
7.4.5.8 Other
7.4.6 Historic and Forecast Market Size by Country
7.4.6.1 Germany
7.4.6.2 UK
7.4.6.3 France
7.4.6.4 The Netherlands
7.4.6.5 Italy
7.4.6.6 Spain
7.4.6.7 Rest of Western Europe
7.5. Asia Pacific Contactless Payment Market
7.5.1 Key Market Trends, Growth Factors and Opportunities
7.5.2 Top Key Companies
7.5.3 Historic and Forecasted Market Size by Segments
7.5.4 Historic and Forecasted Market Size by Component
7.5.4.1 Hardware
7.5.4.2 Software
7.5.4.3 Service
7.5.4.4 Device Type
7.5.4.5 Smartphones
7.5.4.6 Smart Cards
7.5.4.7 Wearables
7.5.4.8 Contactless Terminals
7.5.4.9 Other Devices
7.5.5 Historic and Forecasted Market Size by End User
7.5.5.1 Retail
7.5.5.2 Transportation
7.5.5.3 Healthcare
7.5.5.4 Hospitality
7.5.5.5 BFSI
7.5.5.6 Government
7.5.5.7 Entertainment and Media
7.5.5.8 Other
7.5.6 Historic and Forecast Market Size by Country
7.5.6.1 China
7.5.6.2 India
7.5.6.3 Japan
7.5.6.4 South Korea
7.5.6.5 Malaysia
7.5.6.6 Thailand
7.5.6.7 Vietnam
7.5.6.8 The Philippines
7.5.6.9 Australia
7.5.6.10 New Zealand
7.5.6.11 Rest of APAC
7.6. Middle East & Africa Contactless Payment Market
7.6.1 Key Market Trends, Growth Factors and Opportunities
7.6.2 Top Key Companies
7.6.3 Historic and Forecasted Market Size by Segments
7.6.4 Historic and Forecasted Market Size by Component
7.6.4.1 Hardware
7.6.4.2 Software
7.6.4.3 Service
7.6.4.4 Device Type
7.6.4.5 Smartphones
7.6.4.6 Smart Cards
7.6.4.7 Wearables
7.6.4.8 Contactless Terminals
7.6.4.9 Other Devices
7.6.5 Historic and Forecasted Market Size by End User
7.6.5.1 Retail
7.6.5.2 Transportation
7.6.5.3 Healthcare
7.6.5.4 Hospitality
7.6.5.5 BFSI
7.6.5.6 Government
7.6.5.7 Entertainment and Media
7.6.5.8 Other
7.6.6 Historic and Forecast Market Size by Country
7.6.6.1 Turkiye
7.6.6.2 Bahrain
7.6.6.3 Kuwait
7.6.6.4 Saudi Arabia
7.6.6.5 Qatar
7.6.6.6 UAE
7.6.6.7 Israel
7.6.6.8 South Africa
7.7. South America Contactless Payment Market
7.7.1 Key Market Trends, Growth Factors and Opportunities
7.7.2 Top Key Companies
7.7.3 Historic and Forecasted Market Size by Segments
7.7.4 Historic and Forecasted Market Size by Component
7.7.4.1 Hardware
7.7.4.2 Software
7.7.4.3 Service
7.7.4.4 Device Type
7.7.4.5 Smartphones
7.7.4.6 Smart Cards
7.7.4.7 Wearables
7.7.4.8 Contactless Terminals
7.7.4.9 Other Devices
7.7.5 Historic and Forecasted Market Size by End User
7.7.5.1 Retail
7.7.5.2 Transportation
7.7.5.3 Healthcare
7.7.5.4 Hospitality
7.7.5.5 BFSI
7.7.5.6 Government
7.7.5.7 Entertainment and Media
7.7.5.8 Other
7.7.6 Historic and Forecast Market Size by Country
7.7.6.1 Brazil
7.7.6.2 Argentina
7.7.6.3 Rest of SA
Chapter 8 Analyst Viewpoint and Conclusion
8.1 Recommendations and Concluding Analysis
8.2 Potential Market Strategies
Chapter 9 Research Methodology
9.1 Research Process
9.2 Primary Research
9.3 Secondary Research
|
Global Contactless Payment Market |
|||
|
Base Year: |
2024 |
Forecast Period: |
2025-2032 |
|
Historical Data: |
2018 to 2023 |
Market Size in 2024: |
USD 69.51 Bn. |
|
Forecast Period 2024-32 CAGR: |
19.10 % |
Market Size in 2032: |
USD 281.41 Bn. |
|
Segments Covered: |
By Component |
|
|
|
Device Type |
|
||
|
By End User |
|
||
|
By Region |
|
||
|
Key Market Drivers: |
|
||
|
Key Market Restraints: |
|
||
|
Key Opportunities: |
|
||
|
Companies Covered in the report: |
|
||


