


Blockchain in Agriculture Market Synopsis
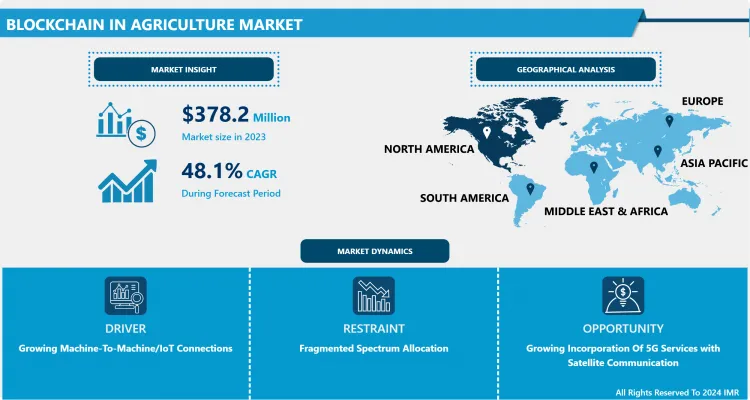
Blockchain in Agriculture Market Size Was Valued at USD 34.12 Million in 2024 and is Projected to Reach USD 789.6 Million by 2032, Growing at a CAGR of 48.1 % From 2025-2032.
A blockchain is a digital transaction ledger, prolonged by a network of multiple computing machines that are not depending on a trusted third party. Individual transaction data files (block) are managed through specific software platforms that allow the data to be transmitted, processed, stored, and represented in a human-readable form.
The blockchain in agriculture market saw increasing adoption globally. Key applications included supply chain management, food safety, and traceability. Farmers, retailers, and consumers benefited from the enhanced visibility into the production and distribution processes, leading to improved trust and reduced fraud.
Smart contracts, a feature of blockchain, were utilized for automating and ensuring the execution of agreements in the agricultural ecosystem. This technology also facilitated quicker and more secure transactions between stakeholders.
The market witnessed collaborations between technology providers and agricultural organizations to implement and scale blockchain solutions. Governments and industry players recognized the transformative impact of blockchain on agriculture, fostering a supportive regulatory environment.

Blockchain in Agriculture Market Trend Analysis
Growing Machine-To-Machine/IoT Connections
- The increasing proliferation of Machine-to-Machine (M2M) and Internet of Things (IoT) connections is a pivotal driving force behind the adoption of blockchain technology in the agriculture sector. As modern farming practices become more data-driven, there is a growing need for secure and transparent systems to manage, verify, and exchange the vast amounts of data generated by these interconnected devices.
- Blockchain, with its decentralized and tamper-resistant ledger, addresses key challenges in agriculture, such as data integrity, traceability, and trust among multiple stakeholders in the supply chain. It allows seamless and secure sharing of real-time information across various devices and entities, enhancing efficiency and reducing the risk of fraudulent activities.
- The integration of blockchain in agriculture facilitates transparent and auditable transactions, ensuring the authenticity of data related to crop conditions, logistics, and quality. Smart contracts, enabled by blockchain, further automate processes and enforce agreements, streamlining operations and reducing the reliance on intermediaries.
Growing Incorporation Of 5G Services with Satellite Communication creates an Opportunity
- The growing incorporation of 5G services with satellite communication presents a significant opportunity for the integration of blockchain technology in the agriculture market. The synergy between 5G and satellite communication enhances connectivity and data transfer capabilities in rural and remote agricultural areas. This improved communication infrastructure enables real-time data collection from various sources, such as sensors, drones, and satellite imagery, fostering a data-rich environment in agriculture.
- Blockchain technology can capitalize on this data abundance by providing a secure and transparent decentralized ledger for recording and managing agricultural transactions, supply chain activities, and smart contracts. The combination of 5G and satellite communication ensures reliable and fast data transmission, facilitating seamless implementation of blockchain applications in agriculture.
Blockchain in Agriculture Market Segment Analysis:
Blockchain in Agriculture Market Segmented on the basis of Type, Provider, and application.
By Provider, the application and solution provider segment are expected to dominate the market during the forecast period
- The application and solution provider segment is poised to exert significant dominance in the Blockchain in Agriculture market. As agriculture increasingly embraces digital transformation, the role of blockchain becomes pivotal in revolutionizing the sector. Application and solution providers play a central role in delivering innovative and tailored blockchain solutions to address the unique challenges faced by the agriculture industry.
- These providers offer a diverse array of applications, ranging from supply chain management and traceability to smart contracts and transparent transactions. By leveraging blockchain, they enable stakeholders in the agricultural value chain to streamline operations, enhance transparency, and mitigate fraud risks. The decentralized and secure nature of blockchain ensures the integrity of data, fostering trust among participants.
By Application, product traceability tracking segment held the largest share
- The product traceability tracking segment is gaining prominence as it addresses critical challenges such as food safety, fraud prevention, and compliance with regulatory standards. By leveraging blockchain, stakeholders in the agricultural supply chain can record and track every stage of production, processing, and distribution, providing a transparent and tamper-resistant record.
- This heightened focus on traceability is crucial for enhancing consumer trust and meeting stringent quality and safety standards. Additionally, blockchain technology facilitates real-time monitoring, reduces inefficiencies, and minimizes the risk of errors or discrepancies in the supply chain.
Blockchain in Agriculture Market Regional Insights:
North America is Expected to Dominate the Market Over the Forecast period
- North America is poised to emerge as a dominant force in the Blockchain in Agriculture market, reflecting a combination of technological prowess and a rapidly evolving agricultural landscape. The region's proactive approach towards embracing cutting-edge technologies, coupled with the robust infrastructure for digital innovation, positions it at the forefront of blockchain adoption in agriculture.
- The implementation of blockchain technology in agriculture brings about transformative changes, addressing challenges such as supply chain inefficiencies, traceability, and data transparency. North American farmers and agribusinesses are increasingly recognizing the potential of blockchain to enhance the entire agricultural value chain, from production to distribution. This technology enables secure and transparent record-keeping, reducing fraud risks and ensuring the integrity of data related to the origin, quality, and handling of agricultural products.
Blockchain in Agriculture Market Top Key Players:
- IBM (USA)
- Microsoft (USA)
- SAP (Germany)
- Oracle (USA)
- Accenture (Ireland)
- Bosch (Germany)
- PwC (United Kingdom)
- Deloitte (USA)
- EY (United Kingdom)
- Amazon Web Services (USA)
- Hyperledger Sawtooth (USA)
- FoodTrust (USA)
- Ripe.io (USA)
- Provenance (United Kingdom)
- Skuchain (USA)
- Everledger (United Kingdom)
- Blockchain Foundry (USA)
- The VeChain Foundation (Singapore)
- Guardtime (Estonia)
- and Other Active Players
Key Industry Developments in the Blockchain in Agriculture Market:
- In Dec 2024, GEMMEST launched its $GEM token, aiming to revolutionize agriculture by integrating blockchain and AI. The token enables transparent supply chain management, equitable farmer compensation, and AI-driven insights for sustainable farming. This innovation seeks to address inefficiencies in traditional agricultural systems, fostering global food security and sustainability. The $GEM token represents a leap forward in combining cutting-edge technology with the urgent need for smarter, fairer agricultural practices worldwide.
- In Sep 2024, The UN's International Fund for Agricultural Development (IFAD) received a global award for its groundbreaking use of blockchain technology to enhance fund traceability. This innovation ensures transparency and accountability in tracking the flow of development funds, particularly for rural and agricultural projects.
|
Global Blockchain in Agriculture Market |
|||
|
Base Year: |
2024 |
Forecast Period: |
2025-2032 |
|
Historical Data: |
2018 to 2023 |
Market Size in 2024: |
USD 34.12 Mn. |
|
Forecast Period 2025-32 CAGR: |
45.5% |
Market Size in 2032: |
USD 789.6 Mn. |
|
Segments Covered: |
By Type |
|
|
|
By Provider |
|
||
|
By Application |
|
||
|
By Region |
|
||
|
Key Market Drivers: |
|
||
|
Key Market Restraints: |
|
||
|
Key Opportunities: |
|
||
|
Companies Covered in the report: |
|
||
Chapter 1: Introduction
1.1 Scope and Coverage
Chapter 2:Executive Summary
Chapter 3: Market Landscape
3.1 Market Dynamics
3.1.1 Drivers
3.1.2 Restraints
3.1.3 Opportunities
3.1.4 Challenges
3.2 Market Trend Analysis
3.3 PESTLE Analysis
3.4 Porter's Five Forces Analysis
3.5 Industry Value Chain Analysis
3.6 Ecosystem
3.7 Regulatory Landscape
3.8 Price Trend Analysis
3.9 Patent Analysis
3.10 Technology Evolution
3.11 Investment Pockets
3.12 Import-Export Analysis
Chapter 4: Blockchain in Agriculture Market by Type (2018-2032)
4.1 Blockchain in Agriculture Market Snapshot and Growth Engine
4.2 Market Overview
4.3 Public
4.3.1 Introduction and Market Overview
4.3.2 Historic and Forecasted Market Size in Value USD and Volume Units
4.3.3 Key Market Trends, Growth Factors, and Opportunities
4.3.4 Geographic Segmentation Analysis
4.4 Private
Chapter 5: Blockchain in Agriculture Market by Provider (2018-2032)
5.1 Blockchain in Agriculture Market Snapshot and Growth Engine
5.2 Market Overview
5.3 Application & Solution Provider
5.3.1 Introduction and Market Overview
5.3.2 Historic and Forecasted Market Size in Value USD and Volume Units
5.3.3 Key Market Trends, Growth Factors, and Opportunities
5.3.4 Geographic Segmentation Analysis
5.4 Middleware Provider
5.5 Infrastructure & Protocol Provider
Chapter 6: Blockchain in Agriculture Market by Application (2018-2032)
6.1 Blockchain in Agriculture Market Snapshot and Growth Engine
6.2 Market Overview
6.3 Product Traceability
6.3.1 Introduction and Market Overview
6.3.2 Historic and Forecasted Market Size in Value USD and Volume Units
6.3.3 Key Market Trends, Growth Factors, and Opportunities
6.3.4 Geographic Segmentation Analysis
6.4 Tracking & Visibility
6.5 Payment & Settlement
6.6 Smart Contracts
6.7 Risk & Compliance Management
6.8 Governance
Chapter 7: Company Profiles and Competitive Analysis
7.1 Competitive Landscape
7.1.1 Competitive Benchmarking
7.1.2 Blockchain in Agriculture Market Share by Manufacturer (2024)
7.1.3 Industry BCG Matrix
7.1.4 Heat Map Analysis
7.1.5 Mergers and Acquisitions
7.2 MONDELEZ INTERNATIONAL (US)
7.2.1 Company Overview
7.2.2 Key Executives
7.2.3 Company Snapshot
7.2.4 Role of the Company in the Market
7.2.5 Sustainability and Social Responsibility
7.2.6 Operating Business Segments
7.2.7 Product Portfolio
7.2.8 Business Performance
7.2.9 Key Strategic Moves and Recent Developments
7.2.10 SWOT Analysis
7.3 KRAFT HEINZ COMPANY (US)
7.4 KELLOGG COMPANY (US)
7.5 PEPSICO INC. (US)
7.6 CAMPBELL SOUP COMPANY (US)
7.7 MURRAY BISCUIT COMPANY (US)
7.8 BACHELDRE WATERMILL (UK)
7.9 COLUSSI GROUP (ITALY)
7.10 BAHLSEN GMBH & CO. KG (GERMANY)
7.11 BURTON'S BISCUIT COMPANY (UK)
7.12 NESTLÉ S.A.(SWITZERLAND)
7.13 PLADIS GLOBAL (UK)
7.14 DANONE S.A. (FRANCE)
7.15 FERRERO GROUP (ITALY)
7.16 UNITED BISCUITS (MCVITIE'S) -(UK)
7.17 LOTUS BAKERIES (BELGIUM)
7.18 MAYORA INDAH TBK (INDONESIA)
7.19 MONDEL?Z RUS LLC - PART OF MONDELEZ INTERNATIONAL (RUSSIA)
7.20 GROUPE POULT (FRANCE)
7.21 ARCOR GROUP (ARGENTINA)
7.22 DALI GROUP (CHINA)
7.23 BRITANNIA INDUSTRIES LIMITED (INDIA)
7.24 PARLE PRODUCTS PVT. LTD. (INDIA)
7.25 MEIJI HOLDINGS COLTD. (JAPAN)
7.26 YILDIZ HOLDING (TURKEY)
Chapter 8: Global Blockchain in Agriculture Market By Region
8.1 Overview
8.2. North America Blockchain in Agriculture Market
8.2.1 Key Market Trends, Growth Factors and Opportunities
8.2.2 Top Key Companies
8.2.3 Historic and Forecasted Market Size by Segments
8.2.4 Historic and Forecasted Market Size by Type
8.2.4.1 Public
8.2.4.2 Private
8.2.5 Historic and Forecasted Market Size by Provider
8.2.5.1 Application & Solution Provider
8.2.5.2 Middleware Provider
8.2.5.3 Infrastructure & Protocol Provider
8.2.6 Historic and Forecasted Market Size by Application
8.2.6.1 Product Traceability
8.2.6.2 Tracking & Visibility
8.2.6.3 Payment & Settlement
8.2.6.4 Smart Contracts
8.2.6.5 Risk & Compliance Management
8.2.6.6 Governance
8.2.7 Historic and Forecast Market Size by Country
8.2.7.1 US
8.2.7.2 Canada
8.2.7.3 Mexico
8.3. Eastern Europe Blockchain in Agriculture Market
8.3.1 Key Market Trends, Growth Factors and Opportunities
8.3.2 Top Key Companies
8.3.3 Historic and Forecasted Market Size by Segments
8.3.4 Historic and Forecasted Market Size by Type
8.3.4.1 Public
8.3.4.2 Private
8.3.5 Historic and Forecasted Market Size by Provider
8.3.5.1 Application & Solution Provider
8.3.5.2 Middleware Provider
8.3.5.3 Infrastructure & Protocol Provider
8.3.6 Historic and Forecasted Market Size by Application
8.3.6.1 Product Traceability
8.3.6.2 Tracking & Visibility
8.3.6.3 Payment & Settlement
8.3.6.4 Smart Contracts
8.3.6.5 Risk & Compliance Management
8.3.6.6 Governance
8.3.7 Historic and Forecast Market Size by Country
8.3.7.1 Russia
8.3.7.2 Bulgaria
8.3.7.3 The Czech Republic
8.3.7.4 Hungary
8.3.7.5 Poland
8.3.7.6 Romania
8.3.7.7 Rest of Eastern Europe
8.4. Western Europe Blockchain in Agriculture Market
8.4.1 Key Market Trends, Growth Factors and Opportunities
8.4.2 Top Key Companies
8.4.3 Historic and Forecasted Market Size by Segments
8.4.4 Historic and Forecasted Market Size by Type
8.4.4.1 Public
8.4.4.2 Private
8.4.5 Historic and Forecasted Market Size by Provider
8.4.5.1 Application & Solution Provider
8.4.5.2 Middleware Provider
8.4.5.3 Infrastructure & Protocol Provider
8.4.6 Historic and Forecasted Market Size by Application
8.4.6.1 Product Traceability
8.4.6.2 Tracking & Visibility
8.4.6.3 Payment & Settlement
8.4.6.4 Smart Contracts
8.4.6.5 Risk & Compliance Management
8.4.6.6 Governance
8.4.7 Historic and Forecast Market Size by Country
8.4.7.1 Germany
8.4.7.2 UK
8.4.7.3 France
8.4.7.4 The Netherlands
8.4.7.5 Italy
8.4.7.6 Spain
8.4.7.7 Rest of Western Europe
8.5. Asia Pacific Blockchain in Agriculture Market
8.5.1 Key Market Trends, Growth Factors and Opportunities
8.5.2 Top Key Companies
8.5.3 Historic and Forecasted Market Size by Segments
8.5.4 Historic and Forecasted Market Size by Type
8.5.4.1 Public
8.5.4.2 Private
8.5.5 Historic and Forecasted Market Size by Provider
8.5.5.1 Application & Solution Provider
8.5.5.2 Middleware Provider
8.5.5.3 Infrastructure & Protocol Provider
8.5.6 Historic and Forecasted Market Size by Application
8.5.6.1 Product Traceability
8.5.6.2 Tracking & Visibility
8.5.6.3 Payment & Settlement
8.5.6.4 Smart Contracts
8.5.6.5 Risk & Compliance Management
8.5.6.6 Governance
8.5.7 Historic and Forecast Market Size by Country
8.5.7.1 China
8.5.7.2 India
8.5.7.3 Japan
8.5.7.4 South Korea
8.5.7.5 Malaysia
8.5.7.6 Thailand
8.5.7.7 Vietnam
8.5.7.8 The Philippines
8.5.7.9 Australia
8.5.7.10 New Zealand
8.5.7.11 Rest of APAC
8.6. Middle East & Africa Blockchain in Agriculture Market
8.6.1 Key Market Trends, Growth Factors and Opportunities
8.6.2 Top Key Companies
8.6.3 Historic and Forecasted Market Size by Segments
8.6.4 Historic and Forecasted Market Size by Type
8.6.4.1 Public
8.6.4.2 Private
8.6.5 Historic and Forecasted Market Size by Provider
8.6.5.1 Application & Solution Provider
8.6.5.2 Middleware Provider
8.6.5.3 Infrastructure & Protocol Provider
8.6.6 Historic and Forecasted Market Size by Application
8.6.6.1 Product Traceability
8.6.6.2 Tracking & Visibility
8.6.6.3 Payment & Settlement
8.6.6.4 Smart Contracts
8.6.6.5 Risk & Compliance Management
8.6.6.6 Governance
8.6.7 Historic and Forecast Market Size by Country
8.6.7.1 Turkiye
8.6.7.2 Bahrain
8.6.7.3 Kuwait
8.6.7.4 Saudi Arabia
8.6.7.5 Qatar
8.6.7.6 UAE
8.6.7.7 Israel
8.6.7.8 South Africa
8.7. South America Blockchain in Agriculture Market
8.7.1 Key Market Trends, Growth Factors and Opportunities
8.7.2 Top Key Companies
8.7.3 Historic and Forecasted Market Size by Segments
8.7.4 Historic and Forecasted Market Size by Type
8.7.4.1 Public
8.7.4.2 Private
8.7.5 Historic and Forecasted Market Size by Provider
8.7.5.1 Application & Solution Provider
8.7.5.2 Middleware Provider
8.7.5.3 Infrastructure & Protocol Provider
8.7.6 Historic and Forecasted Market Size by Application
8.7.6.1 Product Traceability
8.7.6.2 Tracking & Visibility
8.7.6.3 Payment & Settlement
8.7.6.4 Smart Contracts
8.7.6.5 Risk & Compliance Management
8.7.6.6 Governance
8.7.7 Historic and Forecast Market Size by Country
8.7.7.1 Brazil
8.7.7.2 Argentina
8.7.7.3 Rest of SA
Chapter 9 Analyst Viewpoint and Conclusion
9.1 Recommendations and Concluding Analysis
9.2 Potential Market Strategies
Chapter 10 Research Methodology
10.1 Research Process
10.2 Primary Research
10.3 Secondary Research
|
Global Blockchain in Agriculture Market |
|||
|
Base Year: |
2024 |
Forecast Period: |
2025-2032 |
|
Historical Data: |
2018 to 2023 |
Market Size in 2024: |
USD 34.12 Mn. |
|
Forecast Period 2025-32 CAGR: |
45.5% |
Market Size in 2032: |
USD 789.6 Mn. |
|
Segments Covered: |
By Type |
|
|
|
By Provider |
|
||
|
By Application |
|
||
|
By Region |
|
||
|
Key Market Drivers: |
|
||
|
Key Market Restraints: |
|
||
|
Key Opportunities: |
|
||
|
Companies Covered in the report: |
|
||


