


Biologic Therapy Market Synopsis:
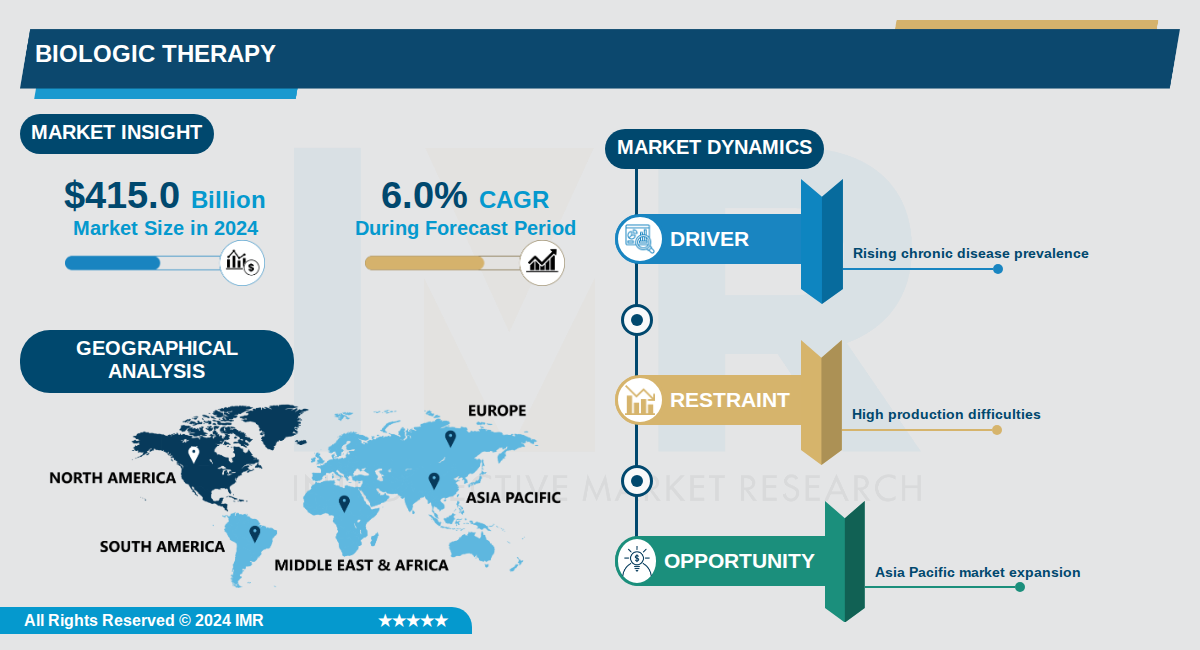
Biologic Therapy Size Was Valued at USD 415.0 Billion in 2024, and is Projected to Reach USD 730.0 Billion by 2035, Growing at a CAGR of 6.0% From 2024-2035.
The global biologic therapeutics market is experiencing robust expansion, valued at approximately $415.0 billion in 2024 and projected to reach $730.0 billion by 2035, representing a compound annual growth rate (CAGR) of 6.0%. This steady growth reflects the increasing adoption of biologic drugs across healthcare systems worldwide, driven by their superior efficacy and targeted therapeutic mechanisms compared to conventional pharmaceuticals. Biologic therapeutics, derived from living organisms, represent a transformative category within the broader therapeutics landscape, encompassing monoclonal antibodies, recombinant proteins, vaccines, and emerging modalities such as antisense and RNAi therapeutics.
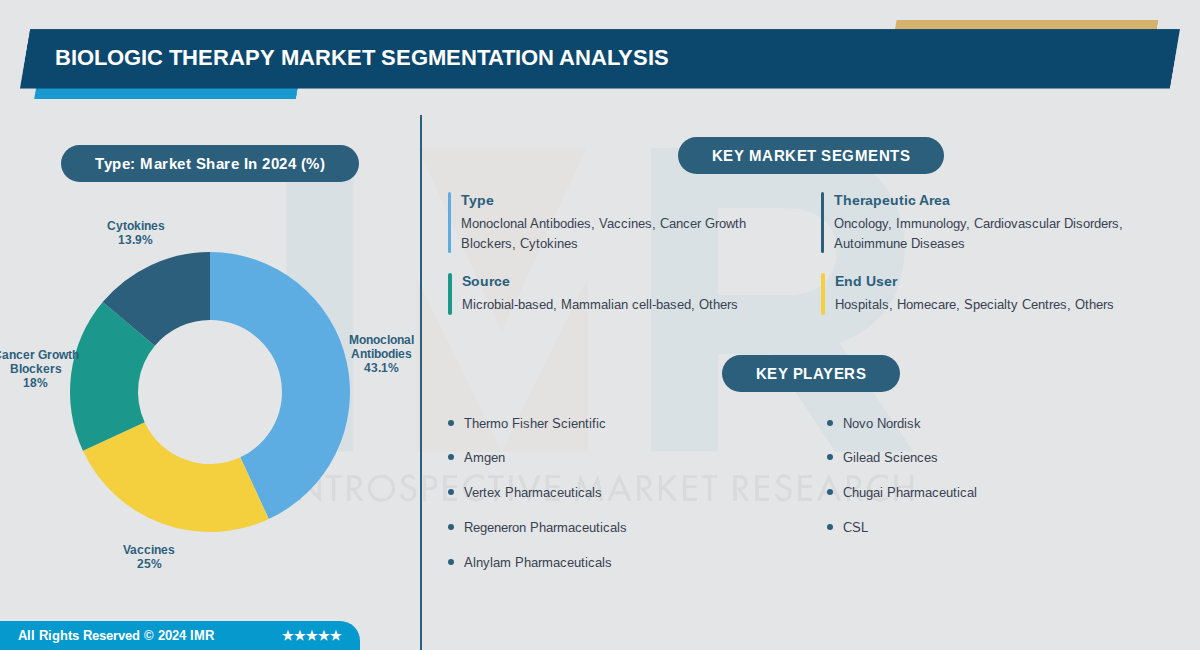
Monoclonal antibodies (mAbs) constitute the dominant product segment, accounting for the largest revenue share in the market. These biologics are characterized by their high specificity, extended half-lives, and favorable safety profiles, contributing to their widespread clinical adoption and increasing FDA approvals. The market segmentation also includes vaccines, recombinant proteins, and rapidly growing antisense and RNAi therapeutics, which are projected to register the fastest growth rates during the forecast period.
Geographic distribution of the biologic therapeutics market reflects significant regional variation, with North America commanding the largest market share at 54.7% of global revenue in 2024. The U.S. is projected to lead in absolute market revenue, while emerging markets in Asia-Pacific are anticipated to experience the fastest growth trajectories. This geographic expansion indicates increasing global access to biologic therapies and the emergence of new manufacturing and distribution capabilities across diverse regions.
Biologic Therapy Market Trend Analysis:
Rising Adoption of Monoclonal Antibodies
- Monoclonal antibodies dominate the biologics market, accounting for 56.48% share in 2025 according to Precedence Research, driven by their precision in targeting diseases like cancer and autoimmune disorders. Companies like Roche and Amgen lead with products such as Rituxan and Enbrel, which have generated billions in annual revenue. The oncology segment is growing rapidly due to rising cancer incidence and R&D in gene treatments and antisense therapeutics.
- In North America, which holds over 44.53% market share, the US FDA approved 21 Biologics License Applications in 2021, many involving monoclonal antibodies, boosting market expansion. These therapies reduce adverse effects from chemotherapy, improving patient outcomes in treatments for rheumatoid arthritis and Crohn's disease. Therapeutic proteins alongside monoclonal antibodies are seeing increased prescriptions through hospital pharmacies.
- Global market projections show biologics reaching USD 973.58 billion by 2035 at 8.0% CAGR, with monoclonal antibodies fueling this growth amid declining small molecule drug productivity. Pharmaceutical giants are shifting R&D focus here, with Europe led by Germany benefiting from sophisticated manufacturing and favorable reimbursements.
Expansion of Biosimilars
- Major companies are developing biosimilars as cost-effective alternatives to reference biologics, with no significant differences in safety or efficacy, aiming to reduce treatment costs and increase access. Deloitte's 2026 outlook notes 37% of respondents citing competitive pressure from biosimilars and generics. The biologics market, valued at USD 456.24 billion in 2025, benefits from this trend as biosimilars target high-cost oncology and immunology drugs.
- In the US, where biologics comprise 38% of medication spending, biosimilars like those competing with Humira from AbbVie are gaining traction post-patent cliffs. This expansion supports prescription-based distribution through hospital pharmacies, aligning with the shift to more affordable advanced therapies. Asia Pacific, growing at 11.05% CAGR, sees local manufacturing of biosimilars in India and China due to cost advantages.
- Biosimilars are projected to drive the market from USD 495.56 billion in 2025 to USD 827.24 billion by 2030 at 11.2% CAGR, per The Business Research Company. Collaborations between global firms like Pfizer and regional players accelerate approvals and penetration in Latin America, led by Brazil's rising chronic disease prevalence.
Advancing Next-Generation Biomanufacturing
- Next-generation biomanufacturing enhances efficiency with single-use systems and improved processing capacity, boosting biopharmaceutical production as highlighted by The Business Research Company. Microbial sources dominate with 58.78% share in 2025, and in-house manufacturing holds 83.96%, enabling scalable production of recombinant proteins. Innovations in cell lines and reagents improve biologic efficacy, supporting market growth to USD 540.46 billion in 2026.
- Pharma giants adopt these technologies to accelerate manufacturing, reducing health risks and enabling diverse drug versions. In North America, significant R&D investments and firms like Lonza drive this trend, with the US market prominent due to high FDA-approved biologics. Asia Pacific's rapid infrastructure expansion in China and India leverages cost-effective biomanufacturing for vaccines and therapies.
- This trend addresses capacity needs amid 8.0-11.2% CAGR forecasts, with single-use tech minimizing contamination and speeding synthesis. Europe's strong biotech ecosystem, including Germany's leadership, integrates these advances with public-private partnerships for monoclonal antibodies and cell therapies.
Biologic Therapy Market Segment Analysis:
Biologic Therapy is Segmented on the basis of By Type, By Therapeutic Area, By Source
By Type, Monoclonal Antibodies segment is expected to dominate the market during the forecast period
- Monoclonal antibodies dominate due to their proven efficacy in treating cancers, autoimmune disorders, and inflammatory conditions, with widespread clinical use and ongoing research into next-generation therapies.
- They account for the largest revenue share driven by high demand in oncology and immunology, supported by approvals from major companies like Roche and AbbVie.
By Therapeutic Area, Oncology segment is expected to dominate the market during the forecast period
- Oncology leads as the largest therapeutic area due to the high prevalence of cancer and the effectiveness of biologics like monoclonal antibodies in targeted cancer treatments.
- Biologics in oncology benefit from extensive R&D investments and clinical trial activities, particularly in North America where they hold significant market penetration.
By Source, Microbial-based segment is expected to dominate the market during the forecast period
- Microbial-based biologics dominate due to cost-effective production methods and established applications in manufacturing monoclonal antibodies and vaccines.
- Their scalability and lower production costs make them preferred for high-volume therapies, supporting a majority market share in established markets.
By End User, Hospitals segment is expected to dominate the market during the forecast period
- Hospitals lead due to their specialized infrastructure, trained staff, and equipment needed for administering complex biologics like infusions and monitoring.
- They handle high patient volumes for therapies such as monoclonal antibodies and cytokines, ensuring compliance and cold chain logistics.
Biologic Therapy Market Regional Insights:
North America is Expected to Dominate the Market Over the Forecast Period
- North America holds the largest market share at 44.53% in 2025, valued at approximately USD 197.9 billion. The U.S., Canada, and Mexico comprise this region, with the U.S. being the primary driver due to its advanced pharmaceutical and biotechnology infrastructure. Major biotech hubs including Boston, San Francisco, and San Diego serve as centers for innovation with numerous biotech companies, research institutions, and clinical trial sites.
- The region's dominance is supported by well-established pharmaceutical infrastructure, strong government funding, favorable regulatory frameworks from the FDA, and high healthcare expenditure. In the United States alone, biologics account for around 38% of overall medication spending. The presence of leading global companies such as Amgen, AbbVie, and Pfizer, combined with rapid biosimilar approvals and expanding Contract Development and Manufacturing Organization (CDMO) capacity, reinforces market leadership.
- North America is projected to expand at a CAGR of 10.08% during 2025-2034, driven by growing adoption of personalized medicine and innovative biologic therapies. The region benefits from continuous FDA approval of new biological drugs, with 21 Biologics License Applications approved in 2021 alone, and ongoing investments in gene therapy and RNAi therapeutics accelerating market growth.
Active Key Players in the Biologic Therapy Market:
- Thermo Fisher Scientific (USA)
- Novo Nordisk (Denmark)
- Amgen (USA)
- Gilead Sciences (USA)
- Vertex Pharmaceuticals (USA)
- Chugai Pharmaceutical (Japan)
- Regeneron Pharmaceuticals (USA)
- CSL (Australia)
- Alnylam Pharmaceuticals (USA)
- Samsung Biologics (South Korea)
- Lonza Group (Switzerland)
- Insmed (USA)
- Daiichi Sankyo (Japan)
- WuXi AppTec (China)
- Novartis (Switzerland)
- CRISPR Therapeutics (USA)
- Beam Therapeutics (USA)
- Intellia Therapeutics (USA)
- Sarepta Therapeutics (USA)
- REGENXBIO (USA)
- Other Active Players
|
Biologic Therapy |
|||
|
Base Year: |
2024 |
Forecast Period: |
2024-2035 |
|
Historical Data: |
2017 to 2024 |
Market Size in 2024: |
USD 415.0 Billion |
|
Forecast Period 2024-2035 CAGR: |
6.0 % |
Market Size in 2035: |
USD 730.0 Billion |
|
Segments Covered: |
By Type |
|
|
|
By Therapeutic Area |
|
||
|
By Source |
|
||
|
By End User |
|
||
|
By Region |
|
||
|
Key Market Drivers: |
|
||
|
Key Market Restraints: |
|
||
|
Key Opportunities: |
|
||
|
Companies Covered in the report: |
|
||
Chapter 1: Introduction
1.1 Scope and Coverage
Chapter 2: Executive Summary
Chapter 3: Market Landscape
3.1 Market Dynamics and Opportunity Analysis
3.1.1 Growth Drivers
3.1.2 Limiting Factors
3.1.3 Growth Opportunities
3.1.4 Challenges and Risks
3.2 Market Trend Analysis
3.3 Industry Ecosystem
3.4 Industry Value Chain Mapping
3.5 Strategic PESTLE Overview
3.6 Porter's Five Forces Framework
3.7 Regulatory Framework
3.8 Pricing Trend Analysis
3.9 Intellectual Property Review
3.10 Technology Evolution
3.11 Import-Export Analysis
3.12 Consumer Behavior Analysis
3.13 Investment Pocket Analysis
3.14 Go-To Market Strategy
Chapter 4: Biologic Therapy Market by Type (2017-2035)
4.1 Biologic Therapy Market Snapshot and Growth Engine
4.2 Market Overview
4.3 Monoclonal Antibodies
4.3.1 Introduction and Market Overview
4.3.2 Historic and Forecasted Market Size in Value USD and Volume Units
4.3.3 Key Market Trends, Growth Factors, and Opportunities
4.3.4 Geographic Segmentation Analysis
4.4 Vaccines
4.5 Cancer Growth Blockers
4.6 Cytokines
Chapter 5: Biologic Therapy Market by Therapeutic Area (2017-2035)
5.1 Biologic Therapy Market Snapshot and Growth Engine
5.2 Market Overview
5.3 Oncology
5.3.1 Introduction and Market Overview
5.3.2 Historic and Forecasted Market Size in Value USD and Volume Units
5.3.3 Key Market Trends, Growth Factors, and Opportunities
5.3.4 Geographic Segmentation Analysis
5.4 Immunology
5.5 Cardiovascular Disorders
5.6 Autoimmune Diseases
Chapter 6: Biologic Therapy Market by Source (2017-2035)
6.1 Biologic Therapy Market Snapshot and Growth Engine
6.2 Market Overview
6.3 Microbial-based
6.3.1 Introduction and Market Overview
6.3.2 Historic and Forecasted Market Size in Value USD and Volume Units
6.3.3 Key Market Trends, Growth Factors, and Opportunities
6.3.4 Geographic Segmentation Analysis
6.4 Mammalian cell-based
6.5 Others
Chapter 7: Biologic Therapy Market by End User (2017-2035)
7.1 Biologic Therapy Market Snapshot and Growth Engine
7.2 Market Overview
7.3 Hospitals
7.3.1 Introduction and Market Overview
7.3.2 Historic and Forecasted Market Size in Value USD and Volume Units
7.3.3 Key Market Trends, Growth Factors, and Opportunities
7.3.4 Geographic Segmentation Analysis
7.4 Homecare
7.5 Specialty Centres
7.6 Others
Chapter 8: Company Profiles and Competitive Analysis
8.1 Competitive Landscape
8.1.1 Competitive Benchmarking
8.1.2 Biologic Therapy Market Share by Manufacturer/Service Provider (2024)
8.1.3 Industry BCG Matrix
8.1.4 Partnerships, Mergers & Acquisitions
8.2 THERMO FISHER SCIENTIFIC
8.2.1 Company Overview
8.2.2 Key Executives
8.2.3 Company Snapshot
8.2.4 Role of the Company in the Market
8.2.5 Sustainability and Social Responsibility
8.2.6 Operating Business Segments
8.2.7 Product Portfolio
8.2.8 Business Performance
8.2.9 Recent News & Developments
8.2.10 SWOT Analysis
8.3 NOVO NORDISK
8.4 AMGEN
8.5 GILEAD SCIENCES
8.6 VERTEX PHARMACEUTICALS
8.7 CHUGAI PHARMACEUTICAL
8.8 REGENERON PHARMACEUTICALS
8.9 CSL
8.10 ALNYLAM PHARMACEUTICALS
8.11 SAMSUNG BIOLOGICS
8.12 LONZA GROUP
8.13 INSMED
8.14 DAIICHI SANKYO
8.15 WUXI APPTEC
8.16 NOVARTIS
8.17 CRISPR THERAPEUTICS
8.18 BEAM THERAPEUTICS
8.19 INTELLIA THERAPEUTICS
8.20 SAREPTA THERAPEUTICS
8.21 REGENXBIO
Chapter 9: Global Biologic Therapy Market By Region
9.1 Overview
9.2. North America Biologic Therapy Market
9.2.1 Key Market Trends, Growth Factors and Opportunities
9.2.2 Top Key Companies
9.2.3 Historic and Forecasted Market Size by Segments
9.2.4 Historic and Forecast Market Size by Country
9.3. Eastern Europe Biologic Therapy Market
9.3.1 Key Market Trends, Growth Factors and Opportunities
9.3.2 Top Key Companies
9.3.3 Historic and Forecasted Market Size by Segments
9.3.4 Historic and Forecast Market Size by Country
9.4. Western Europe Biologic Therapy Market
9.4.1 Key Market Trends, Growth Factors and Opportunities
9.4.2 Top Key Companies
9.4.3 Historic and Forecasted Market Size by Segments
9.4.4 Historic and Forecast Market Size by Country
9.5. Asia Pacific Biologic Therapy Market
9.5.1 Key Market Trends, Growth Factors and Opportunities
9.5.2 Top Key Companies
9.5.3 Historic and Forecasted Market Size by Segments
9.5.4 Historic and Forecast Market Size by Country
9.6. Middle East & Africa Biologic Therapy Market
9.6.1 Key Market Trends, Growth Factors and Opportunities
9.6.2 Top Key Companies
9.6.3 Historic and Forecasted Market Size by Segments
9.6.4 Historic and Forecast Market Size by Country
9.7. South America Biologic Therapy Market
9.7.1 Key Market Trends, Growth Factors and Opportunities
9.7.2 Top Key Companies
9.7.3 Historic and Forecasted Market Size by Segments
9.7.4 Historic and Forecast Market Size by Country
Chapter 10: Analyst Viewpoint and Conclusion
Chapter 11: Research Methodology
11.1 Research Process
11.2 Primary Research
11.3 Secondary Research
Chapter 12: Case Study
Chapter 13: Appendix
13.1 Sources
13.2 List of Tables and Figures
13.3 Short Forms and Citations
13.4 Assumption and Conversion
13.5 Disclaimer
|
Biologic Therapy |
|||
|
Base Year: |
2024 |
Forecast Period: |
2024-2035 |
|
Historical Data: |
2017 to 2024 |
Market Size in 2024: |
USD 415.0 Billion |
|
Forecast Period 2024-2035 CAGR: |
6.0 % |
Market Size in 2035: |
USD 730.0 Billion |
|
Segments Covered: |
By Type |
|
|
|
By Therapeutic Area |
|
||
|
By Source |
|
||
|
By End User |
|
||
|
By Region |
|
||
|
Key Market Drivers: |
|
||
|
Key Market Restraints: |
|
||
|
Key Opportunities: |
|
||
|
Companies Covered in the report: |
|
||


