


Vermicompost Market Synopsis
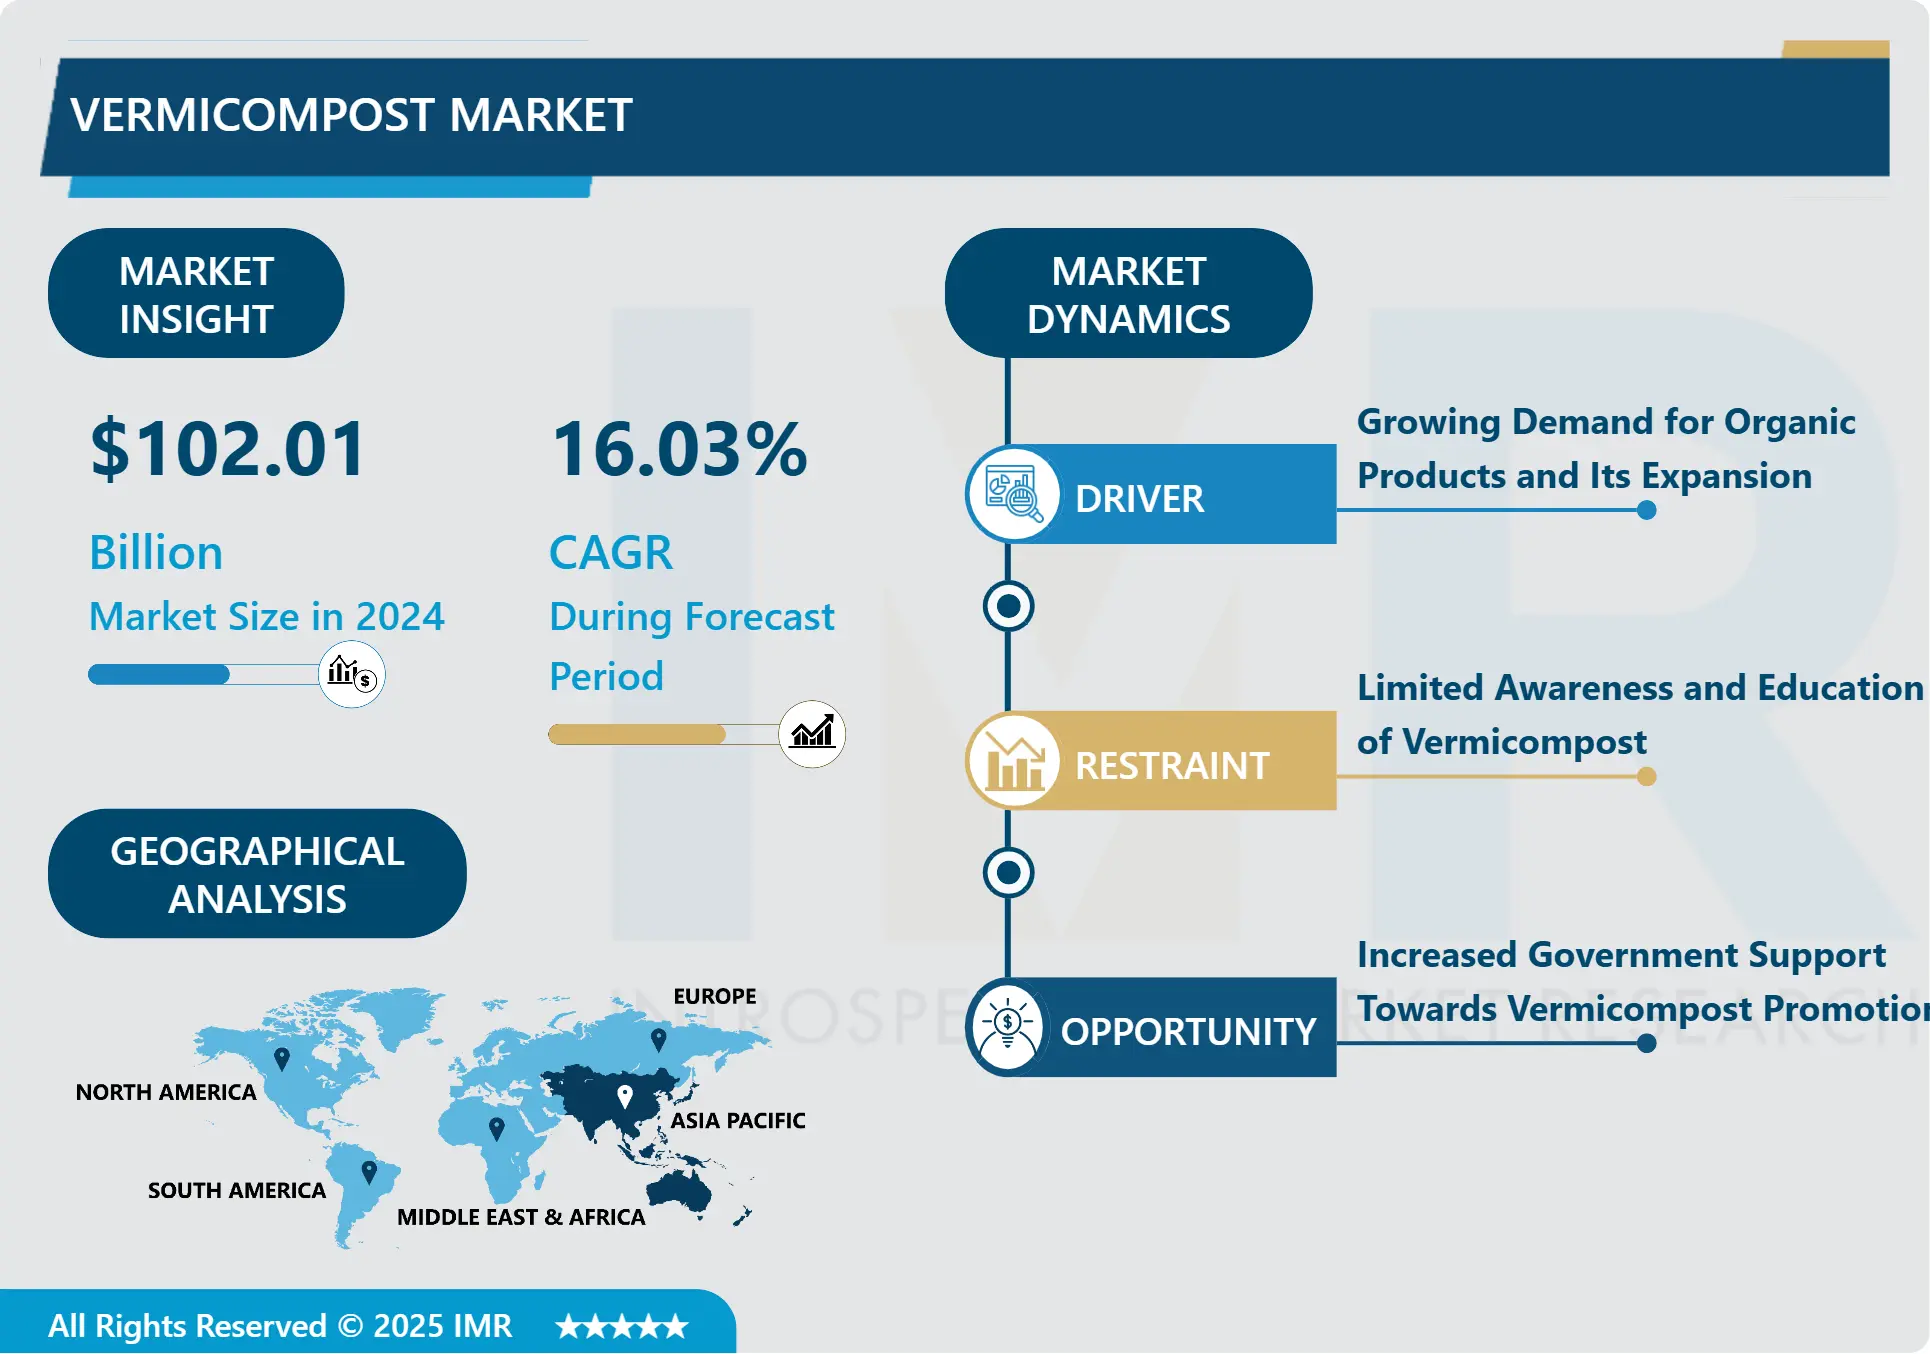
Vermicompost Market Size Was Valued at USD 102.01 Billion in 2024, and is Projected to Reach USD 335.14 Billion by 2032, Growing at a CAGR of 16.03% From 2025-2032.
Vermicomposting is a simple biotechnological composting process that uses certain earthworms to enhance the process of waste conversion to produce good-quality compost. The resultant product is a stabilized, uniformly sized substance with a characteristic earthy appearance known as vermicompost. Vermicomposting differs from composting in several ways as the earthworms are active between 10-32°C (not ambient temperature but temperature within the pile of moist organic material), and the process is faster than composting.
Earthworms consume biomass and excrete it in digested form called worm casts. Worm casts are popularly called as Black gold. The casts are rich in nutrients, growth promoting substances, beneficial soil micro flora and having properties of inhibiting pathogenic microbes. Vermicompost is stable, fine granular organic manure, which enriches soil quality by improving its physicochemical and biological properties. It is highly useful in raising seedlings and for crop production. Vermicompost is becoming popular as a major component of organic farming system. Using Vermicompost can fulfil the requirements for organically grown products.
Vermicompost has been emerging as an important source in supplementing and substituting chemical fertilizers in agriculture. Vermicompost, also known as ‘farmers' friend’ is used for general crops and plantation crops. It is a valuable input for sustainable agriculture and wasteland development. It is a growth promoter and helpful in providing hormones required for plant growth. here is a lot of demand for vermicompost among farmers as its use increases quality of agricultural products and its price is also cheaper. It is also used widely in pot culture and in home gardens.
The nutrient content of vermicompost typically includes nitrogen at levels ranging from 1.5% to 2.5%. Phosphorus is present in vermicompost at concentrations between 0.9% and 1.7%. Potash content falls within the range of 1.5% to 2.4% in vermicompost. Calcium content in vermicompost is typically found to be between 0.5% and 1.0%. Magnesium is present in vermicompost at levels ranging from 0.2% to 0.3%. Sulphur content in vermicompost is typically in the range of 0.4% to 0.5%. Overall, vermicompost is rich in these essential nutrients, making it a valuable organic amendment for soil enrichment and plant growth which increase the market value of Vermicompost Market.

Vermicompost Market Trend Analysis
Vermicompost Market Growth Driver- Growing Demand for Organic Products and Its Expansion
- Increasing consumer awareness about the harmful effects of chemical fertilizers and pesticides on health and the environment has led to a shift towards organic products, including organic fertilizers like vermicompost. Organic farming extends beyond traditional crops to include fruits, vegetables, herbs, and even non-food crops like cotton and medicinal plants, all of which benefit from organic fertilizers like vermicompost.
- Many governments worldwide are promoting organic farming through subsidies, incentives, and regulatory frameworks that encourage sustainable agricultural practices. To label products as organic, farmers must adhere to strict certification standards that require the use of organic inputs like vermicompost. This has stimulated demand within the vermicompost market.
- There is a growing focus on regenerative agriculture practices that improve soil health, biodiversity, and carbon sequestration. Vermicompost plays a crucial role in enhancing soil fertility and structure, making it a preferred choice for organic and regenerative farmers. As consumers seek healthier and environmentally friendly food options, the demand for organic produce has risen, driving the need for organic farming inputs such as vermicompost.
Vermicompost Market Opportunity- Increased Government Support Towards Vermicompost Promotion
- Governments are increasingly focusing on soil health management and pollution prevention strategies. Vermicompost plays a key role in enhancing soil fertility, reducing chemical runoff, and mitigating soil degradation. Promoting organic waste recycling through vermicomposting aligns with circular economy principles, contributing to waste reduction and resource conservation goals.
- Governments can offer financial incentives such as subsidies, grants, and tax breaks to encourage farmers to adopt vermicompost and other organic fertilizers. Also, regulatory frameworks that promote the use of organic inputs and sustainable farming practices can drive the demand for vermicompost. Governments can allocate funds for research and development in vermicompost production technologies, product formulations, and quality standards, fostering innovation and industry growth.
- Governments can conduct awareness campaigns, training programs, and workshops to educate farmers about the benefits of vermicompost and provide technical support for its effective use. Setting up demonstration farms where farmers can see first-hand the positive impact of vermicompost on soil health and crop yield can boost adoption rates.
Nutrient Content of Vermicompost
|
Nitrogen |
1.5 – 2.5% |
|
Phosphorus |
0.9 – 1.7% |
|
Potash |
1.5 – 2.4% |
|
Calcium |
0.5 -1.0% |
|
Magnesium |
0.2 – 0.3% |
|
Sulphur |
0.4 – 0.5% |
Vermicompost Market Segment Analysis:
Vermicompost Market is Segmented on The Basis of Type, Application, and Region.
By Type, Africa Night Crawler’s Vermicomposting segment is expected to dominate the market during the forecast period
- The vermicompost produced by African Night Crawlers is often of high quality, rich in nutrients, microorganisms, and enzymes. This quality makes it desirable for agricultural use, soil improvement, and organic gardening, leading to increased demand. Africa Night Crawlers are native to Africa, so they are well-suited to the local climate and conditions. They may have specific adaptations that make them more efficient at composting in African environments compared to other species.
- Africa Night Crawlers Vermicomposting may benefit from local expertise in vermicomposting techniques, agricultural practices, and infrastructure for distributing vermicompost products. This can streamline production and distribution processes, making them more competitive in the market African Night Crawlers are known for their voracious appetite and high reproduction rates. This means they can consume organic waste quickly and produce nutrient-rich vermicompost at a faster rate than other species.
By Application, Home Gardening Segment Held the Largest Share In 2024
- As urbanization continues, many people are turning to home gardening as a way to connect with nature and grow their own food, even in limited spaces like balconies, rooftops, and small yards. Vermicompost is well-suited for use in container gardening and small-scale cultivation. There has been a significant increase in home gardening activities globally, driven by factors such as increased interest in sustainable living, food security concerns, and a desire for fresh produce.
- Vermicompost is easy to use for home gardeners. It can be applied directly to the soil or mixed into potting mixes and growing media. Its balanced nutrient content and soil conditioning properties make it a versatile choice for various types of plants, including flowers, vegetables, herbs, and ornamentals. Vermicompost is easy to use for home gardeners. It can be applied directly to the soil or mixed into potting mixes and growing media. Its balanced nutrient content and soil conditioning properties make it a versatile choice for various types of plants, including flowers, vegetables, herbs, and ornamentals.
Vermicompost Market Regional Insights:
Asia Pacific is Expected to Dominate the Market Over the Forecast period
- The Asia Pacific region boasts a rich agricultural tradition and holds a significant share of global agricultural land and production, with countries like India, China, and Southeast Asian nations showcasing extensive agricultural landscapes. This, coupled with a large population engaged in farming activities, fuels a substantial demand for agricultural inputs such as vermicompost.
- The region is witnessing a notable shift towards organic farming due to heightened health awareness, environmental concerns, and government-backed initiatives promoting sustainable agricultural practices. Governments in Asia Pacific actively promote organic agriculture through subsidies, incentives, and awareness campaigns, encouraging farmers to embrace organic inputs like vermicompost.
- The focus on sustainable agriculture and food security, driven by the need to feed a large population, further enhances the demand for vermicompost as it plays a crucial role in improving soil fertility, enhancing crop yields, and ensuring overall agricultural sustainability.
Vermicompost Market Key Players
- Worm Power (United States)
- MyNOKE (China)
- NutriSoil (Australia)
- Wormsway (United States)
- Kahariam Farms (Philippines)
- SAOSIS (South Africa)
- Suman Vermi Compost (India)
- Sri Gayathri Biotec (India)
- Sonnenerde (Austria)
- Worm Digest (United States)
- Wasteman (United Kingdom)
- Bangladesh Vermi (Bangladesh)
- Baja Vermicompost (Mexico)
- Florida Earthworm Farm (United States)
- Dirt Hugger (United States)
- Agrilife (India)
- Nongwoo Bio (South Korea)
- Jialiming (China)
- Worm Power Turf (United States)
- SLO County Worm Farm (United States)
- Grow Organic (United States)
- Granja Zayas (Mexico)
- Qingdao Jiaoyang (China)
- Dirt Dynasty (United States) and other active players.
|
Global Vermicompost Market |
|||
|
Base Year: |
2024 |
Forecast Period: |
2025-2032 |
|
Historical Data: |
2018 to 2023 |
Market Size in 2024: |
USD 102.01 Billion |
|
Forecast Period 2025-32 CAGR: |
16.03 % |
Market Size in 2032: |
USD 335.14 Billion |
|
Segments Covered: |
By Type |
|
|
|
By Application |
|
||
|
By Region |
|
||
|
Key Market Drivers: |
|
||
|
Key Market Restraints: |
|
||
|
Key Opportunities: |
|
||
|
Companies Covered in the report: |
Worm Digest (United States), Wasteman (United Kingdom), Bangladesh Vermi (Bangladesh), Baja Vermicompost (Mexico), Florida Earthworm Farm (United States), Dirt Hugger (United States), Agrilife (India), and Other Major Players. |
||
Chapter 1: Introduction
1.1 Scope and Coverage
Chapter 2:Executive Summary
Chapter 3: Market Landscape
3.1 Market Dynamics
3.1.1 Drivers
3.1.2 Restraints
3.1.3 Opportunities
3.1.4 Challenges
3.2 Market Trend Analysis
3.3 PESTLE Analysis
3.4 Porter's Five Forces Analysis
3.5 Industry Value Chain Analysis
3.6 Ecosystem
3.7 Regulatory Landscape
3.8 Price Trend Analysis
3.9 Patent Analysis
3.10 Technology Evolution
3.11 Investment Pockets
3.12 Import-Export Analysis
Chapter 4: Vermicompost Market by Type (2018-2032)
4.1 Vermicompost Market Snapshot and Growth Engine
4.2 Market Overview
4.3 Africa Night Crawler’s Vermicomposting
4.3.1 Introduction and Market Overview
4.3.2 Historic and Forecasted Market Size in Value USD and Volume Units
4.3.3 Key Market Trends, Growth Factors, and Opportunities
4.3.4 Geographic Segmentation Analysis
4.4 Lumbricus Rebellus Vermicomposting
Chapter 5: Vermicompost Market by Application (2018-2032)
5.1 Vermicompost Market Snapshot and Growth Engine
5.2 Market Overview
5.3 Home Gardening
5.3.1 Introduction and Market Overview
5.3.2 Historic and Forecasted Market Size in Value USD and Volume Units
5.3.3 Key Market Trends, Growth Factors, and Opportunities
5.3.4 Geographic Segmentation Analysis
5.4 Landscaping
5.5 Golf Courses
5.6 Horticultural and Agriculture
Chapter 6: Company Profiles and Competitive Analysis
6.1 Competitive Landscape
6.1.1 Competitive Benchmarking
6.1.2 Vermicompost Market Share by Manufacturer (2024)
6.1.3 Industry BCG Matrix
6.1.4 Heat Map Analysis
6.1.5 Mergers and Acquisitions
6.2 WORM POWER (UNITED STATES)
6.2.1 Company Overview
6.2.2 Key Executives
6.2.3 Company Snapshot
6.2.4 Role of the Company in the Market
6.2.5 Sustainability and Social Responsibility
6.2.6 Operating Business Segments
6.2.7 Product Portfolio
6.2.8 Business Performance
6.2.9 Key Strategic Moves and Recent Developments
6.2.10 SWOT Analysis
6.3 MYNOKE (CHINA)
6.4 NUTRISOIL (AUSTRALIA)
6.5 WORMSWAY (UNITED STATES)
6.6 KAHARIAM FARMS (PHILIPPINES)
6.7 SAOSIS (SOUTH AFRICA)
6.8 SUMAN VERMI COMPOST (INDIA)
6.9 SRI GAYATHRI BIOTEC (INDIA)
6.10 SONNENERDE (AUSTRIA)
6.11 WORM DIGEST (UNITED STATES)
6.12 WASTEMAN (UNITED KINGDOM)
6.13 BANGLADESH VERMI (BANGLADESH)
6.14 BAJA VERMICOMPOST (MEXICO)
6.15 FLORIDA EARTHWORM FARM (UNITED STATES)
6.16 DIRT HUGGER (UNITED STATES)
6.17 AGRILIFE (INDIA)
6.18 NONGWOO BIO (SOUTH KOREA)
6.19 JIALIMING (CHINA)
6.20 WORM POWER TURF (UNITED STATES)
6.21 SLO COUNTY WORM FARM (UNITED STATES)
6.22 GROW ORGANIC (UNITED STATES)
6.23 GRANJA ZAYAS (MEXICO)
6.24 QINGDAO JIAOYANG (CHINA)
6.25 DIRT DYNASTY (UNITED STATES)
Chapter 7: Global Vermicompost Market By Region
7.1 Overview
7.2. North America Vermicompost Market
7.2.1 Key Market Trends, Growth Factors and Opportunities
7.2.2 Top Key Companies
7.2.3 Historic and Forecasted Market Size by Segments
7.2.4 Historic and Forecasted Market Size by Type
7.2.4.1 Africa Night Crawler’s Vermicomposting
7.2.4.2 Lumbricus Rebellus Vermicomposting
7.2.5 Historic and Forecasted Market Size by Application
7.2.5.1 Home Gardening
7.2.5.2 Landscaping
7.2.5.3 Golf Courses
7.2.5.4 Horticultural and Agriculture
7.2.6 Historic and Forecast Market Size by Country
7.2.6.1 US
7.2.6.2 Canada
7.2.6.3 Mexico
7.3. Eastern Europe Vermicompost Market
7.3.1 Key Market Trends, Growth Factors and Opportunities
7.3.2 Top Key Companies
7.3.3 Historic and Forecasted Market Size by Segments
7.3.4 Historic and Forecasted Market Size by Type
7.3.4.1 Africa Night Crawler’s Vermicomposting
7.3.4.2 Lumbricus Rebellus Vermicomposting
7.3.5 Historic and Forecasted Market Size by Application
7.3.5.1 Home Gardening
7.3.5.2 Landscaping
7.3.5.3 Golf Courses
7.3.5.4 Horticultural and Agriculture
7.3.6 Historic and Forecast Market Size by Country
7.3.6.1 Russia
7.3.6.2 Bulgaria
7.3.6.3 The Czech Republic
7.3.6.4 Hungary
7.3.6.5 Poland
7.3.6.6 Romania
7.3.6.7 Rest of Eastern Europe
7.4. Western Europe Vermicompost Market
7.4.1 Key Market Trends, Growth Factors and Opportunities
7.4.2 Top Key Companies
7.4.3 Historic and Forecasted Market Size by Segments
7.4.4 Historic and Forecasted Market Size by Type
7.4.4.1 Africa Night Crawler’s Vermicomposting
7.4.4.2 Lumbricus Rebellus Vermicomposting
7.4.5 Historic and Forecasted Market Size by Application
7.4.5.1 Home Gardening
7.4.5.2 Landscaping
7.4.5.3 Golf Courses
7.4.5.4 Horticultural and Agriculture
7.4.6 Historic and Forecast Market Size by Country
7.4.6.1 Germany
7.4.6.2 UK
7.4.6.3 France
7.4.6.4 The Netherlands
7.4.6.5 Italy
7.4.6.6 Spain
7.4.6.7 Rest of Western Europe
7.5. Asia Pacific Vermicompost Market
7.5.1 Key Market Trends, Growth Factors and Opportunities
7.5.2 Top Key Companies
7.5.3 Historic and Forecasted Market Size by Segments
7.5.4 Historic and Forecasted Market Size by Type
7.5.4.1 Africa Night Crawler’s Vermicomposting
7.5.4.2 Lumbricus Rebellus Vermicomposting
7.5.5 Historic and Forecasted Market Size by Application
7.5.5.1 Home Gardening
7.5.5.2 Landscaping
7.5.5.3 Golf Courses
7.5.5.4 Horticultural and Agriculture
7.5.6 Historic and Forecast Market Size by Country
7.5.6.1 China
7.5.6.2 India
7.5.6.3 Japan
7.5.6.4 South Korea
7.5.6.5 Malaysia
7.5.6.6 Thailand
7.5.6.7 Vietnam
7.5.6.8 The Philippines
7.5.6.9 Australia
7.5.6.10 New Zealand
7.5.6.11 Rest of APAC
7.6. Middle East & Africa Vermicompost Market
7.6.1 Key Market Trends, Growth Factors and Opportunities
7.6.2 Top Key Companies
7.6.3 Historic and Forecasted Market Size by Segments
7.6.4 Historic and Forecasted Market Size by Type
7.6.4.1 Africa Night Crawler’s Vermicomposting
7.6.4.2 Lumbricus Rebellus Vermicomposting
7.6.5 Historic and Forecasted Market Size by Application
7.6.5.1 Home Gardening
7.6.5.2 Landscaping
7.6.5.3 Golf Courses
7.6.5.4 Horticultural and Agriculture
7.6.6 Historic and Forecast Market Size by Country
7.6.6.1 Turkiye
7.6.6.2 Bahrain
7.6.6.3 Kuwait
7.6.6.4 Saudi Arabia
7.6.6.5 Qatar
7.6.6.6 UAE
7.6.6.7 Israel
7.6.6.8 South Africa
7.7. South America Vermicompost Market
7.7.1 Key Market Trends, Growth Factors and Opportunities
7.7.2 Top Key Companies
7.7.3 Historic and Forecasted Market Size by Segments
7.7.4 Historic and Forecasted Market Size by Type
7.7.4.1 Africa Night Crawler’s Vermicomposting
7.7.4.2 Lumbricus Rebellus Vermicomposting
7.7.5 Historic and Forecasted Market Size by Application
7.7.5.1 Home Gardening
7.7.5.2 Landscaping
7.7.5.3 Golf Courses
7.7.5.4 Horticultural and Agriculture
7.7.6 Historic and Forecast Market Size by Country
7.7.6.1 Brazil
7.7.6.2 Argentina
7.7.6.3 Rest of SA
Chapter 8 Analyst Viewpoint and Conclusion
8.1 Recommendations and Concluding Analysis
8.2 Potential Market Strategies
Chapter 9 Research Methodology
9.1 Research Process
9.2 Primary Research
9.3 Secondary Research
|
Global Vermicompost Market |
|||
|
Base Year: |
2024 |
Forecast Period: |
2025-2032 |
|
Historical Data: |
2018 to 2023 |
Market Size in 2024: |
USD 102.01 Billion |
|
Forecast Period 2025-32 CAGR: |
16.03 % |
Market Size in 2032: |
USD 335.14 Billion |
|
Segments Covered: |
By Type |
|
|
|
By Application |
|
||
|
By Region |
|
||
|
Key Market Drivers: |
|
||
|
Key Market Restraints: |
|
||
|
Key Opportunities: |
|
||
|
Companies Covered in the report: |
Worm Digest (United States), Wasteman (United Kingdom), Bangladesh Vermi (Bangladesh), Baja Vermicompost (Mexico), Florida Earthworm Farm (United States), Dirt Hugger (United States), Agrilife (India), and Other Major Players. |
||


