


Turbines Market Synopsis
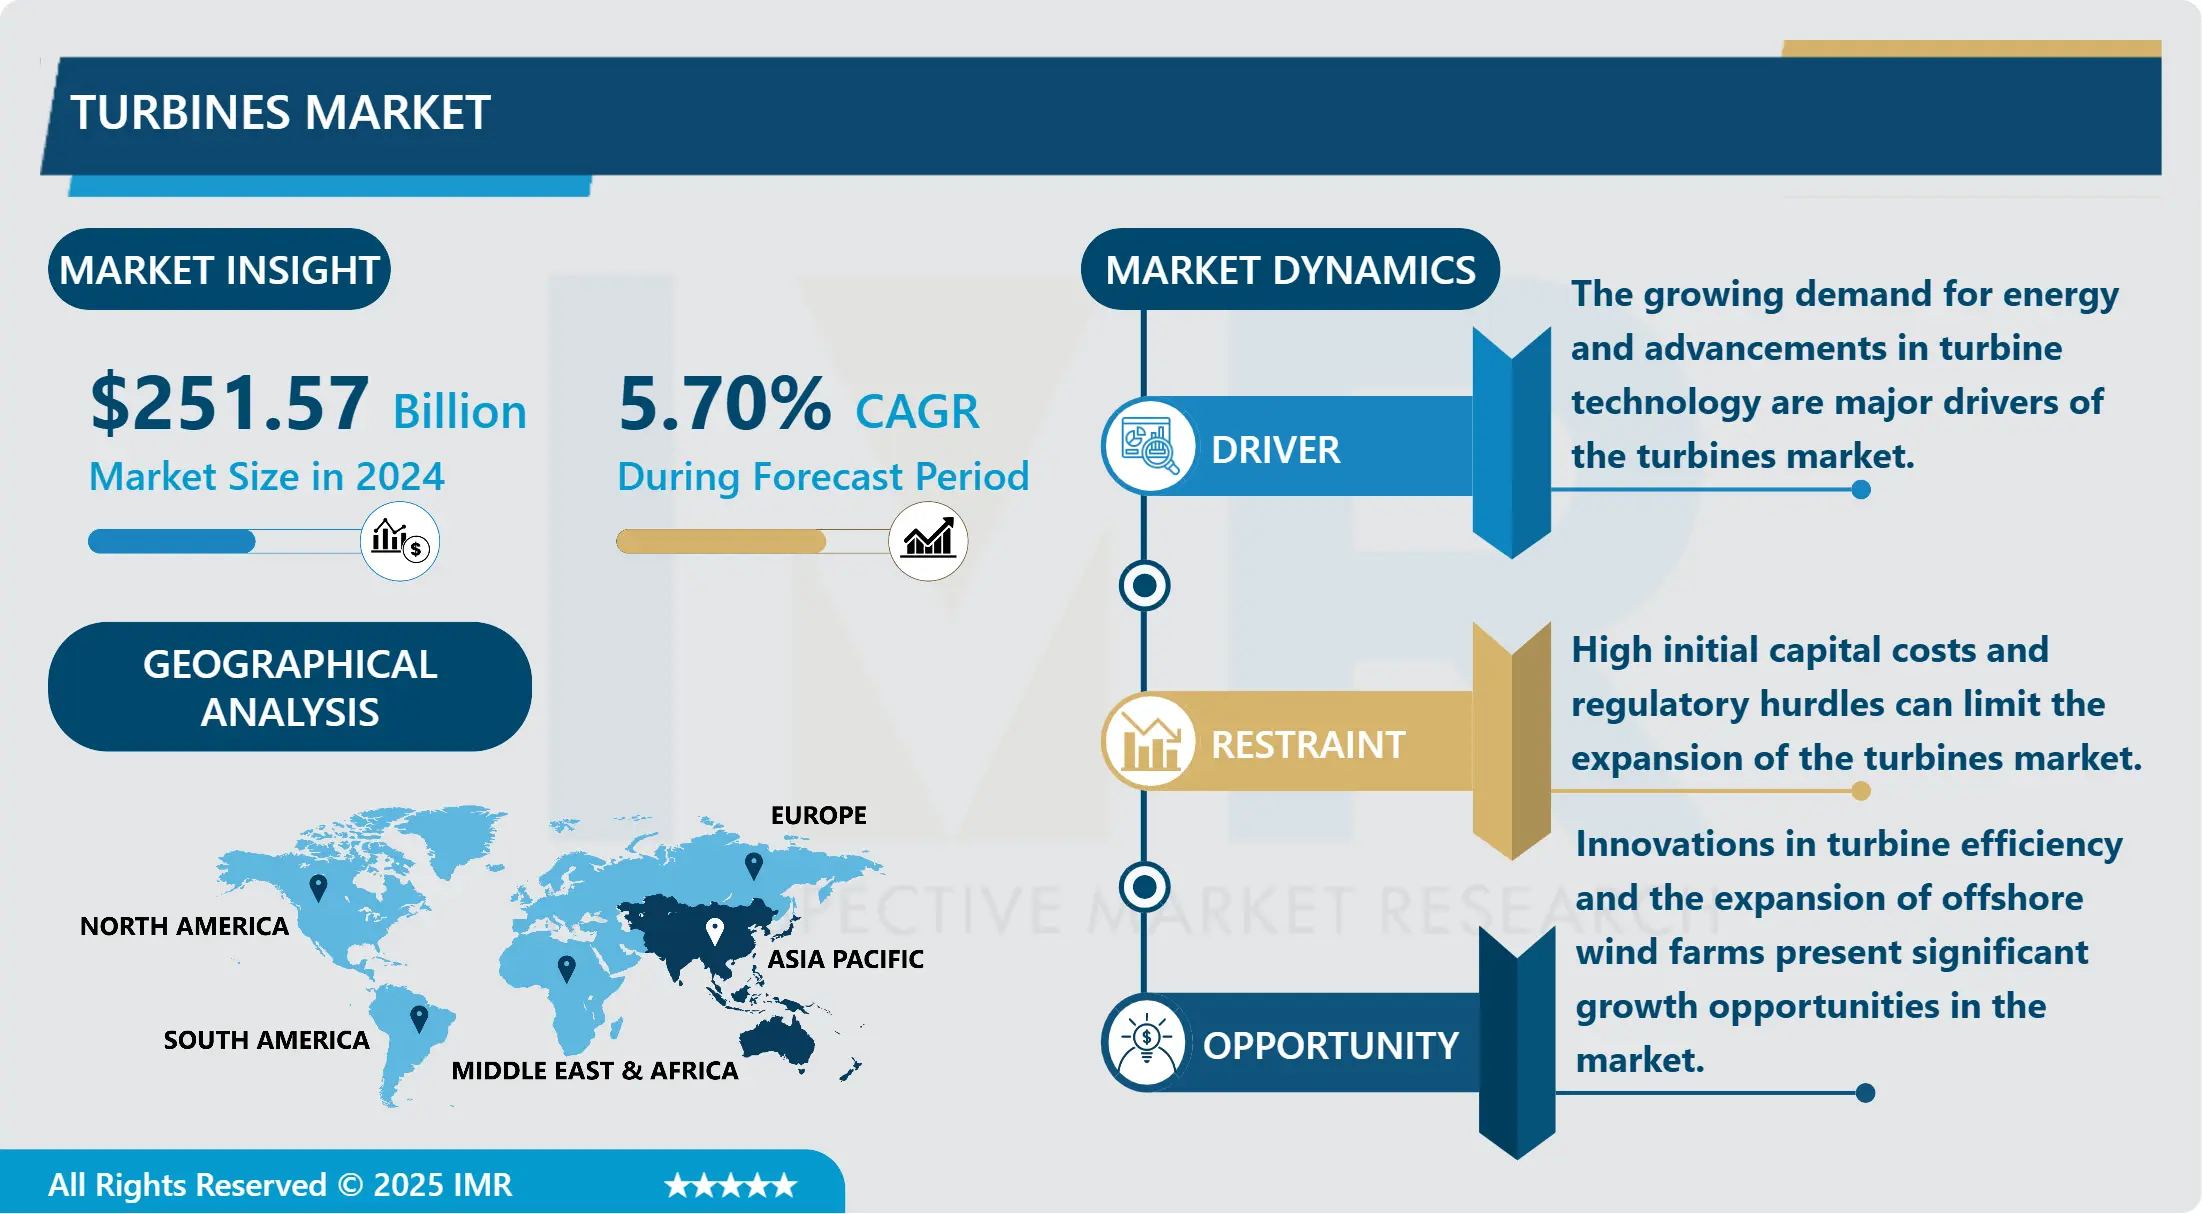
Turbines Market Size is Valued at USD 251.57 Billion in 2024, and is Projected to Reach USD 391.98 Billion by 2032, Growing at a CAGR of 5.70% From 2025-2032.
The turbine market is a comprehensive industry that involves the production and deployment of a variety of turbines for industrial and power generation purposes, such as gas, steam, wind, and hydro turbines. Growing global energy demand and the shift to renewable energy sources, such as hydro and wind power, to mitigate carbon emissions and address climate change are driving the market. In addition to substantial investments in infrastructure development and maintenance, technological advancements, including enhanced efficiency and durability of turbine components, also contribute to market growth. Government incentives for clean energy initiatives and the increasing energy requirements of emerging economies further bolster the demand for turbines. However, obstacles like high initial costs and maintenance requirements can influence market dynamics.
The turbine market is a critical segment of the global energy sector that encompasses a variety of turbines used for power generation, such as gas, steam, and wind turbines. The global transition to renewable energy sources and the growing demand for energy across a variety of industries.
Power facilities extensively employ gas turbines for their efficiency and adaptability, while steam turbines remain essential for conventional power generation. The increasing emphasis on reducing carbon emissions and improving energy efficiency is driving advancements in turbine technology, leading to innovations that enhance performance and lower operational costs.
Conversely, the wind turbine sector is experiencing substantial expansion as a result of the global proliferation of wind energy initiatives. In order to accomplish sustainability objectives and transition to cleaner energy sources, governments and organizations are making substantial investments in wind farms.
Technological advancements, regulatory policies, and the increasing competitiveness of wind energy over traditional fossil fuels also impact the market. We anticipate the turbine market to continue evolving in tandem with the global energy landscape, with a particular emphasis on sustainable and efficient energy solutions.
Turbines Market Trend Analysis
Innovative materials and technology like composite blades and digital monitoring systems are improving turbine performance.
- The turbine sector is using innovative materials and technologies to improve turbine performance. Composite blades, which are lighter and more durable than metal blades, improve efficiency and reduce maintenance.
- Composite materials allow turbines to operate at faster speeds and tolerate harsher conditions, improving performance. Digital monitoring systems are also transforming turbine operations by providing real-time performance, wear, and issue data. This method reduces turbine downtime and extends the lifespan with proactive maintenance.
- Advanced materials and technology are increasing turbine efficiency and market growth. These advances will assist the turbine market as energy demand rises and the need for sustainable and efficient energy sources intensifies. More advanced and reliable turbines will aid green energy solutions and improve energy-producing systems.
We are adding renewable energy sources like wind and hydro turbines to the energy mix to meet sustainable and clean energy goals.
- The global turbine market is undergoing a substantial transformation as the demand for renewable energy sources, including hydro and wind turbines, increases. The transition to healthier energy solutions and the growing emphasis on sustainability. Wind turbines, which generate electricity by harnessing the power of the wind, and hydro turbines, which leverage the energy of flowing water, are increasingly important components of the energy mix. Technological advancements, favourable government policies, and an increasing consciousness of environmental concerns all contribute to this transformation.
- We anticipate that investments in research and development will enhance the efficacy and performance of these systems, while the expansion of renewable energy infrastructure will propel the turbine market forward. Wind and hydro turbines will likely continue to be in high demand as countries endeavor to achieve their sustainable energy objectives and decrease carbon emissions. This will make them essential in the global transition to clean energy sources.
Turbines Market Segment Analysis:
Turbines Market Segmented on the basis of Type, Application, and Region
By Type, Gas Turbine segment is expected to dominate the market during the forecast period
- The primary segments of the turbine market are steam turbines and gas turbines, each designed to meet the unique requirements of various industrial applications. The efficacy of steam turbines in converting thermal energy into mechanical energy is the primary reason for their widespread use in industrial processes and power generation.
- Industrial applications and large-scale power facilities frequently implement them due to their abundance of steam. The necessity for efficient energy conversion systems and the expansion of power generation infrastructure influence the demand for steam turbines.
- On the other hand, people prefer gas turbines because of their high power-to-weight ratio and operational flexibility. Aviation, power generation, and marine applications extensively employ them due to their capacity to initiate rapidly and deliver consistent performance in a variety of environments.
- The gas turbine segment is experiencing growth due to the increasing demand for energy, the advancements in turbine technology, and the increasing utilization of gas turbines in combined-cycle power plants, which are known to improve overall energy efficiency.
By Application, Power Generation segment held the largest share in 2024
- Power generation and aviation are the two primary applications that drive the turbine market, each with its own set of trends and requirements. Turbines are critical in the process of power generation because they convert a variety of energy sources into electricity. The demand for sophisticated gas and steam turbines is on the rise as a result of the global initiative to develop more efficient and environmentally friendly energy sources.
- Advances in turbine technology, particularly in emissions control and efficiency, are driving the growth of this segment. Furthermore, the shift to renewable energy sources like hydro and wind further fuels the demand for turbines specifically engineered to optimize power generation.
- Turbines are indispensable for the efficient operation of aircraft and their propulsion in the aviation industry. The advancements in aerospace technology and the increase in air travel are driving the growth of this segment. The demand for high-performance turbines that provide enhanced reliability, reduced emissions, and improved fuel efficiency is on the rise. We anticipate a robust demand for advanced turbine technologies as the aviation industry continues to modernize and expand, thereby promoting ongoing market development and innovation.
Turbines Market Regional Insights:
Asia Pacific region held the largest market share
- The Asia Pacific region has become the largest market for turbines as a result of significant investments in infrastructure development, accelerated industrialization, and urbanization. Substantial growth in the energy generation and manufacturing sectors of countries like China and India fuels the demand for gas and steam turbines, significantly contributing to this trend. The region's expanding economies and the growing emphasis on energy efficiency further support the turbine market.
- Furthermore, the transition to renewable energy sources in the Asia Pacific region is generating novel opportunities for turbine manufacturers. The demand for advanced turbine technologies is on the rise as governments and private sectors invest in wind and hydroelectric power initiatives. We anticipate that the region's strategic initiatives to reduce carbon emissions and enhance energy sustainability will maintain its dominant position in the global turbine market throughout the forecast period.
Active Key Players in the Turbines Market
- Kawasaki Heavy Industries, Ltd. (Japan)
- Siemens Energy (Germany)
- Capstone Green Energy Corporation (USA)
- General Electric (USA)
- Ansaldo Energia (Italy)
- Mitsubishi Heavy Industries (Japan)
- Nordex SE (Germany)
- Suzlon Energy Limited (India)
- Vestas Wind Systems AS (Denmark)
- Litostroj Power Group (Slovenia)
- Andritz AG (Austria)
- Bharat Heavy Electricals Ltd. (India)
- Rolls-Royce plc (UK)
- ABB (Switzerland)
- Sinovel Wind Group Co. (China)
- other Active Players
Key Industry Developments in the Turbines Market
- In August 2023, Goldwind commenced construction of its 1600-ton wind turbine installation vessel in Nantong, Jiangsu Province. The installation vessel adopts the integrated mode of “transport + storage + lifting," with industry-leading cranes and further boasts the largest variable load capacity and turbine storage capacity in China and can optimize the construction of offshore wind power projects in the deep sea, this project will accelerate the development of offshore wind power at affordable prices by improving the lifting efficiency of turbine components while reducing the construction cost.
|
Global Turbines Market |
|||
|
Base Year: |
2024 |
Forecast Period: |
2025-2032 |
|
Historical Data: |
2018 to 2023 |
Market Size in 2024: |
USD 251.57 Bn. |
|
Forecast Period 2025-32 CAGR: |
5.70% |
Market Size in 2032: |
USD 391.98 Bn. |
|
Segments Covered: |
By Type |
|
|
|
By Application |
|
||
|
By Region |
|
||
|
Key Market Drivers: |
|
||
|
Key Market Restraints: |
|
||
|
Key Opportunities: |
|
||
|
Companies Covered in the report: |
|
||
Chapter 1: Introduction
1.1 Scope and Coverage
Chapter 2:Executive Summary
Chapter 3: Market Landscape
3.1 Market Dynamics
3.1.1 Drivers
3.1.2 Restraints
3.1.3 Opportunities
3.1.4 Challenges
3.2 Market Trend Analysis
3.3 PESTLE Analysis
3.4 Porter's Five Forces Analysis
3.5 Industry Value Chain Analysis
3.6 Ecosystem
3.7 Regulatory Landscape
3.8 Price Trend Analysis
3.9 Patent Analysis
3.10 Technology Evolution
3.11 Investment Pockets
3.12 Import-Export Analysis
Chapter 4: Turbines Market by Type (2018-2032)
4.1 Turbines Market Snapshot and Growth Engine
4.2 Market Overview
4.3 Steam Turbine
4.3.1 Introduction and Market Overview
4.3.2 Historic and Forecasted Market Size in Value USD and Volume Units
4.3.3 Key Market Trends, Growth Factors, and Opportunities
4.3.4 Geographic Segmentation Analysis
4.4 Gas Turbine
Chapter 5: Turbines Market by Application (2018-2032)
5.1 Turbines Market Snapshot and Growth Engine
5.2 Market Overview
5.3 Power Generation
5.3.1 Introduction and Market Overview
5.3.2 Historic and Forecasted Market Size in Value USD and Volume Units
5.3.3 Key Market Trends, Growth Factors, and Opportunities
5.3.4 Geographic Segmentation Analysis
5.4 Aviation
Chapter 6: Company Profiles and Competitive Analysis
6.1 Competitive Landscape
6.1.1 Competitive Benchmarking
6.1.2 Turbines Market Share by Manufacturer (2024)
6.1.3 Industry BCG Matrix
6.1.4 Heat Map Analysis
6.1.5 Mergers and Acquisitions
6.2 HILTI CORPORATION (LIECHTENSTEIN)
6.2.1 Company Overview
6.2.2 Key Executives
6.2.3 Company Snapshot
6.2.4 Role of the Company in the Market
6.2.5 Sustainability and Social Responsibility
6.2.6 Operating Business Segments
6.2.7 Product Portfolio
6.2.8 Business Performance
6.2.9 Key Strategic Moves and Recent Developments
6.2.10 SWOT Analysis
6.3 TRIAX TECHNOLOGIES INC. (UNITED STATES)
6.4 TOPCON CORPORATION (JAPAN)
6.5 ORACLE CORPORATION (UNITED STATES)
6.6 TRIMBLE INC. (UNITED STATES)
6.7 CALAMP CORPORATION (UNITED STATES)
6.8 AUTODESK INC. (UNITED STATES)
6.9 ADVANCED OPTO-MECHANICAL SYSTEMS AND TECHNOLOGIES INC. (UNITED STATES)
6.10 HEXAGON AB (SWEDEN)
6.11 PILLAR TECHNOLOGIES INC. (UNITED STATES)
6.12 AND OTHER KEY PLAYERS.
Chapter 7: Global Turbines Market By Region
7.1 Overview
7.2. North America Turbines Market
7.2.1 Key Market Trends, Growth Factors and Opportunities
7.2.2 Top Key Companies
7.2.3 Historic and Forecasted Market Size by Segments
7.2.4 Historic and Forecasted Market Size by Type
7.2.4.1 Steam Turbine
7.2.4.2 Gas Turbine
7.2.5 Historic and Forecasted Market Size by Application
7.2.5.1 Power Generation
7.2.5.2 Aviation
7.2.6 Historic and Forecast Market Size by Country
7.2.6.1 US
7.2.6.2 Canada
7.2.6.3 Mexico
7.3. Eastern Europe Turbines Market
7.3.1 Key Market Trends, Growth Factors and Opportunities
7.3.2 Top Key Companies
7.3.3 Historic and Forecasted Market Size by Segments
7.3.4 Historic and Forecasted Market Size by Type
7.3.4.1 Steam Turbine
7.3.4.2 Gas Turbine
7.3.5 Historic and Forecasted Market Size by Application
7.3.5.1 Power Generation
7.3.5.2 Aviation
7.3.6 Historic and Forecast Market Size by Country
7.3.6.1 Russia
7.3.6.2 Bulgaria
7.3.6.3 The Czech Republic
7.3.6.4 Hungary
7.3.6.5 Poland
7.3.6.6 Romania
7.3.6.7 Rest of Eastern Europe
7.4. Western Europe Turbines Market
7.4.1 Key Market Trends, Growth Factors and Opportunities
7.4.2 Top Key Companies
7.4.3 Historic and Forecasted Market Size by Segments
7.4.4 Historic and Forecasted Market Size by Type
7.4.4.1 Steam Turbine
7.4.4.2 Gas Turbine
7.4.5 Historic and Forecasted Market Size by Application
7.4.5.1 Power Generation
7.4.5.2 Aviation
7.4.6 Historic and Forecast Market Size by Country
7.4.6.1 Germany
7.4.6.2 UK
7.4.6.3 France
7.4.6.4 The Netherlands
7.4.6.5 Italy
7.4.6.6 Spain
7.4.6.7 Rest of Western Europe
7.5. Asia Pacific Turbines Market
7.5.1 Key Market Trends, Growth Factors and Opportunities
7.5.2 Top Key Companies
7.5.3 Historic and Forecasted Market Size by Segments
7.5.4 Historic and Forecasted Market Size by Type
7.5.4.1 Steam Turbine
7.5.4.2 Gas Turbine
7.5.5 Historic and Forecasted Market Size by Application
7.5.5.1 Power Generation
7.5.5.2 Aviation
7.5.6 Historic and Forecast Market Size by Country
7.5.6.1 China
7.5.6.2 India
7.5.6.3 Japan
7.5.6.4 South Korea
7.5.6.5 Malaysia
7.5.6.6 Thailand
7.5.6.7 Vietnam
7.5.6.8 The Philippines
7.5.6.9 Australia
7.5.6.10 New Zealand
7.5.6.11 Rest of APAC
7.6. Middle East & Africa Turbines Market
7.6.1 Key Market Trends, Growth Factors and Opportunities
7.6.2 Top Key Companies
7.6.3 Historic and Forecasted Market Size by Segments
7.6.4 Historic and Forecasted Market Size by Type
7.6.4.1 Steam Turbine
7.6.4.2 Gas Turbine
7.6.5 Historic and Forecasted Market Size by Application
7.6.5.1 Power Generation
7.6.5.2 Aviation
7.6.6 Historic and Forecast Market Size by Country
7.6.6.1 Turkiye
7.6.6.2 Bahrain
7.6.6.3 Kuwait
7.6.6.4 Saudi Arabia
7.6.6.5 Qatar
7.6.6.6 UAE
7.6.6.7 Israel
7.6.6.8 South Africa
7.7. South America Turbines Market
7.7.1 Key Market Trends, Growth Factors and Opportunities
7.7.2 Top Key Companies
7.7.3 Historic and Forecasted Market Size by Segments
7.7.4 Historic and Forecasted Market Size by Type
7.7.4.1 Steam Turbine
7.7.4.2 Gas Turbine
7.7.5 Historic and Forecasted Market Size by Application
7.7.5.1 Power Generation
7.7.5.2 Aviation
7.7.6 Historic and Forecast Market Size by Country
7.7.6.1 Brazil
7.7.6.2 Argentina
7.7.6.3 Rest of SA
Chapter 8 Analyst Viewpoint and Conclusion
8.1 Recommendations and Concluding Analysis
8.2 Potential Market Strategies
Chapter 9 Research Methodology
9.1 Research Process
9.2 Primary Research
9.3 Secondary Research
|
Global Turbines Market |
|||
|
Base Year: |
2024 |
Forecast Period: |
2025-2032 |
|
Historical Data: |
2018 to 2023 |
Market Size in 2024: |
USD 251.57 Bn. |
|
Forecast Period 2025-32 CAGR: |
5.70% |
Market Size in 2032: |
USD 391.98 Bn. |
|
Segments Covered: |
By Type |
|
|
|
By Application |
|
||
|
By Region |
|
||
|
Key Market Drivers: |
|
||
|
Key Market Restraints: |
|
||
|
Key Opportunities: |
|
||
|
Companies Covered in the report: |
|
||


