


Time Expense Software Market Synopsis
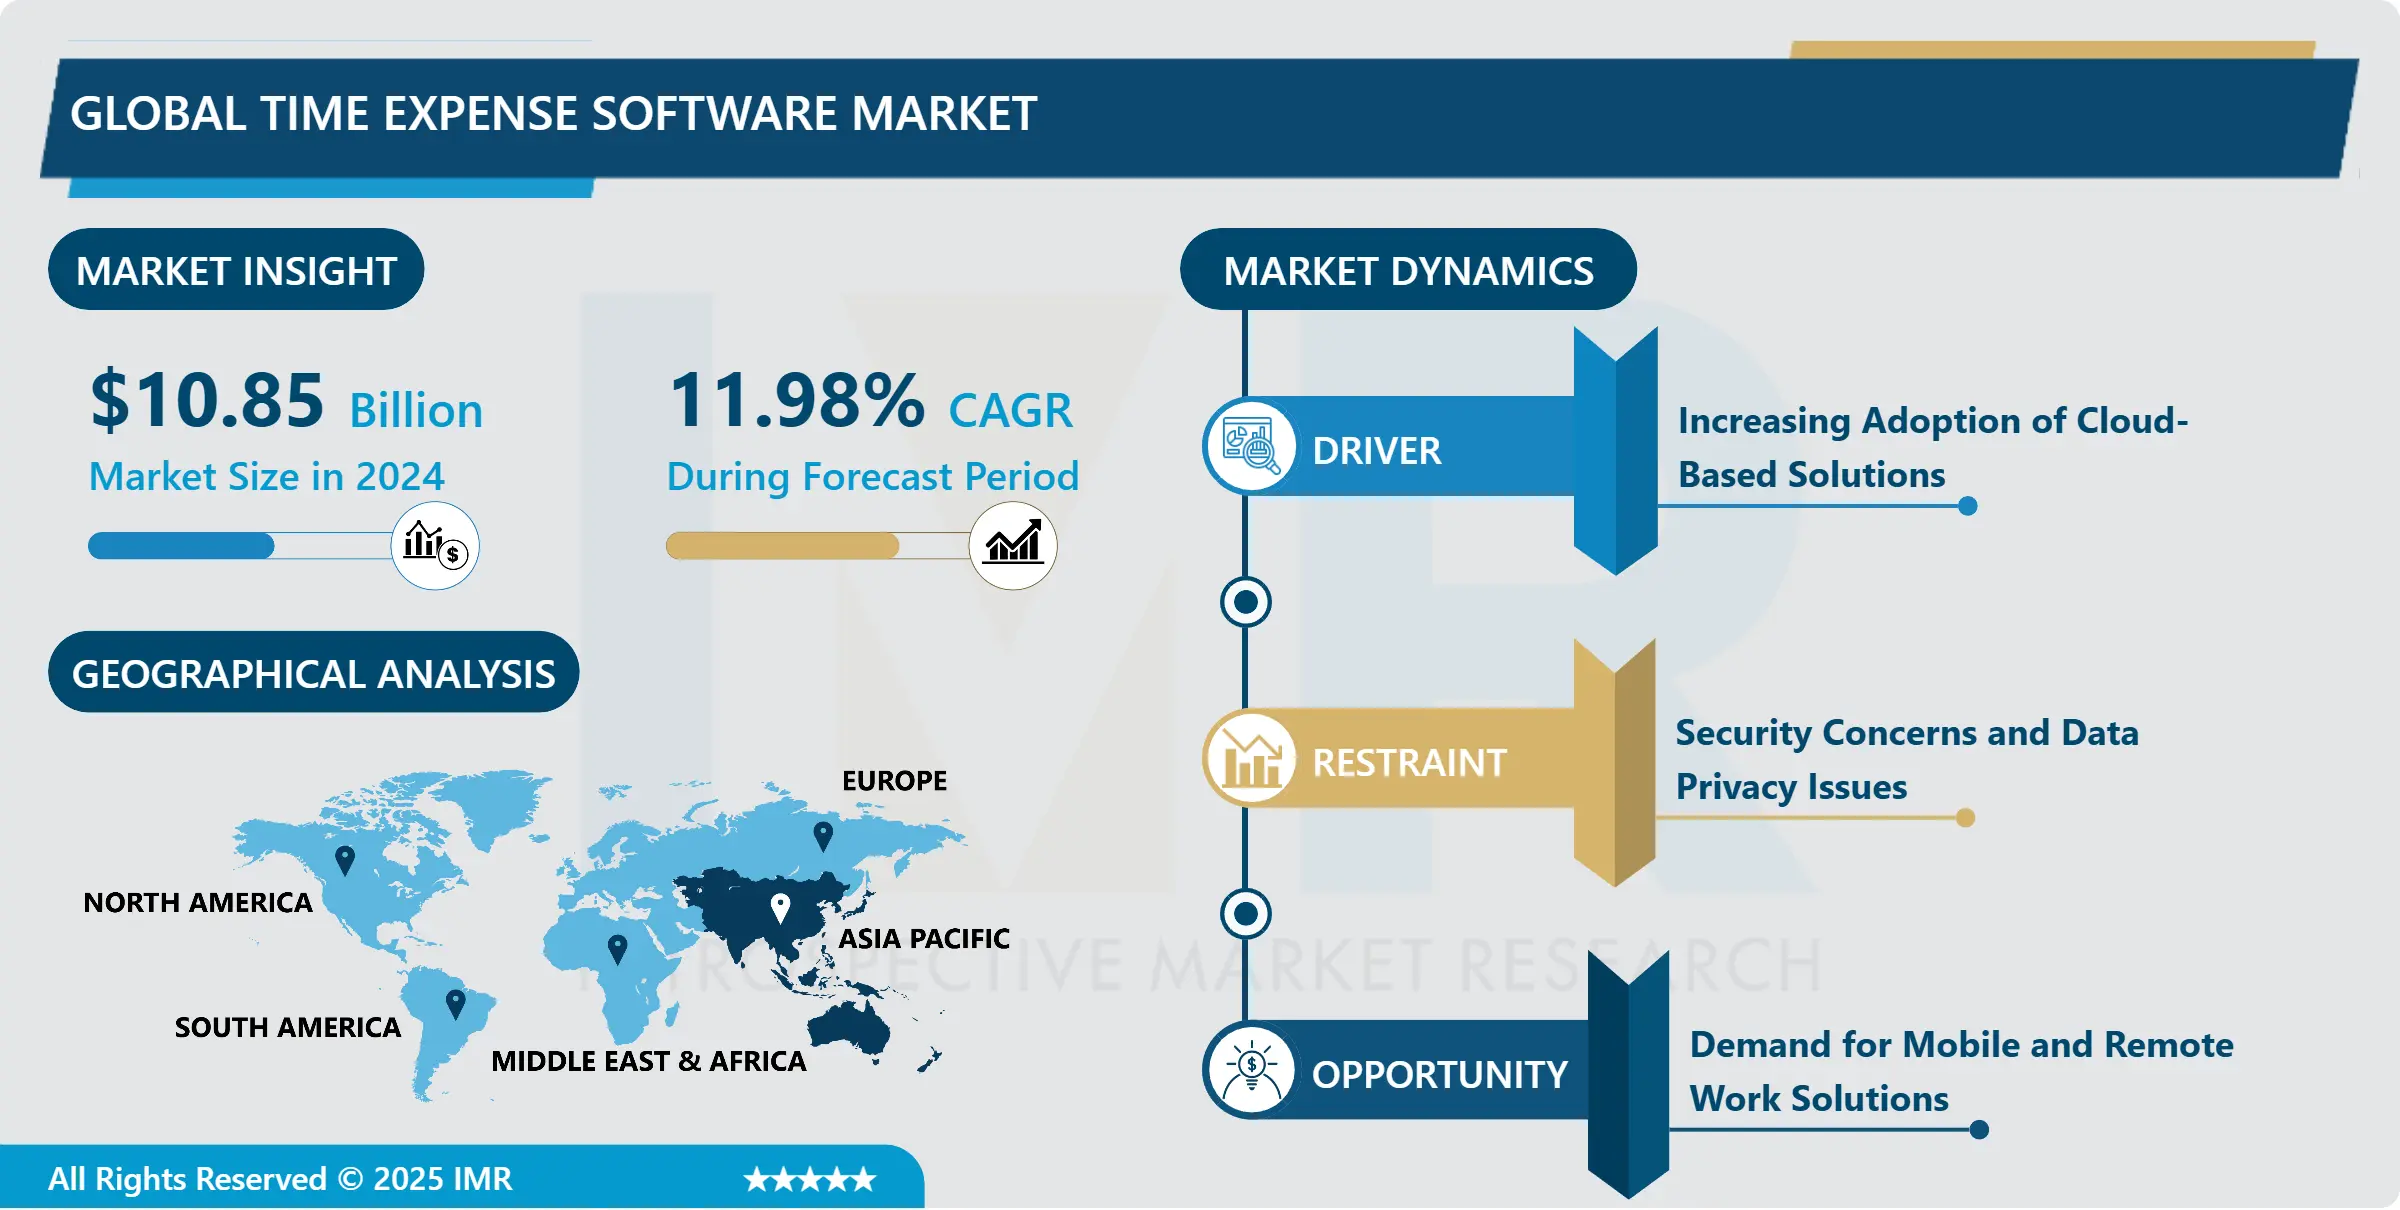
Time Expense Software Market Size Was Valued at USD 10.85 Billion in 2024 and is Projected to Reach USD 26.83 Billion by 2032, Growing at a CAGR of 11.98% From 2025-2032
The time expense software market encompasses a range of digital solutions designed to streamline and automate the management of employee time tracking, expense reporting, and reimbursement processes within organizations. These software platforms typically offer features such as mobile and web-based interfaces for easy data entry, integration with accounting systems for accurate expense tracking, and customizable reporting capabilities to provide insights into resource allocation and project costs. By centralizing time and expense management tasks, these tools aim to improve efficiency, reduce errors, and enhance compliance with company policies and regulatory requirements, making them essential for businesses of all sizes seeking to optimize their financial operations. The growth Time Expense Software Market has been growing in the recent past few years keeping in view the adoption of technology and especially for Managing time and expenses. The expansion of this market can be attributed to several key factors, namely the increasing demand for organizations to optimize their organizational processes, enhance functional productivity, and track the availability of resources. Additionally, with the increased adoption of work from home and short-term jobs becoming more popular, people require versatile and easy to use time and expense trackers.
Leading players in the Time Expense Software Market are embracing new prospects in their software as the software can be accessed through mobile devices, track working hours in real-time and be linked with other essential business systems like the Accounting and Project Management software. Apart from improving the user satisfaction, these evolution help organizations to apply data to include business problems and ensure adherence to laws and rules. Moreover, the current trends indicate that organizations are moving to the cloud base solutions, that suggest the flexibility, availability and a lower investment in IT necessary. The use of time expense software is growing especially among small and medium sized firms due to the cost effective and relatively simple to integrate. Going forward, the Time Expense Software Market should continue to expand in the near future owing to the following factors: digital transformation, the necessity of better overviews of expenditures, and the new work-related models that rely on remote and flexible work settings. However, vendors will need to pay additional attention towards developing security features, data privacy concerns and the problem of integrating into the already existing frameworks in order to sustain their competitive edge in this continuously evolving market.

Time Expense Software Market Trend Analysis
Emphasis on Automation and Integration in the Time Expense Software Market
- Increased focus on automation and integration in the time expense software market evident by various market indicators points to the increasing relevance of enhanced operational efficiency and accuracy. Organizations understand the need of managing time and time expenses by reducing errors and using lesser time than before. By using one or more of the solutions described above, companies are able to reduce the time spent on repetitive work, such as data entry or reconciliation, allowing employees to focus on more pressing tasks, which will ultimately allow organizations to achieve the greatest output.
- In addition, compatibility with other systems is essential for effectively implementating the integration between various components in an organization’s employees’ daily flow. The effective time expense system will allow data to be passed from one software program to other in areas like accounting, project management, and HR, thus preventing information replication and error. This integration does not only improves the quality of information used in different activities but also makes it possible for management to have a complete picture of financial activities in order to facilitate good decision-making and resource utilization. In total, the inclination toward automation and integration can is a clear indication of strained attempts by companies to optimize their financial management and become more responsive to the realities of the contemporary digital world and globalized business.
Rising Importance of Mobile Accessibility in Time Expense Software
- The aspect of mobile access in time expense software is another highlight in that work cultures change with flexibilities such as remote and on the move work becoming more prevalent. With a trend towards increased flexibility and distributed work that has become more evident in today’s workforce, more applications have to be designed to support mobile environments. As the utilization of mobile devices and customized web applications for organizations increases, employees can perform time and cost tracking anytime and from anywhere, including working from home, when they are on business trips and elsewhere. This convenience does not only amplify the effectiveness of the performance by making it easier for the employees to organize and update their financial activities but also encourages efficiency in policy and regulatory conducts.
- However, mobile accessibility in time expense software improves the other expenses of time that are tagged in the time expense software. With this ability of letting users record their time and expenses in real-time using their smart mobile devices, organizations are also able to eliminate many problems such as delay and large amount of administrative work caused by bothering with manual data entry. They don’t have to wait for the end of the week or the month to report expenses or hours worked; this results in a faster completion of reimbursements and better tracking of costs. Furthermore, the availability of such a mobile platform means that employees and managers can be held more accountable for their work due to the ability to track project development and spendings at any time. All in all, the focus on mobile accessibility in time expense software is quite relevant to the contemporary state of affairs in the business world where remote work has become the norm to an extent, and tech is the one to help bring one’s employees together.
Time Expense Software Market Segment Analysis:
Time Expense Software Market is segmented based on User Type, Functionality, Service Model, Business Size and Industry Vertical
By Service Model, Software as a Service (SaaS) solutions segment is expected to dominate the market during the forecast period
- Whereas we are discussing about the SaaS solutions particularly business to business business (B2B), two pervasive names in indeed Zoho Expense as well as FreshBooks that have captured comparatively more significant portion of greater market area in diverse categories of sector. They have several factors or advantages which have immensely benefited them leading to the achievement they enjoy today. To begin with, one can distinguish that the targeted platforms are oriented quite actively in order to guarantee the greatest convenience and comprehensible interface for such users as individuals for Mutuals, and companies irrespective of their experience in Independent work. Organizational adoption of this functionality is easy because it does not interrupt the existing use and processes, and the overall effectiveness increases because it is fully incorporated into current use and activity.
- Second, Zoho Expense and FreshBooks are considered to be some of the best cloud-based accounting services which can be purchased at rather reasonable prices. Therefore, giving the businesses the ability to manage time and expenses’ tracking without having to focus on the on-premise infrastructures and their management, render the owners of the companies of various sizes some money. Also from an organisational perspective they are easy to scale, meaning that organisations can easily vary its use in vogue depending on test results or new requirements hence organisations find them relevant especially where the organisation’s is expanding since they are flexible. Consequently, two options again appeared to be the fastest and most efficient – Zoho Expense and FreshBooks – they embraced the opportunity of SaaS making it available and flexible solutions perfect for companies from various sectors.
By Business Size, large enterprises segment held the largest share in 2024
- Here, the demand of sophisticated and larger accommodation solutions exists to a large extent than they do in small and middle-line enterprises; hence, the platforms like SAP Concur, Workday, and ADP Workforce Now are in high demand. That is why these industry leaders have the pleasure of offering the best suites for big organizations to cater to the demands of their complex business in multiple industries. Nevertheless, one of the major points inspiring their use is the increased possibilities of the tool compared to plain time and expenses improving. Right from project integration for integrating its projects into project management and payroll to integrate into the system these application offer a one stop solution for managing its employees to ensure the smooth and efficient functioning of the organisation.
- Also, aspects concerning the scalability and integration voguer are highly important to explain the why SAP Concur, Workday, and ADP Workforce Now is a large enterprise segment leader for its target market. These are designed to be independent systems that can be linked to the company’s base business systems such as ERP and CRM in order to facilitate data exchange and thereby support the improving of the extent of integration of cross-organizational processes. Moreover, since they are general policies their application is relevant in as much as the large businesses have a need that needs to be met, expand geographically, contract or change the supplies they use, employ people or simply adhere to regulatory requirements of sectors in the economy. Thus, SAP Concur, Workday, and ADP Workforce Now are still the leaders in the large enterprise subsegment due to things like more complex product offerings, many more clients, and strong integrations based on the fact that the demands of large organizations are quite different from those of mid-sized businesses.
Time Expense Software Market Regional Insights:
Asia Pacific is Expected to Dominate the Market Over the Forecast period
- The Asia Pacific area emerges as a fortress for the time expense software market as both the augmentation of the dynamics towards the strengthening of the digitalization trend within the economy and vast companies of the region becomes more specified. This is due to the ever rising rate of industrialization among the member countries such as China, India & Japan among others is putting pressure on the business environment to seek for programmatic ways of improving on their operation processes. At the moment with the injections of large sums of money in connectivity projects such as broadband Internet and 5G among others, are setting in place the necessary underpinnings for Cloud-enabled environment. Not only that it offers the solutions that offer a scalable and efficient communication channel, but also makes many industries to make use of cloud base time expense software solutions efficiently.
- In addition, Smart Phone usage and internet connectivity penetration as a disposable opportunity is growing the demand of time expense solution solutions specifically for mobile centric in Asia Pacific. The common way and current regular means in today’s community is the use of the smartphones and communicating devices together with performing the business’ tasks and duties , however more and more businesses are perceiving the potential of having an use of mobile applications in terms of time and cost efficiency. Mobile commerce is particularly seen in the developing world as people employ their mobile gadgets to get connected to the Internet and get services. Thus, the time expense software vendors have been on the process of developing and launching convenient mobilized applications which may allow the employees to capture and submit the detailed time expenses as may be required regardless of the location. Due to the high receptiveness of the region’s adaptation to the utilization of mobile technology and solutions, vendors can tap into immesely vast market represented by corporate stakeholders, who are willing and ready to deploy new-age technologies that may help enhance business processes.
Active Key Players in the Time Expense Software Market
- SAP Concur
- Expensify
- Zoho Expense
- QuickBooks Time (formerly TSheets)
- FreshBooks
- Paycom
- ADP Workforce Now
- Other Active Players
|
Global Time Expense Software Market |
|||
|
Base Year: |
2024 |
Forecast Period: |
2025-2032 |
|
Historical Data: |
2018 to 2023 |
Market Size in 2024: |
USD 10.85 Bn. |
|
Forecast Period 2024-32 CAGR: |
11.98% |
Market Size in 2032: |
USD 26.83 Bn. |
|
|
By User Type
|
|
|
|
|
By Functionality |
|
|
|
Segments Covered: |
By Service Model |
|
|
|
By Business Size |
|
||
|
By Industry Vertical |
|
||
|
By Region |
|
||
|
Key Market Drivers: |
|
||
|
Key Market Restraints: |
|
||
|
Key Opportunities: |
|
||
|
Companies Covered in the report: |
SAP Concur, Expensify, Zoho Expense, QuickBooks Time (formerly TSheets), FreshBooks, Paycom, ADP Workforce Now and Other Active Players. |
||
Chapter 1: Introduction
1.1 Scope and Coverage
Chapter 2:Executive Summary
Chapter 3: Market Landscape
3.1 Market Dynamics
3.1.1 Drivers
3.1.2 Restraints
3.1.3 Opportunities
3.1.4 Challenges
3.2 Market Trend Analysis
3.3 PESTLE Analysis
3.4 Porter's Five Forces Analysis
3.5 Industry Value Chain Analysis
3.6 Ecosystem
3.7 Regulatory Landscape
3.8 Price Trend Analysis
3.9 Patent Analysis
3.10 Technology Evolution
3.11 Investment Pockets
3.12 Import-Export Analysis
Chapter 4: Time Expense Software Market by Service Model (2018-2032)
4.1 Time Expense Software Market Snapshot and Growth Engine
4.2 Market Overview
4.3 Software as a Service (SaaS)
4.3.1 Introduction and Market Overview
4.3.2 Historic and Forecasted Market Size in Value USD and Volume Units
4.3.3 Key Market Trends, Growth Factors, and Opportunities
4.3.4 Geographic Segmentation Analysis
4.4 Platform as a Service (PaaS)
4.5 Infrastructure as a Service (IaaS)
Chapter 5: Time Expense Software Market by Business Size (2018-2032)
5.1 Time Expense Software Market Snapshot and Growth Engine
5.2 Market Overview
5.3 Small and Medium-sized Enterprises (SMEs)
5.3.1 Introduction and Market Overview
5.3.2 Historic and Forecasted Market Size in Value USD and Volume Units
5.3.3 Key Market Trends, Growth Factors, and Opportunities
5.3.4 Geographic Segmentation Analysis
5.4 Large Enterprises
Chapter 6: Time Expense Software Market by Industry Vertical (2018-2032)
6.1 Time Expense Software Market Snapshot and Growth Engine
6.2 Market Overview
6.3 Healthcare
6.3.1 Introduction and Market Overview
6.3.2 Historic and Forecasted Market Size in Value USD and Volume Units
6.3.3 Key Market Trends, Growth Factors, and Opportunities
6.3.4 Geographic Segmentation Analysis
6.4 IT & Telecom
6.5 BFSI (Banking
6.6 Financial Services
6.7 and Insurance)
6.8 Manufacturing
6.9 Retail
6.10 Others
Chapter 7: Company Profiles and Competitive Analysis
7.1 Competitive Landscape
7.1.1 Competitive Benchmarking
7.1.2 Time Expense Software Market Share by Manufacturer (2024)
7.1.3 Industry BCG Matrix
7.1.4 Heat Map Analysis
7.1.5 Mergers and Acquisitions
7.2 SAS INSTITUTE INC. (U.S.)
7.2.1 Company Overview
7.2.2 Key Executives
7.2.3 Company Snapshot
7.2.4 Role of the Company in the Market
7.2.5 Sustainability and Social Responsibility
7.2.6 Operating Business Segments
7.2.7 Product Portfolio
7.2.8 Business Performance
7.2.9 Key Strategic Moves and Recent Developments
7.2.10 SWOT Analysis
7.3 IBM CORPORATION (U.S.)
7.4 ORACLE CORPORATION (U.S.)
7.5 COUPA SOFTWARE INC. (U.S.)
7.6 ZYCUS INC. (U.S.)
7.7 JAGGAER (U.S.)
7.8 TRADESHIFT (U.S.)
7.9 VROOZI INC. (U.S.)
7.10 XEEVA INC. (U.S.)
7.11 IVALUA INC. (U.S.)
7.12 GEP WORLDWIDE (U.S.)
7.13 DETERMINE INC. (U.S.)
7.14 BRAVOSOLUTION SPA (U.S.)
7.15 PROACTIS HOLDINGS PLC (FRANCE)
7.16 SAP SE (GERMANY)
7.17 BASWARE CORPORATION (FINLAND)
7.18 PROACTIS (UK)
7.19 ROSSLYN ANALYTICS LTD. (UK)
7.20 TEJARI SOLUTIONS
7.21 EMPRONC SOLUTIONS PVT. LTD. (INDIA)
7.22
Chapter 8: Global Time Expense Software Market By Region
8.1 Overview
8.2. North America Time Expense Software Market
8.2.1 Key Market Trends, Growth Factors and Opportunities
8.2.2 Top Key Companies
8.2.3 Historic and Forecasted Market Size by Segments
8.2.4 Historic and Forecasted Market Size by Service Model
8.2.4.1 Software as a Service (SaaS)
8.2.4.2 Platform as a Service (PaaS)
8.2.4.3 Infrastructure as a Service (IaaS)
8.2.5 Historic and Forecasted Market Size by Business Size
8.2.5.1 Small and Medium-sized Enterprises (SMEs)
8.2.5.2 Large Enterprises
8.2.6 Historic and Forecasted Market Size by Industry Vertical
8.2.6.1 Healthcare
8.2.6.2 IT & Telecom
8.2.6.3 BFSI (Banking
8.2.6.4 Financial Services
8.2.6.5 and Insurance)
8.2.6.6 Manufacturing
8.2.6.7 Retail
8.2.6.8 Others
8.2.7 Historic and Forecast Market Size by Country
8.2.7.1 US
8.2.7.2 Canada
8.2.7.3 Mexico
8.3. Eastern Europe Time Expense Software Market
8.3.1 Key Market Trends, Growth Factors and Opportunities
8.3.2 Top Key Companies
8.3.3 Historic and Forecasted Market Size by Segments
8.3.4 Historic and Forecasted Market Size by Service Model
8.3.4.1 Software as a Service (SaaS)
8.3.4.2 Platform as a Service (PaaS)
8.3.4.3 Infrastructure as a Service (IaaS)
8.3.5 Historic and Forecasted Market Size by Business Size
8.3.5.1 Small and Medium-sized Enterprises (SMEs)
8.3.5.2 Large Enterprises
8.3.6 Historic and Forecasted Market Size by Industry Vertical
8.3.6.1 Healthcare
8.3.6.2 IT & Telecom
8.3.6.3 BFSI (Banking
8.3.6.4 Financial Services
8.3.6.5 and Insurance)
8.3.6.6 Manufacturing
8.3.6.7 Retail
8.3.6.8 Others
8.3.7 Historic and Forecast Market Size by Country
8.3.7.1 Russia
8.3.7.2 Bulgaria
8.3.7.3 The Czech Republic
8.3.7.4 Hungary
8.3.7.5 Poland
8.3.7.6 Romania
8.3.7.7 Rest of Eastern Europe
8.4. Western Europe Time Expense Software Market
8.4.1 Key Market Trends, Growth Factors and Opportunities
8.4.2 Top Key Companies
8.4.3 Historic and Forecasted Market Size by Segments
8.4.4 Historic and Forecasted Market Size by Service Model
8.4.4.1 Software as a Service (SaaS)
8.4.4.2 Platform as a Service (PaaS)
8.4.4.3 Infrastructure as a Service (IaaS)
8.4.5 Historic and Forecasted Market Size by Business Size
8.4.5.1 Small and Medium-sized Enterprises (SMEs)
8.4.5.2 Large Enterprises
8.4.6 Historic and Forecasted Market Size by Industry Vertical
8.4.6.1 Healthcare
8.4.6.2 IT & Telecom
8.4.6.3 BFSI (Banking
8.4.6.4 Financial Services
8.4.6.5 and Insurance)
8.4.6.6 Manufacturing
8.4.6.7 Retail
8.4.6.8 Others
8.4.7 Historic and Forecast Market Size by Country
8.4.7.1 Germany
8.4.7.2 UK
8.4.7.3 France
8.4.7.4 The Netherlands
8.4.7.5 Italy
8.4.7.6 Spain
8.4.7.7 Rest of Western Europe
8.5. Asia Pacific Time Expense Software Market
8.5.1 Key Market Trends, Growth Factors and Opportunities
8.5.2 Top Key Companies
8.5.3 Historic and Forecasted Market Size by Segments
8.5.4 Historic and Forecasted Market Size by Service Model
8.5.4.1 Software as a Service (SaaS)
8.5.4.2 Platform as a Service (PaaS)
8.5.4.3 Infrastructure as a Service (IaaS)
8.5.5 Historic and Forecasted Market Size by Business Size
8.5.5.1 Small and Medium-sized Enterprises (SMEs)
8.5.5.2 Large Enterprises
8.5.6 Historic and Forecasted Market Size by Industry Vertical
8.5.6.1 Healthcare
8.5.6.2 IT & Telecom
8.5.6.3 BFSI (Banking
8.5.6.4 Financial Services
8.5.6.5 and Insurance)
8.5.6.6 Manufacturing
8.5.6.7 Retail
8.5.6.8 Others
8.5.7 Historic and Forecast Market Size by Country
8.5.7.1 China
8.5.7.2 India
8.5.7.3 Japan
8.5.7.4 South Korea
8.5.7.5 Malaysia
8.5.7.6 Thailand
8.5.7.7 Vietnam
8.5.7.8 The Philippines
8.5.7.9 Australia
8.5.7.10 New Zealand
8.5.7.11 Rest of APAC
8.6. Middle East & Africa Time Expense Software Market
8.6.1 Key Market Trends, Growth Factors and Opportunities
8.6.2 Top Key Companies
8.6.3 Historic and Forecasted Market Size by Segments
8.6.4 Historic and Forecasted Market Size by Service Model
8.6.4.1 Software as a Service (SaaS)
8.6.4.2 Platform as a Service (PaaS)
8.6.4.3 Infrastructure as a Service (IaaS)
8.6.5 Historic and Forecasted Market Size by Business Size
8.6.5.1 Small and Medium-sized Enterprises (SMEs)
8.6.5.2 Large Enterprises
8.6.6 Historic and Forecasted Market Size by Industry Vertical
8.6.6.1 Healthcare
8.6.6.2 IT & Telecom
8.6.6.3 BFSI (Banking
8.6.6.4 Financial Services
8.6.6.5 and Insurance)
8.6.6.6 Manufacturing
8.6.6.7 Retail
8.6.6.8 Others
8.6.7 Historic and Forecast Market Size by Country
8.6.7.1 Turkiye
8.6.7.2 Bahrain
8.6.7.3 Kuwait
8.6.7.4 Saudi Arabia
8.6.7.5 Qatar
8.6.7.6 UAE
8.6.7.7 Israel
8.6.7.8 South Africa
8.7. South America Time Expense Software Market
8.7.1 Key Market Trends, Growth Factors and Opportunities
8.7.2 Top Key Companies
8.7.3 Historic and Forecasted Market Size by Segments
8.7.4 Historic and Forecasted Market Size by Service Model
8.7.4.1 Software as a Service (SaaS)
8.7.4.2 Platform as a Service (PaaS)
8.7.4.3 Infrastructure as a Service (IaaS)
8.7.5 Historic and Forecasted Market Size by Business Size
8.7.5.1 Small and Medium-sized Enterprises (SMEs)
8.7.5.2 Large Enterprises
8.7.6 Historic and Forecasted Market Size by Industry Vertical
8.7.6.1 Healthcare
8.7.6.2 IT & Telecom
8.7.6.3 BFSI (Banking
8.7.6.4 Financial Services
8.7.6.5 and Insurance)
8.7.6.6 Manufacturing
8.7.6.7 Retail
8.7.6.8 Others
8.7.7 Historic and Forecast Market Size by Country
8.7.7.1 Brazil
8.7.7.2 Argentina
8.7.7.3 Rest of SA
Chapter 9 Analyst Viewpoint and Conclusion
9.1 Recommendations and Concluding Analysis
9.2 Potential Market Strategies
Chapter 10 Research Methodology
10.1 Research Process
10.2 Primary Research
10.3 Secondary Research
|
Global Time Expense Software Market |
|||
|
Base Year: |
2024 |
Forecast Period: |
2025-2032 |
|
Historical Data: |
2018 to 2023 |
Market Size in 2024: |
USD 10.85 Bn. |
|
Forecast Period 2024-32 CAGR: |
11.98% |
Market Size in 2032: |
USD 26.83 Bn. |
|
|
By User Type
|
|
|
|
|
By Functionality |
|
|
|
Segments Covered: |
By Service Model |
|
|
|
By Business Size |
|
||
|
By Industry Vertical |
|
||
|
By Region |
|
||
|
Key Market Drivers: |
|
||
|
Key Market Restraints: |
|
||
|
Key Opportunities: |
|
||
|
Companies Covered in the report: |
SAP Concur, Expensify, Zoho Expense, QuickBooks Time (formerly TSheets), FreshBooks, Paycom, ADP Workforce Now and Other Active Players. |
||


