


Terminal Management System Market Synopsis
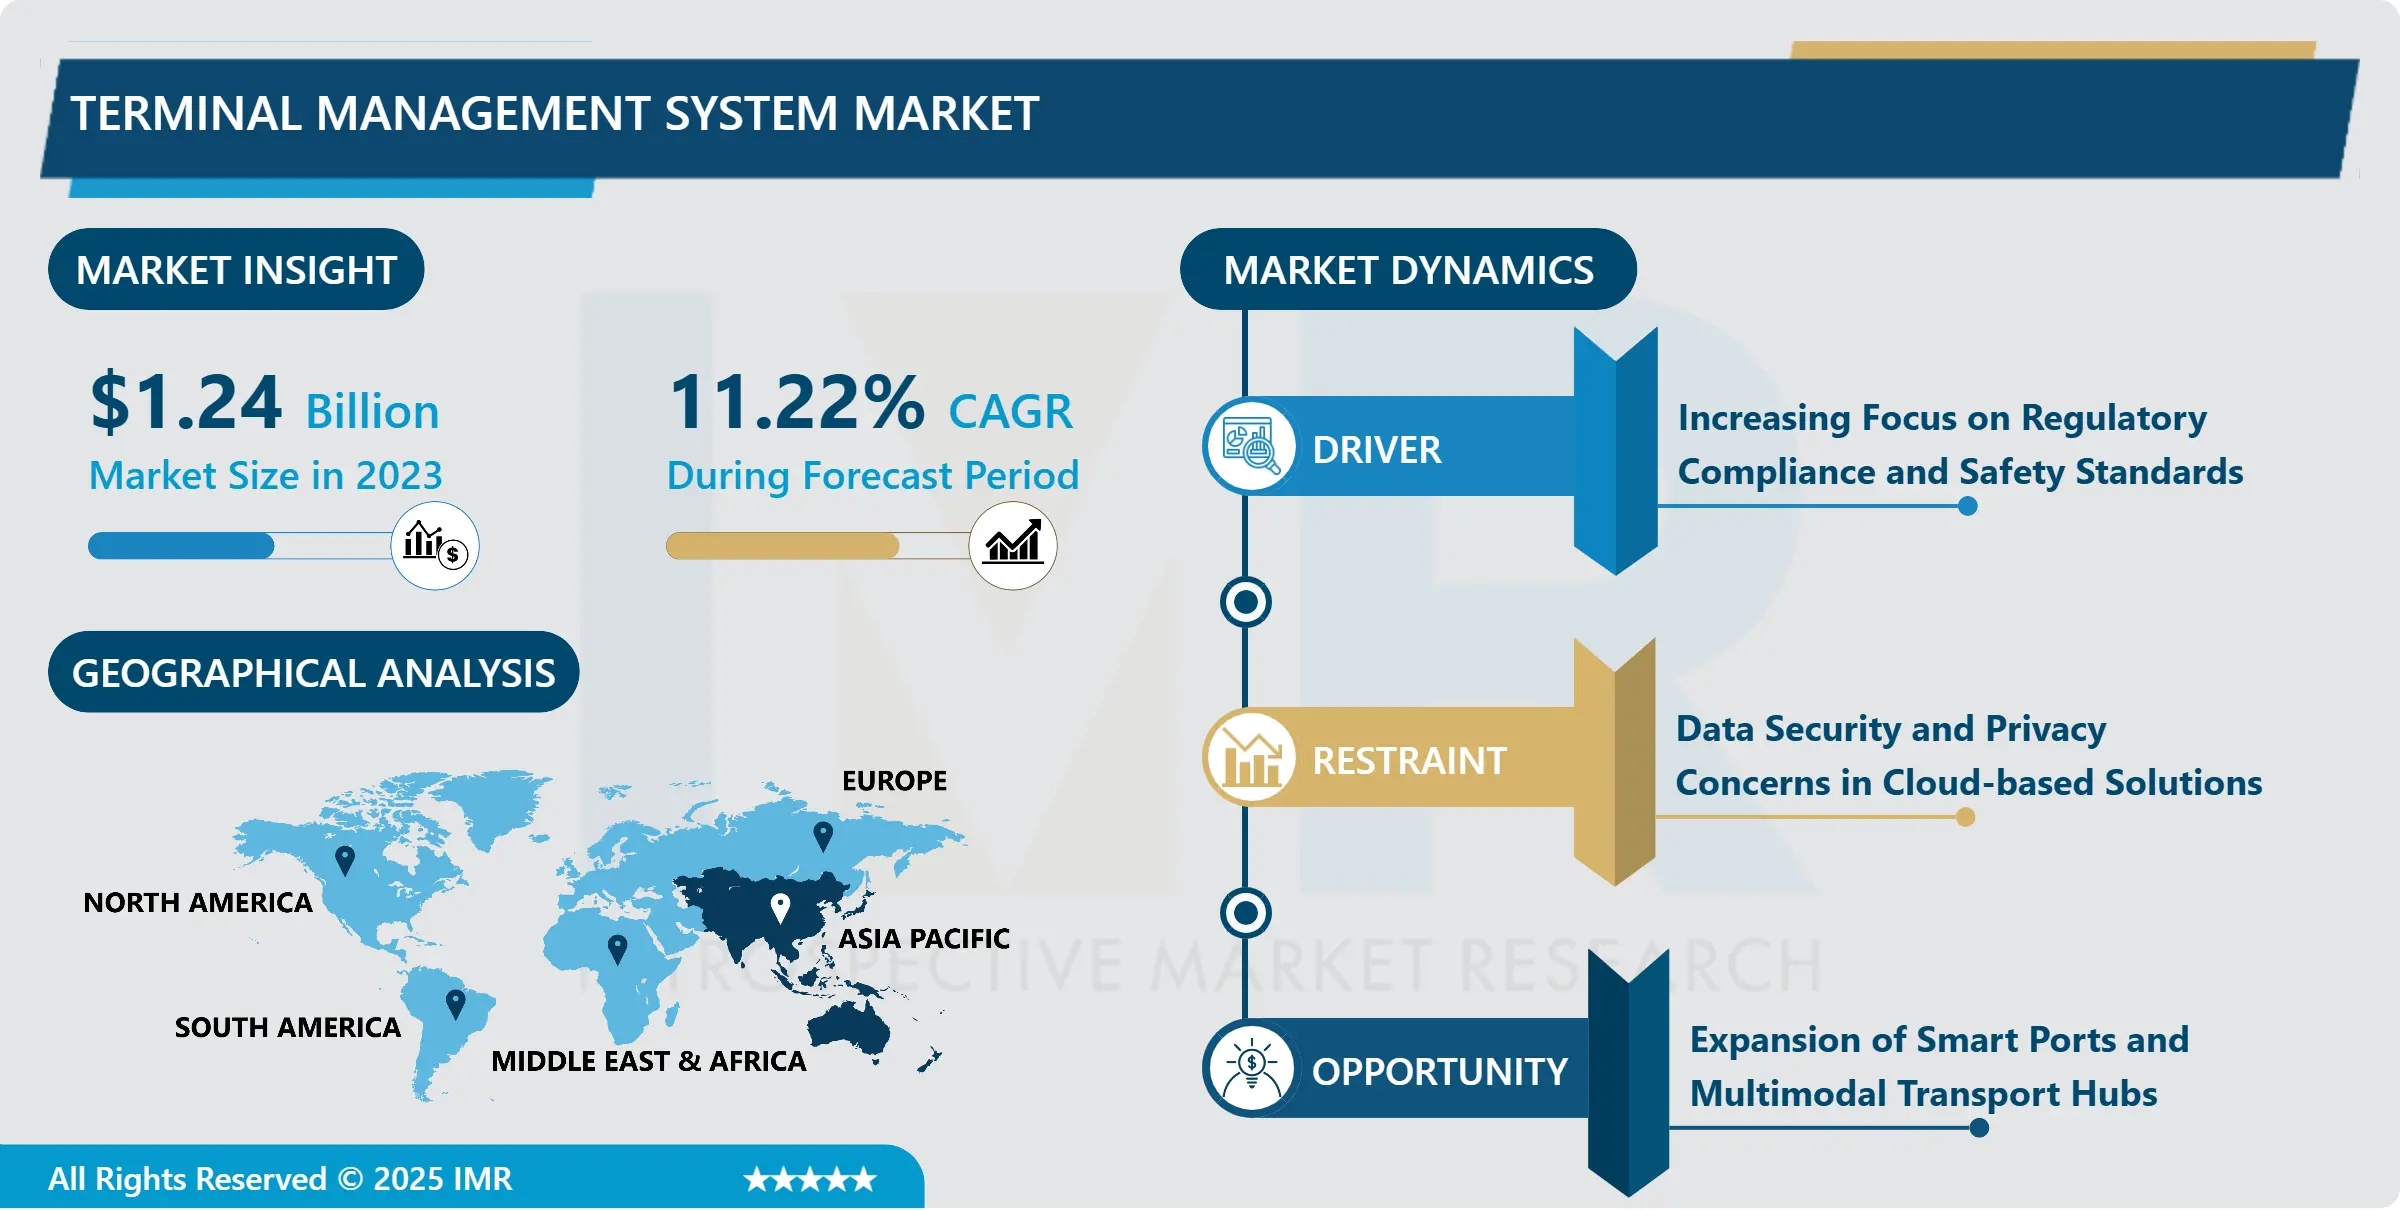
Terminal Management System Market Size Was Valued at USD 1.24 Billion in 2023, and is Projected to Reach USD 3.22 Billion by 2032, Growing at a CAGR of 11.22 % From 2024-2032.
These strategies pertain to the implementation of the Terminal management system TMS a software application that manages operations of terminals in oil, chemical and bulk handing industries. It offers management features, like inventory control, time-tables, safety issues, security as well as reporting which improves efficiency, time and again reduces the periods of inactivity and additionally meets set legal requirements. TMS is utilized in the management of the inflow and outflow of goods, vehicles, and personnel in terminal facilities in order to enhance supply chain practice and effectiveness of terminals.
In turn, the growth of the Terminal Management System market is due to the fact that the segments of logistics and transport are actively developing and requesting automation and digitalization. Coupled with the move to continuously make operation processes faster and cheaper, TMS solutions are increasingly being adopted from industries such as oil, chemicals, and bulk material handling. This shift towards automation enhances the accuracy, speed and efficiency of the terminals, and makes the business to handle large volumes of goods.
The other driver is due to the increasing concern in safety and compliance laws in various sectors. Due to increased legal legislations on transport of hazardous goods the TMS provides a perfect solution for compliance on safety policies, environmental and all other compliance that might be compulsory. This is well seen especially in businesses such as Oil and gas industries where safety of business and its people is paramount because of the type of products that are moved.
Terminal Management System Market Trend Analysis:
Cloud implementation
-
Cloud implementation can be perceived as one of the most significant trends in the development of Terminal Management System. Through the use of cloud computing, one is able to let flexibility and scalability of data, hence enabling organizations to implement and manage TMS systems. This trend is also evident by the growing use of data analytics in terminal operations to enhance decision-making an performance optimization. Terminal operations in automated and council systems make it possible for heads to obtain real time performance information hence managing and offering quick responses to problems.
- Another trend is the increasing combination of IoT solutions with Terminal Management Systems.) This is because IoT technology in other devices makes it possible to monitor assets, vehicles and goods in the terminal to enhance visibility and minimize downtime. Application of sensors and RFID tags and use of GPS gadgets in terminal operations improves on the general efficiency of the TMS solutions that would translate to wiser terminal facilities.
The development of green operations
-
The development of green operations presents a major opportunity for the progress of the Terminal Management System market. As more companies are called to accountability for sustainability performance, TMS offering terminals an effective means of enhancing their sustainability performance through features that support waste, energy, and emissions management. This has created a good opportunity for vendor organizations to embrace green systems that address sustainability needs of TMS solutions.
- Also, with the continuous construction of smart cities and logistics centers, new opportunities appear for the TMS providers. Such terminals are becoming integrated with other forms of transport and as infrastructure in cities develop terminals are also taking on the attributes of rail, sea and air. TMS systems that have extra options such as multimodal transportation management, real-time information sharing, and cross border management could seize the new opportunities by operating in different smart terminal environments.
Terminal Management System Market Segment Analysis:
Terminal Management System Market Segmented on the basis of Component, Application, End-User, and Region.
By Component, Software segment is expected to dominate the market during the forecast period
-
The Terminal Management System (TMS) market is primarily segmented into three core components: hardware, software, and services. The hardware segment includes all physical devices and infrastructure used in terminal operations, such as sensors, controllers, actuators, and monitoring instruments that ensure accurate data collection and operational efficiency. The software component serves as the central control system of the TMS, offering key functionalities such as inventory tracking, scheduling, regulatory compliance, and analytics to streamline terminal activities. Finally, the services segment comprises a wide range of professional services including system implementation, technical support, maintenance, and consulting. These services are provided by vendors to ensure optimal system performance, continuous upgrades, and effective adaptation of TMS solutions to specific terminal needs and regulatory requirements.
By Application, Oil & Gas segment expected to held the largest share
-
Terminal Management Systems have its main applications in the Oil & Gas, Chemical & Petrochemical, Bulk Material Handling sectors and others. Every Oil & Gas terminal must use TMS to transport both crude oil, refined products, natural gas, and other products in a safe and efficient manner. Chemical & Petrochemical terminals apply TMS technology for managing hazardous products and reaching compliance with the related legislature. Bulk Material Handling is associated with transporting industrial raw materials such as coal, minerals, and grains and; TMS solutions optimize storage, transportation, and supply of the material. The Others category consists of applications in the food and beverages, pharma, and overall transportation industries.
Terminal Management System Market Regional Insights:
Asia Pacific is Expected to Dominate the Market Over the Forecast period
-
Due to the increasing industrial and infrastructure development in this region, the Asia Pacific region holds the largest share in the Terminal Management System market. Many of the Asian countries including China, India and japan are currently devoting a lot of efforts and capital to the modernization of their terminals and especially in oil, gas and chemical industries. TMS for the region has been occasioned by a rise in the automation of supply chain and the drive for efficiency. In addition, Asia Pacific is one of the most important regions for TMS development as major ports and logistics centers are concentrated here while a constantly growing number of terminal operators look for more sophisticated technologies for their operations.
- The region also has favorable government backing from smart port and industrial park transformation, and smart port and industrial park is based on IoT, AI, and big data technology. As Asia Pacific remains to become the manufacturing and export powerhouse in the world, the need for TMS that has capability to manage the complexity of terminal operations will significantly increase.
Active Key Players in the Terminal Management System Market:
-
ABB Ltd. (Switzerland)
- Emerson (USA)
- Honeywell (USA)
- Motive Technologies (USA)
- Rockwell Automation (USA)
- Routescene (UK)
- Schneider Electric (France)
- Siemens AG (Germany)
- TechnipFMC (UK)
- Wärtsilä Corporation (Finland)
- Other Active Players
|
Global Terminal Management System Market |
|||
|
Base Year: |
2023 |
Forecast Period: |
2024-2032 |
|
Historical Data: |
2017 to 2023 |
Market Size in 2023: |
USD 1.24 Billion |
|
Forecast Period 2024-32 CAGR: |
11.22 % |
Market Size in 2032: |
USD 3.22 Billion |
|
Segments Covered: |
By Component |
|
|
|
By Application |
|
||
|
By End-User |
|
||
|
By Region |
|
||
|
Key Market Drivers: |
|
||
|
Key Market Restraints: |
|
||
|
Key Opportunities: |
|
||
|
Companies Covered in the report: |
|
||
Chapter 1: Introduction
1.1 Scope and Coverage
Chapter 2:Executive Summary
Chapter 3: Market Landscape
3.1 Market Dynamics
3.1.1 Drivers
3.1.2 Restraints
3.1.3 Opportunities
3.1.4 Challenges
3.2 Market Trend Analysis
3.3 PESTLE Analysis
3.4 Porter's Five Forces Analysis
3.5 Industry Value Chain Analysis
3.6 Ecosystem
3.7 Regulatory Landscape
3.8 Price Trend Analysis
3.9 Patent Analysis
3.10 Technology Evolution
3.11 Investment Pockets
3.12 Import-Export Analysis
Chapter 4: Terminal Management System Market by System Type
4.1 Terminal Management System Market Snapshot and Growth Engine
4.2 Terminal Management System Market Overview
4.3 Conventional TETRA
4.3.1 Introduction and Market Overview
4.3.2 Historic and Forecasted Market Size in Value USD and Volume Units (2017-2032F)
4.3.3 Key Market Trends, Growth Factors and Opportunities
4.3.4 Conventional TETRA: Geographic Segmentation Analysis
4.4 Trunked Mode Operation (TMO) TETRA.
4.4.1 Introduction and Market Overview
4.4.2 Historic and Forecasted Market Size in Value USD and Volume Units (2017-2032F)
4.4.3 Key Market Trends, Growth Factors and Opportunities
4.4.4 Trunked Mode Operation (TMO) TETRA.: Geographic Segmentation Analysis
Chapter 5: Terminal Management System Market by Component
5.1 Terminal Management System Market Snapshot and Growth Engine
5.2 Terminal Management System Market Overview
5.3 Hardware
5.3.1 Introduction and Market Overview
5.3.2 Historic and Forecasted Market Size in Value USD and Volume Units (2017-2032F)
5.3.3 Key Market Trends, Growth Factors and Opportunities
5.3.4 Hardware: Geographic Segmentation Analysis
5.4 Software
5.4.1 Introduction and Market Overview
5.4.2 Historic and Forecasted Market Size in Value USD and Volume Units (2017-2032F)
5.4.3 Key Market Trends, Growth Factors and Opportunities
5.4.4 Software: Geographic Segmentation Analysis
5.5 Services
5.5.1 Introduction and Market Overview
5.5.2 Historic and Forecasted Market Size in Value USD and Volume Units (2017-2032F)
5.5.3 Key Market Trends, Growth Factors and Opportunities
5.5.4 Services: Geographic Segmentation Analysis
Chapter 6: Terminal Management System Market by Application
6.1 Terminal Management System Market Snapshot and Growth Engine
6.2 Terminal Management System Market Overview
6.3 Public Safety & Security
6.3.1 Introduction and Market Overview
6.3.2 Historic and Forecasted Market Size in Value USD and Volume Units (2017-2032F)
6.3.3 Key Market Trends, Growth Factors and Opportunities
6.3.4 Public Safety & Security: Geographic Segmentation Analysis
6.4 Transportation
6.4.1 Introduction and Market Overview
6.4.2 Historic and Forecasted Market Size in Value USD and Volume Units (2017-2032F)
6.4.3 Key Market Trends, Growth Factors and Opportunities
6.4.4 Transportation: Geographic Segmentation Analysis
6.5 Utilities & Energy
6.5.1 Introduction and Market Overview
6.5.2 Historic and Forecasted Market Size in Value USD and Volume Units (2017-2032F)
6.5.3 Key Market Trends, Growth Factors and Opportunities
6.5.4 Utilities & Energy: Geographic Segmentation Analysis
6.6 Military & Defense
6.6.1 Introduction and Market Overview
6.6.2 Historic and Forecasted Market Size in Value USD and Volume Units (2017-2032F)
6.6.3 Key Market Trends, Growth Factors and Opportunities
6.6.4 Military & Defense: Geographic Segmentation Analysis
6.7 Commercial
6.7.1 Introduction and Market Overview
6.7.2 Historic and Forecasted Market Size in Value USD and Volume Units (2017-2032F)
6.7.3 Key Market Trends, Growth Factors and Opportunities
6.7.4 Commercial: Geographic Segmentation Analysis
6.8 By
6.8.1 Introduction and Market Overview
6.8.2 Historic and Forecasted Market Size in Value USD and Volume Units (2017-2032F)
6.8.3 Key Market Trends, Growth Factors and Opportunities
6.8.4 By: Geographic Segmentation Analysis
Chapter 7: Terminal Management System Market by End User
7.1 Terminal Management System Market Snapshot and Growth Engine
7.2 Terminal Management System Market Overview
7.3 Government & Public Sector
7.3.1 Introduction and Market Overview
7.3.2 Historic and Forecasted Market Size in Value USD and Volume Units (2017-2032F)
7.3.3 Key Market Trends, Growth Factors and Opportunities
7.3.4 Government & Public Sector: Geographic Segmentation Analysis
7.4 Private Sector
7.4.1 Introduction and Market Overview
7.4.2 Historic and Forecasted Market Size in Value USD and Volume Units (2017-2032F)
7.4.3 Key Market Trends, Growth Factors and Opportunities
7.4.4 Private Sector: Geographic Segmentation Analysis
Chapter 8: Company Profiles and Competitive Analysis
8.1 Competitive Landscape
8.1.1 Competitive Benchmarking
8.1.2 Terminal Management System Market Share by Manufacturer (2023)
8.1.3 Industry BCG Matrix
8.1.4 Heat Map Analysis
8.1.5 Mergers and Acquisitions
8.2 EMERSON (USA)
8.2.1 Company Overview
8.2.2 Key Executives
8.2.3 Company Snapshot
8.2.4 Role of the Company in the Market
8.2.5 Sustainability and Social Responsibility
8.2.6 Operating Business Segments
8.2.7 Product Portfolio
8.2.8 Business Performance
8.2.9 Key Strategic Moves and Recent Developments
8.2.10 SWOT Analysis
8.3 HONEYWELL (USA)
8.4 ABB LTD. (SWITZERLAND)
8.5 SIEMENS AG (GERMANY)
8.6 SCHNEIDER ELECTRIC (FRANCE)
8.7 ROCKWELL AUTOMATION (USA)
8.8 TECHNIPFMC (UK)
8.9 ROUTESCENE (UK)
8.10 WÄRTSILÄ CORPORATION (FINLAND)
8.11 MOTIVE TECHNOLOGIES (USA)
8.12 OTHER ACTIVE PLAYERS
Chapter 9: Global Terminal Management System Market By Region
9.1 Overview
9.2. North America Terminal Management System Market
9.2.1 Key Market Trends, Growth Factors and Opportunities
9.2.2 Top Key Companies
9.2.3 Historic and Forecasted Market Size by Segments
9.2.4 Historic and Forecasted Market Size By System Type
9.2.4.1 Conventional TETRA
9.2.4.2 Trunked Mode Operation (TMO) TETRA.
9.2.5 Historic and Forecasted Market Size By Component
9.2.5.1 Hardware
9.2.5.2 Software
9.2.5.3 Services
9.2.6 Historic and Forecasted Market Size By Application
9.2.6.1 Public Safety & Security
9.2.6.2 Transportation
9.2.6.3 Utilities & Energy
9.2.6.4 Military & Defense
9.2.6.5 Commercial
9.2.6.6 By
9.2.7 Historic and Forecasted Market Size By End User
9.2.7.1 Government & Public Sector
9.2.7.2 Private Sector
9.2.8 Historic and Forecast Market Size by Country
9.2.8.1 US
9.2.8.2 Canada
9.2.8.3 Mexico
9.3. Eastern Europe Terminal Management System Market
9.3.1 Key Market Trends, Growth Factors and Opportunities
9.3.2 Top Key Companies
9.3.3 Historic and Forecasted Market Size by Segments
9.3.4 Historic and Forecasted Market Size By System Type
9.3.4.1 Conventional TETRA
9.3.4.2 Trunked Mode Operation (TMO) TETRA.
9.3.5 Historic and Forecasted Market Size By Component
9.3.5.1 Hardware
9.3.5.2 Software
9.3.5.3 Services
9.3.6 Historic and Forecasted Market Size By Application
9.3.6.1 Public Safety & Security
9.3.6.2 Transportation
9.3.6.3 Utilities & Energy
9.3.6.4 Military & Defense
9.3.6.5 Commercial
9.3.6.6 By
9.3.7 Historic and Forecasted Market Size By End User
9.3.7.1 Government & Public Sector
9.3.7.2 Private Sector
9.3.8 Historic and Forecast Market Size by Country
9.3.8.1 Russia
9.3.8.2 Bulgaria
9.3.8.3 The Czech Republic
9.3.8.4 Hungary
9.3.8.5 Poland
9.3.8.6 Romania
9.3.8.7 Rest of Eastern Europe
9.4. Western Europe Terminal Management System Market
9.4.1 Key Market Trends, Growth Factors and Opportunities
9.4.2 Top Key Companies
9.4.3 Historic and Forecasted Market Size by Segments
9.4.4 Historic and Forecasted Market Size By System Type
9.4.4.1 Conventional TETRA
9.4.4.2 Trunked Mode Operation (TMO) TETRA.
9.4.5 Historic and Forecasted Market Size By Component
9.4.5.1 Hardware
9.4.5.2 Software
9.4.5.3 Services
9.4.6 Historic and Forecasted Market Size By Application
9.4.6.1 Public Safety & Security
9.4.6.2 Transportation
9.4.6.3 Utilities & Energy
9.4.6.4 Military & Defense
9.4.6.5 Commercial
9.4.6.6 By
9.4.7 Historic and Forecasted Market Size By End User
9.4.7.1 Government & Public Sector
9.4.7.2 Private Sector
9.4.8 Historic and Forecast Market Size by Country
9.4.8.1 Germany
9.4.8.2 UK
9.4.8.3 France
9.4.8.4 The Netherlands
9.4.8.5 Italy
9.4.8.6 Spain
9.4.8.7 Rest of Western Europe
9.5. Asia Pacific Terminal Management System Market
9.5.1 Key Market Trends, Growth Factors and Opportunities
9.5.2 Top Key Companies
9.5.3 Historic and Forecasted Market Size by Segments
9.5.4 Historic and Forecasted Market Size By System Type
9.5.4.1 Conventional TETRA
9.5.4.2 Trunked Mode Operation (TMO) TETRA.
9.5.5 Historic and Forecasted Market Size By Component
9.5.5.1 Hardware
9.5.5.2 Software
9.5.5.3 Services
9.5.6 Historic and Forecasted Market Size By Application
9.5.6.1 Public Safety & Security
9.5.6.2 Transportation
9.5.6.3 Utilities & Energy
9.5.6.4 Military & Defense
9.5.6.5 Commercial
9.5.6.6 By
9.5.7 Historic and Forecasted Market Size By End User
9.5.7.1 Government & Public Sector
9.5.7.2 Private Sector
9.5.8 Historic and Forecast Market Size by Country
9.5.8.1 China
9.5.8.2 India
9.5.8.3 Japan
9.5.8.4 South Korea
9.5.8.5 Malaysia
9.5.8.6 Thailand
9.5.8.7 Vietnam
9.5.8.8 The Philippines
9.5.8.9 Australia
9.5.8.10 New Zealand
9.5.8.11 Rest of APAC
9.6. Middle East & Africa Terminal Management System Market
9.6.1 Key Market Trends, Growth Factors and Opportunities
9.6.2 Top Key Companies
9.6.3 Historic and Forecasted Market Size by Segments
9.6.4 Historic and Forecasted Market Size By System Type
9.6.4.1 Conventional TETRA
9.6.4.2 Trunked Mode Operation (TMO) TETRA.
9.6.5 Historic and Forecasted Market Size By Component
9.6.5.1 Hardware
9.6.5.2 Software
9.6.5.3 Services
9.6.6 Historic and Forecasted Market Size By Application
9.6.6.1 Public Safety & Security
9.6.6.2 Transportation
9.6.6.3 Utilities & Energy
9.6.6.4 Military & Defense
9.6.6.5 Commercial
9.6.6.6 By
9.6.7 Historic and Forecasted Market Size By End User
9.6.7.1 Government & Public Sector
9.6.7.2 Private Sector
9.6.8 Historic and Forecast Market Size by Country
9.6.8.1 Turkiye
9.6.8.2 Bahrain
9.6.8.3 Kuwait
9.6.8.4 Saudi Arabia
9.6.8.5 Qatar
9.6.8.6 UAE
9.6.8.7 Israel
9.6.8.8 South Africa
9.7. South America Terminal Management System Market
9.7.1 Key Market Trends, Growth Factors and Opportunities
9.7.2 Top Key Companies
9.7.3 Historic and Forecasted Market Size by Segments
9.7.4 Historic and Forecasted Market Size By System Type
9.7.4.1 Conventional TETRA
9.7.4.2 Trunked Mode Operation (TMO) TETRA.
9.7.5 Historic and Forecasted Market Size By Component
9.7.5.1 Hardware
9.7.5.2 Software
9.7.5.3 Services
9.7.6 Historic and Forecasted Market Size By Application
9.7.6.1 Public Safety & Security
9.7.6.2 Transportation
9.7.6.3 Utilities & Energy
9.7.6.4 Military & Defense
9.7.6.5 Commercial
9.7.6.6 By
9.7.7 Historic and Forecasted Market Size By End User
9.7.7.1 Government & Public Sector
9.7.7.2 Private Sector
9.7.8 Historic and Forecast Market Size by Country
9.7.8.1 Brazil
9.7.8.2 Argentina
9.7.8.3 Rest of SA
Chapter 10 Analyst Viewpoint and Conclusion
10.1 Recommendations and Concluding Analysis
10.2 Potential Market Strategies
Chapter 11 Research Methodology
11.1 Research Process
11.2 Primary Research
11.3 Secondary Research
|
Global Terminal Management System Market |
|||
|
Base Year: |
2023 |
Forecast Period: |
2024-2032 |
|
Historical Data: |
2017 to 2023 |
Market Size in 2023: |
USD 1.24 Billion |
|
Forecast Period 2024-32 CAGR: |
11.22 % |
Market Size in 2032: |
USD 3.22 Billion |
|
Segments Covered: |
By Component |
|
|
|
By Application |
|
||
|
By End-User |
|
||
|
By Region |
|
||
|
Key Market Drivers: |
|
||
|
Key Market Restraints: |
|
||
|
Key Opportunities: |
|
||
|
Companies Covered in the report: |
|
||


