


Smart Waste Market Synopsis
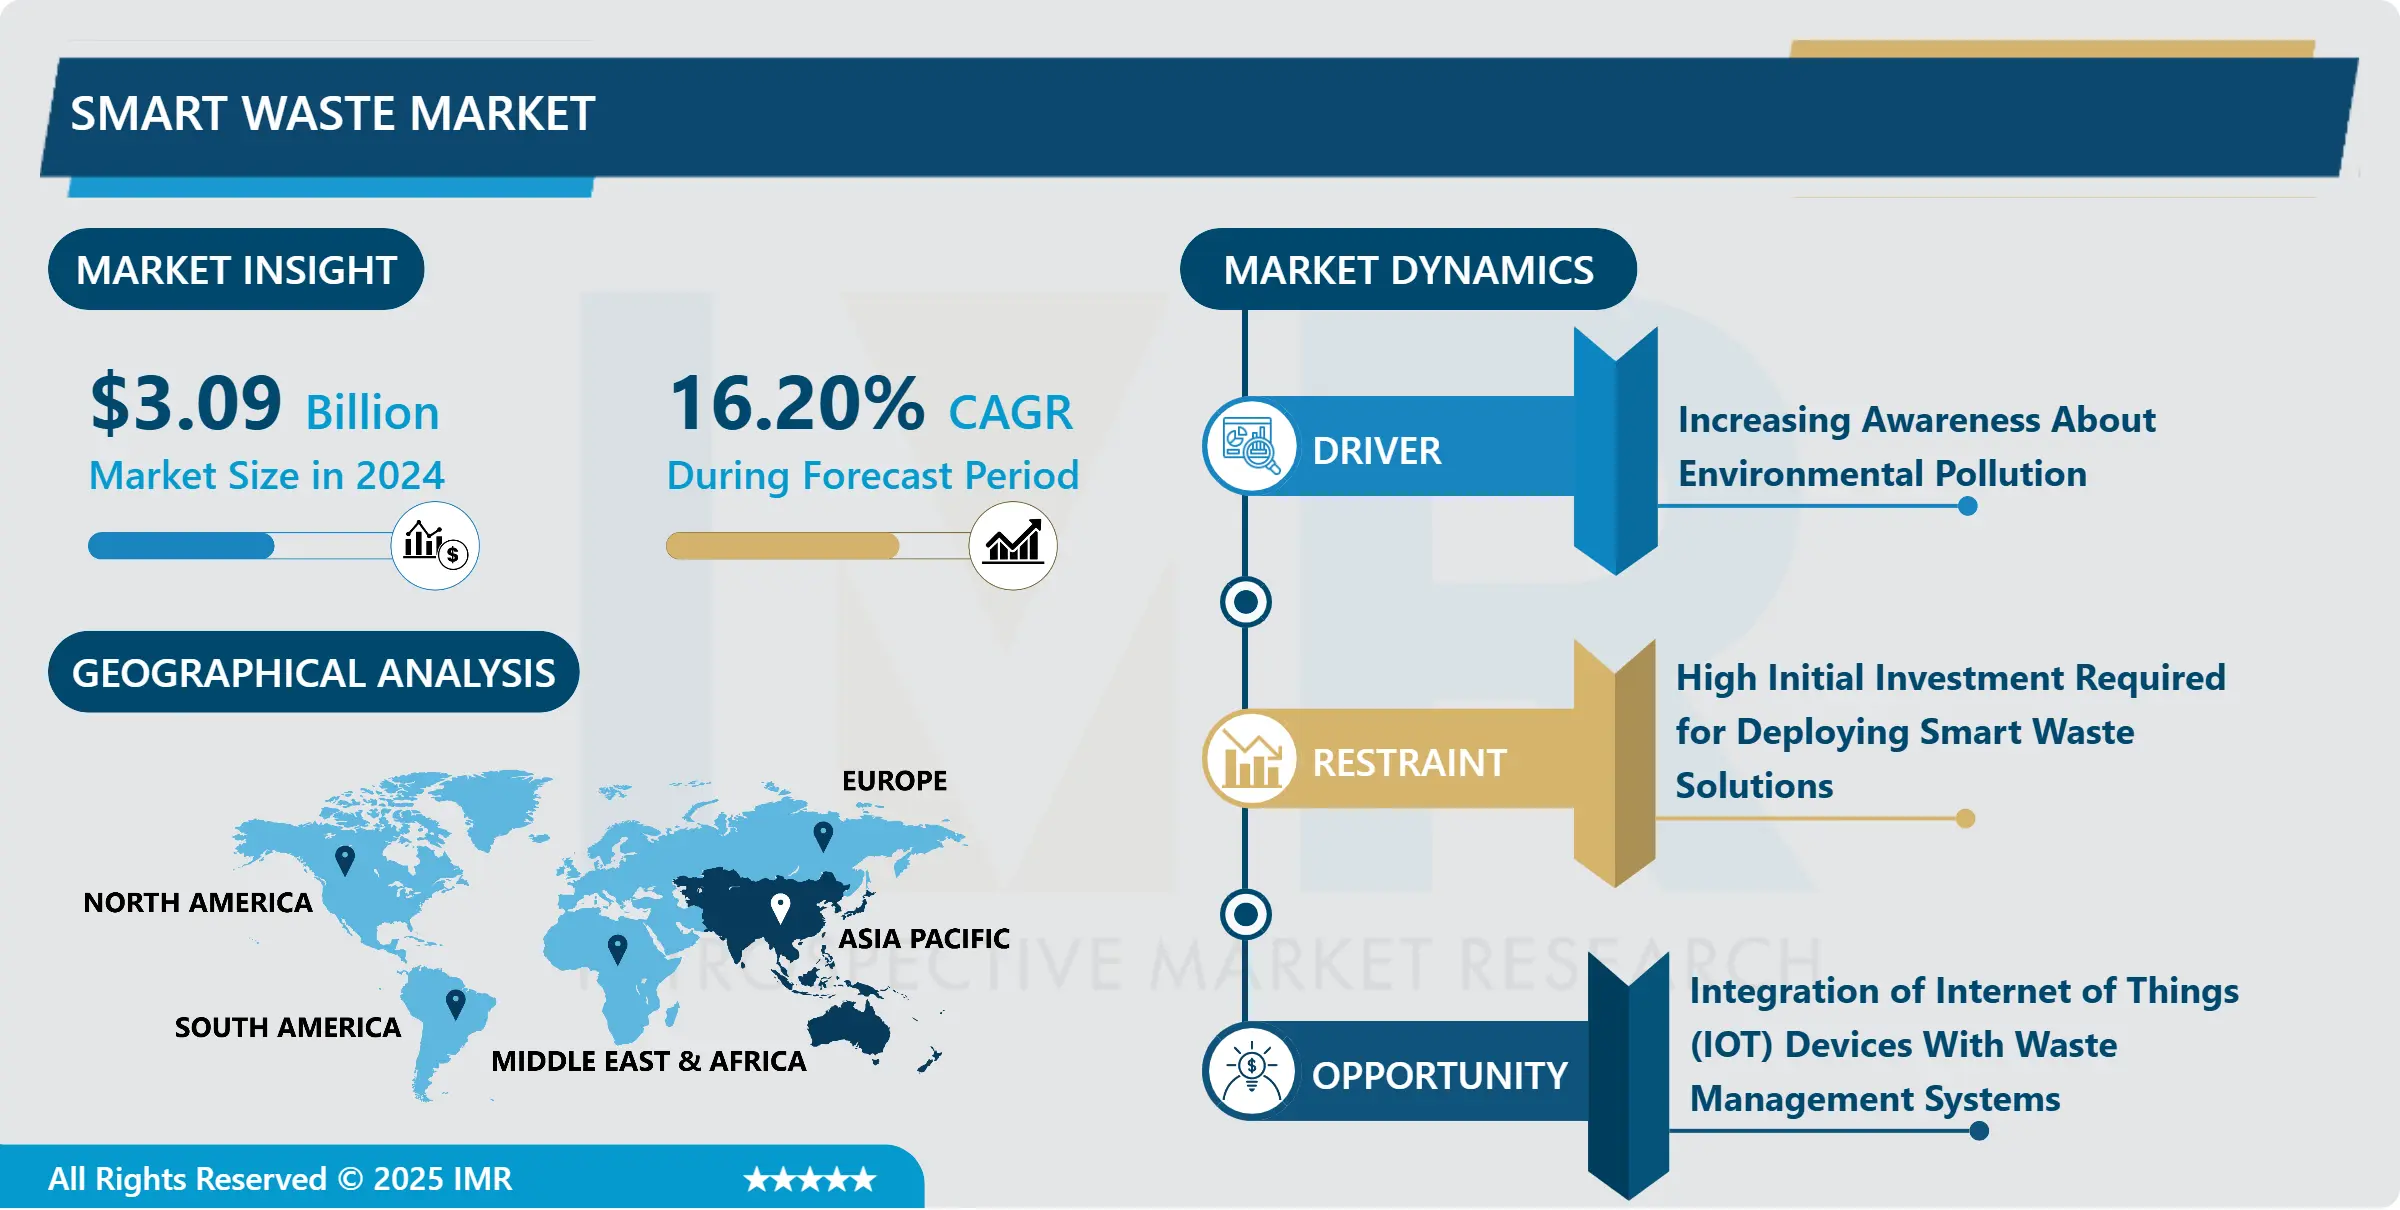
Smart Waste Market Size Was Valued at USD 3.09 Billion in 2024, and is Projected to Reach USD 10.27 Billion by 2032, Growing at a CAGR of 16.20 % From 2025-2032.
Smart waste refers to the integration of technology and data analytics into waste management systems to optimize efficiency and sustainability. It involves the use of sensors, IoT devices, and data analytics to monitor waste levels, optimize collection routes, and reduce environmental impact. By leveraging real-time data, smart waste management enables timely interventions, minimizes operational costs, and promotes recycling and resource recovery, contributing to a cleaner and more sustainable environment.
The Smart Waste Market refers to the integration of various technologies and solutions to efficiently manage waste collection, recycling, and disposal processes. These technologies include sensors, IoT devices, data analytics, and cloud computing, among others. One of the key drivers of the Smart Waste Market is the increasing global population and urbanization, leading to higher volumes of waste generated. Traditional waste management methods are often inefficient and can lead to environmental pollution and health hazards.
Smart waste management systems address these challenges by providing real-time monitoring of waste levels in bins, optimizing collection routes to reduce fuel consumption and emissions, and enabling better decision-making through data analytics. These systems also promote recycling and sustainability by identifying opportunities for waste diversion and resource recovery. Additionally, they enhance public hygiene and sanitation by ensuring timely collection and disposal of waste.
The Smart Waste Market is witnessing significant growth due to government initiatives aimed at improving waste management practices, increasing awareness about environmental sustainability, and advancements in technology. Key players in the market include waste management companies, technology providers, and municipalities. They collaborate to develop innovative solutions and deploy them in various urban and industrial settings. The Smart Waste Market is poised for further expansion as societies continue to prioritize sustainable waste management practices to address environmental concerns and resource scarcity.

Smart Waste Market Trend Analysis
Increasing Awareness About Environmental Pollution
- There is a growing demand for awareness of the harmful impacts of pollution on ecosystems and human health has driven governments, industries, and communities to seek innovative solutions. Environmental pollution, encompassing air, water, and land pollution, has reached alarming levels due to improper waste management practices.
- The integrating sensors, IoT devices, and data analytics, these solutions optimize waste collection, recycling processes, and landfill management. They enable real-time monitoring of waste levels, detection of leaks or spills, and efficient routing for collection vehicles, thereby minimizing environmental contamination and reducing carbon footprints.
- Moreover, raising awareness about environmental pollution's dire consequences is crucial for fostering public support and driving the adoption of smart waste solutions. Educational initiatives, advocacy campaigns, and community engagement programs play pivotal roles in enlightening individuals and organizations about the urgent need for sustainable waste management practices. By harnessing technological advancements and promoting environmental consciousness, the smart waste market not only addresses the pollution crisis but also paves the way toward a cleaner, healthier future.
Integration of Internet Of Things (IOT) Devices With Waste Management Systems
- Integration of Internet of Things (IoT) devices with waste management systems will offer innovative technologies that offer a multifaceted approach to waste management, enhancing efficiency, sustainability, and cost-effectiveness. By seamlessly connecting IoT devices to waste bins, containers, and collection vehicles, municipalities and businesses gain real-time insights into waste generation, collection schedules, and bin capacity. This data empowers stakeholders to optimize collection routes, reduce fuel consumption, and minimize carbon emissions.
- Furthermore, IoT sensors can detect differences such as overflowing bins or hazardous materials, enabling swift response and mitigating potential risks to public health and the environment. Predictive analytics derived from IoT data facilitate proactive maintenance, preventing equipment failures and minimizing downtime. The integration with smart waste management platforms enables remote monitoring and control, fostering remote operation and management capabilities.
- The integration of IoT devices with waste management systems will streamline operations and promote environmental sustainability, resource conservation, and smarter urban planning.
Smart Waste Market Segment Analysis:
Smart Waste Market Segmented based on Offering, Function, Application and Region
By Offering, Solutions segment is expected to dominate the market during the forecast period
- Smart waste solutions encompass a wide array of technologies and services that optimize waste collection, monitoring, and processing. These solutions leverage advanced sensors, IoT connectivity, data analytics, and automation to streamline waste management processes, reduce operational costs, and enhance efficiency. Additionally, they enable real-time monitoring of waste levels, allowing for timely collection and route optimization.
- Moreover, smart waste solutions often integrate with existing infrastructure, making them scalable and adaptable to various urban environments. Their ability to minimize environmental impact, improve resource utilization, and enhance public health and safety further contributes to their widespread adoption. As a result, the Solutions segment emerges as the leader in the Smart Waste Market, offering holistic and innovative approaches to modernize waste management practices.
By Function, Smart Waste Processing segment held the largest share in 2024
- The Smart Waste Processing segment dominates the Smart Waste Market primarily due to its essential role in optimizing waste management processes. By integrating advanced technologies such as IoT sensors, AI algorithms, and data analytics, Smart Waste Processing solutions offer efficient waste collection, sorting, and recycling mechanisms. These systems enable real-time monitoring of waste levels, route optimization for collection vehicles, and predictive maintenance of waste infrastructure, leading to cost savings and environmental benefits.
- Moreover, Smart Waste Processing solutions enhance operational transparency and accountability, facilitating compliance with regulatory standards and sustainability goals. The ability to streamline waste management operations, minimize resource wastage, and reduce environmental impact positions Smart Waste Processing as a pivotal component in smart city initiatives and corporate sustainability strategies, thereby driving its dominance in the Smart Waste Market.
Smart Waste Market Regional Insights:
Asia Pacific is Expected to Dominate the Market Over the Forecast period
- The Asia Pacific region boasts a large and tech-savvy consumer base, with a strong appetite for innovative gadgets and wearable technology. This consumer demand drives investment and development in the smart tattoo market, encouraging companies to introduce new products and improve existing ones to cater to the preferences of the local population.
- The Asia Pacific region dominates the smart tattoo market due to several key factors. Asia Pacific is home to some of the world's largest technology manufacturing hubs, particularly in countries like China, Japan, South Korea, and Taiwan. This allows for efficient production and distribution of smart tattoo devices and components, reducing costs and increasing accessibility within the region.
- The government initiatives and policies in countries like China and South Korea promote research and development in emerging technologies, including smart tattoos. This support fosters a conducive environment for innovation and entrepreneurship, further driving the growth of the market in the region.
- Furthermore, cultural factors such as a high level of comfort with technology and a trend towards individuality and self-expression contribute to the popularity of smart tattoos in Asia Pacific. These cultural inclinations create a receptive market for smart tattoo products and encourage adoption among diverse demographic groups, driving the region's dominance in the global smart tattoo market.
Top Key Players:
- Covanta Energy (United States)
- Republic Services (United States)
- Waste Management (United States)
- Harvest Power (United States)
- Bigbelly (United States)
- Enerkem (Canada)
- RecycleSmart Solutions (Canada)
- BRE SMARTWaste (United Kingdom)
- ROS ROCA's (Spain)
- Enevo (Finland)
- Suez Environment (France)
- Other Active players.
Key Industry Smart Waste Market Developments in the Smart Waste Market:
- In April 2024, following two years of investment, transformation, and growth, Covanta, which has been known as a leading waste-to-energy provider, proudly announces the next milestone in its strategic evolution as a pioneering sustainable waste solutions company with its new identity. Reworld™ transformed itself into a multifaceted entity, expanding its geographic footprint, unparalleled innovative solutions for waste management, and adopting a fully regionalized approach focused on enhancing the customer experience. T
- In January 2024, WePower Technologies launched at CES three prototypes of energy harvesting generators, part of its Gemns EHG line, based on the mechanism of electromagnetic induction to achieve higher voltage levels compared to existing EHGs. The primary objective of these solutions is to support self-sustaining wireless devices, eliminating the need for batteries.
|
Global Smart Waste Market |
|||
|
Base Year: |
2024 |
Forecast Period: |
2025-2032 |
|
Historical Data: |
2018 to 2023 |
Market Size in 2024: |
USD 3.09 Bn. |
|
Forecast Period 2025-32 CAGR: |
16.20 % |
Market Size in 2032: |
USD 10.27 Bn. |
|
Segments Covered: |
By Offering |
|
|
|
By Function |
|
||
|
By Application |
|
||
|
By Region |
|
||
|
Key Market Drivers: |
|
||
|
Key Market Restraints: |
|
||
|
Key Opportunities: |
|
||
|
Companies Covered in the report: |
|
||
Chapter 1: Introduction
1.1 Scope and Coverage
Chapter 2:Executive Summary
Chapter 3: Market Landscape
3.1 Market Dynamics
3.1.1 Drivers
3.1.2 Restraints
3.1.3 Opportunities
3.1.4 Challenges
3.2 Market Trend Analysis
3.3 PESTLE Analysis
3.4 Porter's Five Forces Analysis
3.5 Industry Value Chain Analysis
3.6 Ecosystem
3.7 Regulatory Landscape
3.8 Price Trend Analysis
3.9 Patent Analysis
3.10 Technology Evolution
3.11 Investment Pockets
3.12 Import-Export Analysis
Chapter 4: Smart Waste Market by Offering (2018-2032)
4.1 Smart Waste Market Snapshot and Growth Engine
4.2 Market Overview
4.3 Solutions
4.3.1 Introduction and Market Overview
4.3.2 Historic and Forecasted Market Size in Value USD and Volume Units
4.3.3 Key Market Trends, Growth Factors, and Opportunities
4.3.4 Geographic Segmentation Analysis
4.4 Services
Chapter 5: Smart Waste Market by Function (2018-2032)
5.1 Smart Waste Market Snapshot and Growth Engine
5.2 Market Overview
5.3 Smart Waste Collection
5.3.1 Introduction and Market Overview
5.3.2 Historic and Forecasted Market Size in Value USD and Volume Units
5.3.3 Key Market Trends, Growth Factors, and Opportunities
5.3.4 Geographic Segmentation Analysis
5.4 Smart Waste Processing
5.5 Smart Waste Disposal
5.6 Smart Waste to Energy Recovery
Chapter 6: Smart Waste Market by Application (2018-2032)
6.1 Smart Waste Market Snapshot and Growth Engine
6.2 Market Overview
6.3 Residential & Municipality
6.3.1 Introduction and Market Overview
6.3.2 Historic and Forecasted Market Size in Value USD and Volume Units
6.3.3 Key Market Trends, Growth Factors, and Opportunities
6.3.4 Geographic Segmentation Analysis
6.4 Industrial
6.5 Commercial
6.6 Construction & Demolition
6.7 Energy
6.8 Water Supply & Sewage Treatment
Chapter 7: Company Profiles and Competitive Analysis
7.1 Competitive Landscape
7.1.1 Competitive Benchmarking
7.1.2 Smart Waste Market Share by Manufacturer (2024)
7.1.3 Industry BCG Matrix
7.1.4 Heat Map Analysis
7.1.5 Mergers and Acquisitions
7.2 VERISILICON (CHINA)
7.2.1 Company Overview
7.2.2 Key Executives
7.2.3 Company Snapshot
7.2.4 Role of the Company in the Market
7.2.5 Sustainability and Social Responsibility
7.2.6 Operating Business Segments
7.2.7 Product Portfolio
7.2.8 Business Performance
7.2.9 Key Strategic Moves and Recent Developments
7.2.10 SWOT Analysis
7.3 TILERA (CALIFORNIA)
7.4 FRONTIER SILICON (UK)
7.5 SILICON STORAGE TECHNOLOGY (CALIFORNIA)
7.6 MACRONIX INTERNATIONAL (CHINA)
7.7 CROSSING AUTOMATION (US)
7.8 SANKALP SEMICONDUCTOR (US)
7.9 CACTUS SEMICONDUCTOR (US)
7.10 MOSYS (CALIFORNIA)
7.11 NETRONOME (US)
7.12
Chapter 8: Global Smart Waste Market By Region
8.1 Overview
8.2. North America Smart Waste Market
8.2.1 Key Market Trends, Growth Factors and Opportunities
8.2.2 Top Key Companies
8.2.3 Historic and Forecasted Market Size by Segments
8.2.4 Historic and Forecasted Market Size by Offering
8.2.4.1 Solutions
8.2.4.2 Services
8.2.5 Historic and Forecasted Market Size by Function
8.2.5.1 Smart Waste Collection
8.2.5.2 Smart Waste Processing
8.2.5.3 Smart Waste Disposal
8.2.5.4 Smart Waste to Energy Recovery
8.2.6 Historic and Forecasted Market Size by Application
8.2.6.1 Residential & Municipality
8.2.6.2 Industrial
8.2.6.3 Commercial
8.2.6.4 Construction & Demolition
8.2.6.5 Energy
8.2.6.6 Water Supply & Sewage Treatment
8.2.7 Historic and Forecast Market Size by Country
8.2.7.1 US
8.2.7.2 Canada
8.2.7.3 Mexico
8.3. Eastern Europe Smart Waste Market
8.3.1 Key Market Trends, Growth Factors and Opportunities
8.3.2 Top Key Companies
8.3.3 Historic and Forecasted Market Size by Segments
8.3.4 Historic and Forecasted Market Size by Offering
8.3.4.1 Solutions
8.3.4.2 Services
8.3.5 Historic and Forecasted Market Size by Function
8.3.5.1 Smart Waste Collection
8.3.5.2 Smart Waste Processing
8.3.5.3 Smart Waste Disposal
8.3.5.4 Smart Waste to Energy Recovery
8.3.6 Historic and Forecasted Market Size by Application
8.3.6.1 Residential & Municipality
8.3.6.2 Industrial
8.3.6.3 Commercial
8.3.6.4 Construction & Demolition
8.3.6.5 Energy
8.3.6.6 Water Supply & Sewage Treatment
8.3.7 Historic and Forecast Market Size by Country
8.3.7.1 Russia
8.3.7.2 Bulgaria
8.3.7.3 The Czech Republic
8.3.7.4 Hungary
8.3.7.5 Poland
8.3.7.6 Romania
8.3.7.7 Rest of Eastern Europe
8.4. Western Europe Smart Waste Market
8.4.1 Key Market Trends, Growth Factors and Opportunities
8.4.2 Top Key Companies
8.4.3 Historic and Forecasted Market Size by Segments
8.4.4 Historic and Forecasted Market Size by Offering
8.4.4.1 Solutions
8.4.4.2 Services
8.4.5 Historic and Forecasted Market Size by Function
8.4.5.1 Smart Waste Collection
8.4.5.2 Smart Waste Processing
8.4.5.3 Smart Waste Disposal
8.4.5.4 Smart Waste to Energy Recovery
8.4.6 Historic and Forecasted Market Size by Application
8.4.6.1 Residential & Municipality
8.4.6.2 Industrial
8.4.6.3 Commercial
8.4.6.4 Construction & Demolition
8.4.6.5 Energy
8.4.6.6 Water Supply & Sewage Treatment
8.4.7 Historic and Forecast Market Size by Country
8.4.7.1 Germany
8.4.7.2 UK
8.4.7.3 France
8.4.7.4 The Netherlands
8.4.7.5 Italy
8.4.7.6 Spain
8.4.7.7 Rest of Western Europe
8.5. Asia Pacific Smart Waste Market
8.5.1 Key Market Trends, Growth Factors and Opportunities
8.5.2 Top Key Companies
8.5.3 Historic and Forecasted Market Size by Segments
8.5.4 Historic and Forecasted Market Size by Offering
8.5.4.1 Solutions
8.5.4.2 Services
8.5.5 Historic and Forecasted Market Size by Function
8.5.5.1 Smart Waste Collection
8.5.5.2 Smart Waste Processing
8.5.5.3 Smart Waste Disposal
8.5.5.4 Smart Waste to Energy Recovery
8.5.6 Historic and Forecasted Market Size by Application
8.5.6.1 Residential & Municipality
8.5.6.2 Industrial
8.5.6.3 Commercial
8.5.6.4 Construction & Demolition
8.5.6.5 Energy
8.5.6.6 Water Supply & Sewage Treatment
8.5.7 Historic and Forecast Market Size by Country
8.5.7.1 China
8.5.7.2 India
8.5.7.3 Japan
8.5.7.4 South Korea
8.5.7.5 Malaysia
8.5.7.6 Thailand
8.5.7.7 Vietnam
8.5.7.8 The Philippines
8.5.7.9 Australia
8.5.7.10 New Zealand
8.5.7.11 Rest of APAC
8.6. Middle East & Africa Smart Waste Market
8.6.1 Key Market Trends, Growth Factors and Opportunities
8.6.2 Top Key Companies
8.6.3 Historic and Forecasted Market Size by Segments
8.6.4 Historic and Forecasted Market Size by Offering
8.6.4.1 Solutions
8.6.4.2 Services
8.6.5 Historic and Forecasted Market Size by Function
8.6.5.1 Smart Waste Collection
8.6.5.2 Smart Waste Processing
8.6.5.3 Smart Waste Disposal
8.6.5.4 Smart Waste to Energy Recovery
8.6.6 Historic and Forecasted Market Size by Application
8.6.6.1 Residential & Municipality
8.6.6.2 Industrial
8.6.6.3 Commercial
8.6.6.4 Construction & Demolition
8.6.6.5 Energy
8.6.6.6 Water Supply & Sewage Treatment
8.6.7 Historic and Forecast Market Size by Country
8.6.7.1 Turkiye
8.6.7.2 Bahrain
8.6.7.3 Kuwait
8.6.7.4 Saudi Arabia
8.6.7.5 Qatar
8.6.7.6 UAE
8.6.7.7 Israel
8.6.7.8 South Africa
8.7. South America Smart Waste Market
8.7.1 Key Market Trends, Growth Factors and Opportunities
8.7.2 Top Key Companies
8.7.3 Historic and Forecasted Market Size by Segments
8.7.4 Historic and Forecasted Market Size by Offering
8.7.4.1 Solutions
8.7.4.2 Services
8.7.5 Historic and Forecasted Market Size by Function
8.7.5.1 Smart Waste Collection
8.7.5.2 Smart Waste Processing
8.7.5.3 Smart Waste Disposal
8.7.5.4 Smart Waste to Energy Recovery
8.7.6 Historic and Forecasted Market Size by Application
8.7.6.1 Residential & Municipality
8.7.6.2 Industrial
8.7.6.3 Commercial
8.7.6.4 Construction & Demolition
8.7.6.5 Energy
8.7.6.6 Water Supply & Sewage Treatment
8.7.7 Historic and Forecast Market Size by Country
8.7.7.1 Brazil
8.7.7.2 Argentina
8.7.7.3 Rest of SA
Chapter 9 Analyst Viewpoint and Conclusion
9.1 Recommendations and Concluding Analysis
9.2 Potential Market Strategies
Chapter 10 Research Methodology
10.1 Research Process
10.2 Primary Research
10.3 Secondary Research
|
Global Smart Waste Market |
|||
|
Base Year: |
2024 |
Forecast Period: |
2025-2032 |
|
Historical Data: |
2018 to 2023 |
Market Size in 2024: |
USD 3.09 Bn. |
|
Forecast Period 2025-32 CAGR: |
16.20 % |
Market Size in 2032: |
USD 10.27 Bn. |
|
Segments Covered: |
By Offering |
|
|
|
By Function |
|
||
|
By Application |
|
||
|
By Region |
|
||
|
Key Market Drivers: |
|
||
|
Key Market Restraints: |
|
||
|
Key Opportunities: |
|
||
|
Companies Covered in the report: |
|
||


