


Global Smart Transportation Market Overview
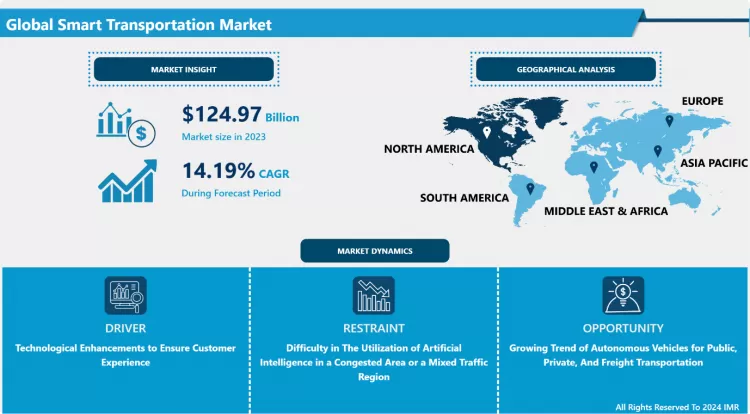
Global Smart Transportation Market was estimated at USD 124.97 billion in 2023 and is anticipated to reach USD 412.53 billion by 2032, growing at a CAGR of 14.19% globally.
Smart Transportation Systems (STS) leverage an array of advanced technologies, such as traffic signal control systems, automatic number plate recognition, container management systems, and speed cameras, including security CCTV systems, to evaluate, manage, and monitor transportation infrastructures. These technologies aim to enhance the efficiency and safety of transportation services, making them integral to modern mobility solutions. A key aspect of smart transportation involves utilizing Artificial Intelligence (AI) to automate various aspects of transportation, shifting the burden of managing vehicles and infrastructure from humans to technology. This transition aims to mitigate human-related errors, particularly those leading to traffic accidents, thereby reducing crash-related costs and improving overall transportation safety.
- The deployment of smart transportation technologies provides innovative solutions across various transport modes, enabling consumers to plan their journeys more efficiently and safely. The integration of advanced systems enhances the overall travel experience by offering real-time updates, optimized routes, and smart navigation services. Additionally, the global movement towards smart cities is set to be a significant catalyst for the growth of the smart transportation market. As urban areas expand and populations grow, the need for efficient, technology-driven transportation systems becomes imperative to sustain mobility and reduce urban congestion.
- The rollout of 5G networks is poised to be a game-changer for smart transportation, complementing advancements in AI and embedded systems. 5G technology significantly enhances the networking and processing capabilities of smart vehicles, improving the efficiency and reliability of communication between devices and vehicles. Innovations such as side-link transmission within 5G allow for peer-to-peer communication without relying on cell towers, enabling proximity-based services like real-time parking availability, lighting control, maps, wayfinding, and highly accurate positioning down to the centimeter. These advancements are expected to drive the adoption and scalability of smart transportation systems, as they enable more seamless and efficient interactions within the transportation ecosystem.
- The economic and environmental benefits of smart transportation are profound. For example, travel delays currently waste approximately three billion gallons of fuel and seven billion hours of commuter time annually. In 2015, Americans spent an estimated 75 billion hours in traffic. The adoption of smart transportation systems could save up to $507 billion in productivity, $488 billion in accident-related costs, and $138 billion in reduced congestion. These savings highlight the transformative potential of smart transportation in addressing modern transportation challenges while paving the way for a more sustainable and efficient future in mobility solutions.

Market Dynamics and Key Factors in Smart Transportation Market
Drivers:
- By combining machine learning with IoT and 5G, smart transportation has proven to decrease the human component in accidents attributed to the fact, computers don't get distracted or fatigued, or emotional. Moreover, the collection of data is the vital key, responsible for public management of infrastructure further, smart transportation provides detailed data points for every aspect of the transportation system, but allows administrators to better monitor operations, track maintenance needs, and identify key sources of problems that need to be fixed thus, supporting the growth of smart transportation market in the period of forecast.
- Furthermore, smart transportation allows traffic management systems to quickly analyze congestion on city roads and accordingly divert traffic. Smart transportation has proven to be more efficient owing to factors such as, an adjustment in timing of train schedules can aid in increasing the fill rates and bus facilities can efficiently serve the consumers if stops are allocated according to the area-wise density of population. Moreover, smart transportation offers a navigation system to the user to find the best suitable route based on real-time conditions.
- Users can ride public transport buses which turns red traffic light into green upon arrival. Additionally, it offers travelers with information about road conditions, weather emergencies, and manage fuel consumption. All these factors are strengthening the growth of the smart transportation market throughout the forecast. Moreover, smart transportation provides information about parking areas in the vicinity with the help of GPS. Smart transportation alerts drivers about hazardous situations in time to avoid crashes.
Restraints:
- Artificial intelligence is the latest innovative technology that provides solutions to every aspect of transportation mode. The difficulty in the utilization of Artificial intelligence in a congested area or a mixed traffic region is hampering the growth of the Smart Transportation Market in the forecast period. Moreover, the complexity involved in understanding the use of smart transportation services is further restricting the Smart Transportation Market growth. The major factor hindering the Smart Transportation Market growth is the cost of the equipment involved in the smart transportation services and high maintenance costs. Furthermore, the software system that controls the transportation system can be hacked by hackers. In certain instances, such as an emergency or congestion due to an accident, the smart transportation system can't make a quick and accurate response. Additionally, the limited availability of data collection systems is further hampering the Smart Transportation Market growth throughout the forecast period.
Opportunities:
- The growing trend of autonomous vehicles for public, private, and freight transportation has witnessed a rapid evolution owing to technological advancements in artificial intelligence and the Internet of things. These automatic vehicles require minimal or no human intervention. The curiosity of driverless vehicles among the general population is instigating market players to launch vehicles that can be operated with the help of AI and IoT (Internet on Things). The increase in the number of road accidents and the time required for medical services to reach accident spots through the congested traffic areas is providing opportunities for market players of Smart Transportation such as to build road maps for medical services to reach accident spots in time. The growing inconvenience of parking due to rising vehicle numbers and the irritation of freight transportation to the local population are generating ample opportunities for market players of smart transportation.
Challenges:
- Providing accurate road data for roadway transportation and the correct time of arrival and departure of airlines and railways are the major challenges for market players of smart transportation. Moreover, developing public-private partnerships and collaborating with institutions to resolve air quality, traffic congestion, and sustainability issues are some major challenges. Furthermore, to minimize the cost involved in the developments of smart transportation and the open nature of smart transportation as wireless communication which can cause many securities and privacy challenges are some challenges that are posing threats to the implementation of smart transportation.
Market Segmentation
Segmentation Analysis of Smart Transportation Market:
- Depending on Transportation Mode, Smart Transportation Market is segmented into roadways, railways, airways, and maritime. The roadways segment is anticipated to dominate the market in the period of forecast attributed to factors such as enhancement in road safety for the driver, pedestrians, and passengers, to reduce the accident rates in high-density populated regions. Moreover, the majority of the population uses roadways to carry out their day-to-day activities. The railway segment is estimated to have the second-highest share in Smart Transportation Market owing to the huge number of individuals using railways for long-distance routes.
- Depending on the Technology Used, Smart Transportation Market is segmented into cloud computing, artificial intelligence, and the Internet of Things. The artificial intelligence segment is expected to dominate the market attributed the factors such as it helps in making transportation modes safer and comfortable. Moreover, Artificial intelligence can also analyze a large amount of data and help the service provider to plan, design, and control road transport networks. Internet of things is estimated to have the highest growth rate in the market owing to the advancement and development in this segment. Moreover, the connection of automobiles to the internet of things is expected to reduce accident rates thus boosting the segment growth. The combination of AI and cloud computing is a segment to watch out for but as this innovative technology is only in talks, nothing can be predicted on this.
- Depending upon the Solution, the traffic management sector is anticipated to have the highest market share in the period of forecast. The growing number of vehicles has resulted in congestion, air pollution, and an increase in road accidents. Moreover, to provide medical services more efficiently and on time, traffic management is very important. Furthermore, to reduce the emission of greenhouse gases in urban areas traffic management has proven effective thus promoting the growth of traffic management solutions in the period of forecast. The ticket management system is estimated to have the second-highest share in the market owing to the convenience it provides by generating electronic tickets instead of conventional ticketing systems.
- Depending upon the Application, public transport is expected to dominate the Smart Transportation Market. The growing awareness about global warming among individuals and the inconvenience caused due to a large number of private vehicles is encouraging consumers to use public transport. Moreover, to provide efficient service in public transport many governments have invested in the development of public transport thus promoting the growth of this segment.
Regional Analysis of Smart Transportation Market:
- Europe region is anticipated to dominate the Smart Transportation Market in the period of forecast owing to the growing number of deployments of smart transportation systems. Moreover, the governments and private sector in this region are turning to information and communication technologies to resolve transportation issues. Greece and United Kingdom are the major countries in this region promoting the growth of the smart transportation market in this region. Furthermore, under the current EU funding scheme, the governments have announced to invest US$17.5 billion in railway infrastructure and US$36.6 billion for the development of road infrastructure for smart transportation.
- Followed by Europe, the North American region is expected to dominate the Smart Transportation Market in the period of forecast. With the growing adoption of innovative technologies and to make transportation systems reliable, safe, and comfortable countries such as the United States and Canada are investing to develop road, railway, and airway infrastructure.
- Asia-Pacific is expected to have the highest growth rate owing to robust growing economies like Japan, China, India, Singapore, and Australia. The technology advancements in Japan and ease at which smart transportation is accommodated is promoting Smart Transportation Market growth. China is the world's second-largest economy and the most populated country is investing in smart transportation to resolve the countries congestion problem hence all these factors are promoting the growth of the Smart Transportation Market in this region.
Players Covered in Smart Transportation Market are:
- Thales Group (France)
- Huawei Technologies Co. Ltd. (China)
- Siemens AG (Germany)
- IBM Corporation (US)
- Cisco Systems Inc. (US)
- SAP (Germany)
- Cubic Corporation (US)
- Alstom (France)
- Bombardier Inc. (Canada)
- Toshiba (Japan)
- Harris Corporation (US)
- Saab AB (Sweden)
- Veson Nautical (Massachusetts)
- BASS Software (Norway)
- Bentley Systems (US)
- Indra Sistemas (Spain)
- Trimble (US)
- TomTom International BV. (Netherlands)
- Amadeus IT Group SA (Spain)
- Conduent (US)
- Kapsch (Austria)
- Hitachi Ltd. (Japan)
- Descartes (Canada)
- Accenture (Ireland)
- DNV GL (Norway) and other major players
Key Industry Development in Smart Transportation Market
- In April 2024, The General Directorate of Highways unveiled ambitious plans to improve Turkey's transportation infrastructure by introducing smart technology initiatives aimed at optimizing routes and increasing efficiency. Referring to the institution's strategic plans for the coming years, the General Directorate highlighted the goals of these projects, including reducing travel time, improving road safety, and efficiently utilizing energy and existing road capacity.
- In May 2023, Cisco signed an MOU with the National Transport Commission (NTC) to accelerate the development of digital rail skills across Australia and improve rail interoperability. Cisco will collaborate with NTC to bridge the digital skills gap and to support the development of the digital workforce to improve rail interoperability as part of the NTC’s National Rail Action Plan. The proposed collaboration aims to identify and accelerate the development of baseline digital rail skills relevant to passenger and freight networks.
|
Global Smart Transportation Market |
|||
|
Base Year: |
2021 |
Forecast Period: |
2022-2028 |
|
Historical Data : |
2016 to 2020 |
Market Size in 2021: |
USD 95.84 Bn. |
|
Forecast Period 2022-28 CAGR: |
14.09% |
Market Size in 2028: |
USD 241.15 Bn. |
|
Segments Covered: |
By Type |
|
|
|
By Technology Used |
|
||
|
By Solutions |
|
||
|
By Application |
|
||
|
By Region |
|
||
|
Key Market Drivers: |
|
||
|
Key Market Restraints: |
|
||
|
Key Opportunities: |
|
||
|
Companies Covered in the report: |
Thales Group (France), Huawei Technologies Co., Ltd. (China), Siemens AG (Germany), IBM Corporation (US), Cisco Systems, Inc. (US), SAP (Germany), Cubic Corporation (US), Alstom (France), Bombardier Inc. (Canada), Toshiba (Japan) and other major players |
||
1.1 Scope and Coverage
Chapter 2:Executive Summary
Chapter 3: Market Landscape
3.1 Market Dynamics
3.1.1 Drivers
3.1.2 Restraints
3.1.3 Opportunities
3.1.4 Challenges
3.2 Market Trend Analysis
3.3 PESTLE Analysis
3.4 Porter's Five Forces Analysis
3.5 Industry Value Chain Analysis
3.6 Ecosystem
3.7 Regulatory Landscape
3.8 Price Trend Analysis
3.9 Patent Analysis
3.10 Technology Evolution
3.11 Investment Pockets
3.12 Import-Export Analysis
Chapter 4: Smart Transportation Market by Type (2018-2032)
4.1 Smart Transportation Market Snapshot and Growth Engine
4.2 Market Overview
4.3 Roadways
4.3.1 Introduction and Market Overview
4.3.2 Historic and Forecasted Market Size in Value USD and Volume Units
4.3.3 Key Market Trends, Growth Factors, and Opportunities
4.3.4 Geographic Segmentation Analysis
4.4 Railways
4.5 Airways
4.6 Maritime
Chapter 5: Smart Transportation Market by Technology Used (2018-2032)
5.1 Smart Transportation Market Snapshot and Growth Engine
5.2 Market Overview
5.3 Cloud Computing
5.3.1 Introduction and Market Overview
5.3.2 Historic and Forecasted Market Size in Value USD and Volume Units
5.3.3 Key Market Trends, Growth Factors, and Opportunities
5.3.4 Geographic Segmentation Analysis
5.4 Artificial Intelligence
5.5 Internet Of Things
Chapter 6: Smart Transportation Market by Solutions (2018-2032)
6.1 Smart Transportation Market Snapshot and Growth Engine
6.2 Market Overview
6.3 Ticket Management System
6.3.1 Introduction and Market Overview
6.3.2 Historic and Forecasted Market Size in Value USD and Volume Units
6.3.3 Key Market Trends, Growth Factors, and Opportunities
6.3.4 Geographic Segmentation Analysis
6.4 Parking Management And Guidance System
6.5 Traffic Management System
6.6 Freight Management
6.7 Road Safety And Security
6.8 Others
Chapter 7: Smart Transportation Market by Application (2018-2032)
7.1 Smart Transportation Market Snapshot and Growth Engine
7.2 Market Overview
7.3 Mobility as a Service
7.3.1 Introduction and Market Overview
7.3.2 Historic and Forecasted Market Size in Value USD and Volume Units
7.3.3 Key Market Trends, Growth Factors, and Opportunities
7.3.4 Geographic Segmentation Analysis
7.4 Route Information and Route Guidance
7.5 Public Transport
7.6 Transit Hubs
7.7 Connected Cars
7.8 Video Management
7.9 Others
Chapter 8: Company Profiles and Competitive Analysis
8.1 Competitive Landscape
8.1.1 Competitive Benchmarking
8.1.2 Smart Transportation Market Share by Manufacturer (2024)
8.1.3 Industry BCG Matrix
8.1.4 Heat Map Analysis
8.1.5 Mergers and Acquisitions
8.2 CARGILL INCORPORATED (US)
8.2.1 Company Overview
8.2.2 Key Executives
8.2.3 Company Snapshot
8.2.4 Role of the Company in the Market
8.2.5 Sustainability and Social Responsibility
8.2.6 Operating Business Segments
8.2.7 Product Portfolio
8.2.8 Business Performance
8.2.9 Key Strategic Moves and Recent Developments
8.2.10 SWOT Analysis
8.3 COTY OPERATIONS B.V. (US)
8.4 REVLON (US)
8.5 JOHNSON & JOHNSON CONSUMER INC (US)
8.6 AMWAY CORP. (US)
8.7 ACME COSMETIC COMPONENTS (US)
8.8 CHANTECAILLE BEAUTE INC (US)
8.9 UNILEVER (UK)
8.10 AVON (UK)
8.11 CIATÉ LONDON (UK)
8.12 CHARLOTTE TILBURY BEAUTY LTD. (UK)
8.13 L'ORÉAL PARIS (FRANCE)
8.14 COTY INC (FRANCE)
8.15 SHISEIDO CO. LTD (JAPAN)
8.16 E-RETAIL PVT LTD (INDIA)
8.17 PURPLLE (INDIA)
8.18 COLORBAR COSMETICS PVT LTD (INDIA)
8.19 LOTUS HERBALS PVT LTD (INDIA)
8.20
Chapter 9: Global Smart Transportation Market By Region
9.1 Overview
9.2. North America Smart Transportation Market
9.2.1 Key Market Trends, Growth Factors and Opportunities
9.2.2 Top Key Companies
9.2.3 Historic and Forecasted Market Size by Segments
9.2.4 Historic and Forecasted Market Size by Type
9.2.4.1 Roadways
9.2.4.2 Railways
9.2.4.3 Airways
9.2.4.4 Maritime
9.2.5 Historic and Forecasted Market Size by Technology Used
9.2.5.1 Cloud Computing
9.2.5.2 Artificial Intelligence
9.2.5.3 Internet Of Things
9.2.6 Historic and Forecasted Market Size by Solutions
9.2.6.1 Ticket Management System
9.2.6.2 Parking Management And Guidance System
9.2.6.3 Traffic Management System
9.2.6.4 Freight Management
9.2.6.5 Road Safety And Security
9.2.6.6 Others
9.2.7 Historic and Forecasted Market Size by Application
9.2.7.1 Mobility as a Service
9.2.7.2 Route Information and Route Guidance
9.2.7.3 Public Transport
9.2.7.4 Transit Hubs
9.2.7.5 Connected Cars
9.2.7.6 Video Management
9.2.7.7 Others
9.2.8 Historic and Forecast Market Size by Country
9.2.8.1 US
9.2.8.2 Canada
9.2.8.3 Mexico
9.3. Eastern Europe Smart Transportation Market
9.3.1 Key Market Trends, Growth Factors and Opportunities
9.3.2 Top Key Companies
9.3.3 Historic and Forecasted Market Size by Segments
9.3.4 Historic and Forecasted Market Size by Type
9.3.4.1 Roadways
9.3.4.2 Railways
9.3.4.3 Airways
9.3.4.4 Maritime
9.3.5 Historic and Forecasted Market Size by Technology Used
9.3.5.1 Cloud Computing
9.3.5.2 Artificial Intelligence
9.3.5.3 Internet Of Things
9.3.6 Historic and Forecasted Market Size by Solutions
9.3.6.1 Ticket Management System
9.3.6.2 Parking Management And Guidance System
9.3.6.3 Traffic Management System
9.3.6.4 Freight Management
9.3.6.5 Road Safety And Security
9.3.6.6 Others
9.3.7 Historic and Forecasted Market Size by Application
9.3.7.1 Mobility as a Service
9.3.7.2 Route Information and Route Guidance
9.3.7.3 Public Transport
9.3.7.4 Transit Hubs
9.3.7.5 Connected Cars
9.3.7.6 Video Management
9.3.7.7 Others
9.3.8 Historic and Forecast Market Size by Country
9.3.8.1 Russia
9.3.8.2 Bulgaria
9.3.8.3 The Czech Republic
9.3.8.4 Hungary
9.3.8.5 Poland
9.3.8.6 Romania
9.3.8.7 Rest of Eastern Europe
9.4. Western Europe Smart Transportation Market
9.4.1 Key Market Trends, Growth Factors and Opportunities
9.4.2 Top Key Companies
9.4.3 Historic and Forecasted Market Size by Segments
9.4.4 Historic and Forecasted Market Size by Type
9.4.4.1 Roadways
9.4.4.2 Railways
9.4.4.3 Airways
9.4.4.4 Maritime
9.4.5 Historic and Forecasted Market Size by Technology Used
9.4.5.1 Cloud Computing
9.4.5.2 Artificial Intelligence
9.4.5.3 Internet Of Things
9.4.6 Historic and Forecasted Market Size by Solutions
9.4.6.1 Ticket Management System
9.4.6.2 Parking Management And Guidance System
9.4.6.3 Traffic Management System
9.4.6.4 Freight Management
9.4.6.5 Road Safety And Security
9.4.6.6 Others
9.4.7 Historic and Forecasted Market Size by Application
9.4.7.1 Mobility as a Service
9.4.7.2 Route Information and Route Guidance
9.4.7.3 Public Transport
9.4.7.4 Transit Hubs
9.4.7.5 Connected Cars
9.4.7.6 Video Management
9.4.7.7 Others
9.4.8 Historic and Forecast Market Size by Country
9.4.8.1 Germany
9.4.8.2 UK
9.4.8.3 France
9.4.8.4 The Netherlands
9.4.8.5 Italy
9.4.8.6 Spain
9.4.8.7 Rest of Western Europe
9.5. Asia Pacific Smart Transportation Market
9.5.1 Key Market Trends, Growth Factors and Opportunities
9.5.2 Top Key Companies
9.5.3 Historic and Forecasted Market Size by Segments
9.5.4 Historic and Forecasted Market Size by Type
9.5.4.1 Roadways
9.5.4.2 Railways
9.5.4.3 Airways
9.5.4.4 Maritime
9.5.5 Historic and Forecasted Market Size by Technology Used
9.5.5.1 Cloud Computing
9.5.5.2 Artificial Intelligence
9.5.5.3 Internet Of Things
9.5.6 Historic and Forecasted Market Size by Solutions
9.5.6.1 Ticket Management System
9.5.6.2 Parking Management And Guidance System
9.5.6.3 Traffic Management System
9.5.6.4 Freight Management
9.5.6.5 Road Safety And Security
9.5.6.6 Others
9.5.7 Historic and Forecasted Market Size by Application
9.5.7.1 Mobility as a Service
9.5.7.2 Route Information and Route Guidance
9.5.7.3 Public Transport
9.5.7.4 Transit Hubs
9.5.7.5 Connected Cars
9.5.7.6 Video Management
9.5.7.7 Others
9.5.8 Historic and Forecast Market Size by Country
9.5.8.1 China
9.5.8.2 India
9.5.8.3 Japan
9.5.8.4 South Korea
9.5.8.5 Malaysia
9.5.8.6 Thailand
9.5.8.7 Vietnam
9.5.8.8 The Philippines
9.5.8.9 Australia
9.5.8.10 New Zealand
9.5.8.11 Rest of APAC
9.6. Middle East & Africa Smart Transportation Market
9.6.1 Key Market Trends, Growth Factors and Opportunities
9.6.2 Top Key Companies
9.6.3 Historic and Forecasted Market Size by Segments
9.6.4 Historic and Forecasted Market Size by Type
9.6.4.1 Roadways
9.6.4.2 Railways
9.6.4.3 Airways
9.6.4.4 Maritime
9.6.5 Historic and Forecasted Market Size by Technology Used
9.6.5.1 Cloud Computing
9.6.5.2 Artificial Intelligence
9.6.5.3 Internet Of Things
9.6.6 Historic and Forecasted Market Size by Solutions
9.6.6.1 Ticket Management System
9.6.6.2 Parking Management And Guidance System
9.6.6.3 Traffic Management System
9.6.6.4 Freight Management
9.6.6.5 Road Safety And Security
9.6.6.6 Others
9.6.7 Historic and Forecasted Market Size by Application
9.6.7.1 Mobility as a Service
9.6.7.2 Route Information and Route Guidance
9.6.7.3 Public Transport
9.6.7.4 Transit Hubs
9.6.7.5 Connected Cars
9.6.7.6 Video Management
9.6.7.7 Others
9.6.8 Historic and Forecast Market Size by Country
9.6.8.1 Turkiye
9.6.8.2 Bahrain
9.6.8.3 Kuwait
9.6.8.4 Saudi Arabia
9.6.8.5 Qatar
9.6.8.6 UAE
9.6.8.7 Israel
9.6.8.8 South Africa
9.7. South America Smart Transportation Market
9.7.1 Key Market Trends, Growth Factors and Opportunities
9.7.2 Top Key Companies
9.7.3 Historic and Forecasted Market Size by Segments
9.7.4 Historic and Forecasted Market Size by Type
9.7.4.1 Roadways
9.7.4.2 Railways
9.7.4.3 Airways
9.7.4.4 Maritime
9.7.5 Historic and Forecasted Market Size by Technology Used
9.7.5.1 Cloud Computing
9.7.5.2 Artificial Intelligence
9.7.5.3 Internet Of Things
9.7.6 Historic and Forecasted Market Size by Solutions
9.7.6.1 Ticket Management System
9.7.6.2 Parking Management And Guidance System
9.7.6.3 Traffic Management System
9.7.6.4 Freight Management
9.7.6.5 Road Safety And Security
9.7.6.6 Others
9.7.7 Historic and Forecasted Market Size by Application
9.7.7.1 Mobility as a Service
9.7.7.2 Route Information and Route Guidance
9.7.7.3 Public Transport
9.7.7.4 Transit Hubs
9.7.7.5 Connected Cars
9.7.7.6 Video Management
9.7.7.7 Others
9.7.8 Historic and Forecast Market Size by Country
9.7.8.1 Brazil
9.7.8.2 Argentina
9.7.8.3 Rest of SA
Chapter 10 Analyst Viewpoint and Conclusion
10.1 Recommendations and Concluding Analysis
10.2 Potential Market Strategies
Chapter 11 Research Methodology
11.1 Research Process
11.2 Primary Research
11.3 Secondary Research
|
Global Smart Transportation Market |
|||
|
Base Year: |
2021 |
Forecast Period: |
2022-2028 |
|
Historical Data : |
2016 to 2020 |
Market Size in 2021: |
USD 95.84 Bn. |
|
Forecast Period 2022-28 CAGR: |
14.09% |
Market Size in 2028: |
USD 241.15 Bn. |
|
Segments Covered: |
By Type |
|
|
|
By Technology Used |
|
||
|
By Solutions |
|
||
|
By Application |
|
||
|
By Region |
|
||
|
Key Market Drivers: |
|
||
|
Key Market Restraints: |
|
||
|
Key Opportunities: |
|
||
|
Companies Covered in the report: |
Thales Group (France), Huawei Technologies Co., Ltd. (China), Siemens AG (Germany), IBM Corporation (US), Cisco Systems, Inc. (US), SAP (Germany), Cubic Corporation (US), Alstom (France), Bombardier Inc. (Canada), Toshiba (Japan) and other major players |
||
Frequently Asked Questions :
The forecast period in the Smart Transportation Market research report is 2024-2032.
The key players mentioned are Thales Group (France), Huawei Technologies Co., Ltd. (China), Siemens AG (Germany), IBM Corporation (US), Cisco Systems, Inc. (US), SAP (Germany), Cubic Corporation (US), Alstom (France), Bombardier Inc. (Canada), Toshiba (Japan), Harris Corporation (US), Saab AB (Sweden), Veson Nautical (Massachusetts), BASS Software (Norway), Bentley Systems (US), Indra Sistemas (Spain), Trimble (US), TomTom International BV. (Netherlands), Amadeus IT Group SA (Spain), Conduent (US), Kapsch (Austria), Hitachi Ltd. (Japan), Descartes (Canada), Accenture (Ireland), and DNV GL (Norway).
The Smart Transportation market is segmented into Transportation Mode, Technology Used, Solutions and Region. By Application, the market is categorized into Mobility as a Service, Route Information and Route Guidance, Public Transport, Transit Hubs, Connected Cars, Video Management, Others. By Transportation Mode, it is classified into Roadways, Railways, Airways, and Maritime and others. By Solution, it is classified into Ticket Management System, Parking Management And Guidance System, Traffic Management System, Freight Management, Road Safety And Security, And Others. By region, it is analysed across North America (U.S.; Canada; Mexico), Europe (Germany; U.K.; France; Italy; Russia; Spain etc.), Asia-Pacific (China; India; Japan; Southeast Asia etc.), South America (Brazil; Argentina etc.), Middle East & Africa (Saudi Arabia; South Africa etc.).
Smart Transportation Systems uses a wide range of technologies such as traffic signal control systems, automatic number plate recognition, container management systems, or speed cameras such as security CCTV systems to evaluate, manage, and monitor transportation systems to improve efficiency and safety in transportation services.
Global Smart Transportation Market was estimated at USD 124.97 billion in 2023 and is anticipated to reach USD 412.53 billion by 2032, growing at a CAGR of 14.19% globally.


