


Robotics Advisory Service Market Synopsis
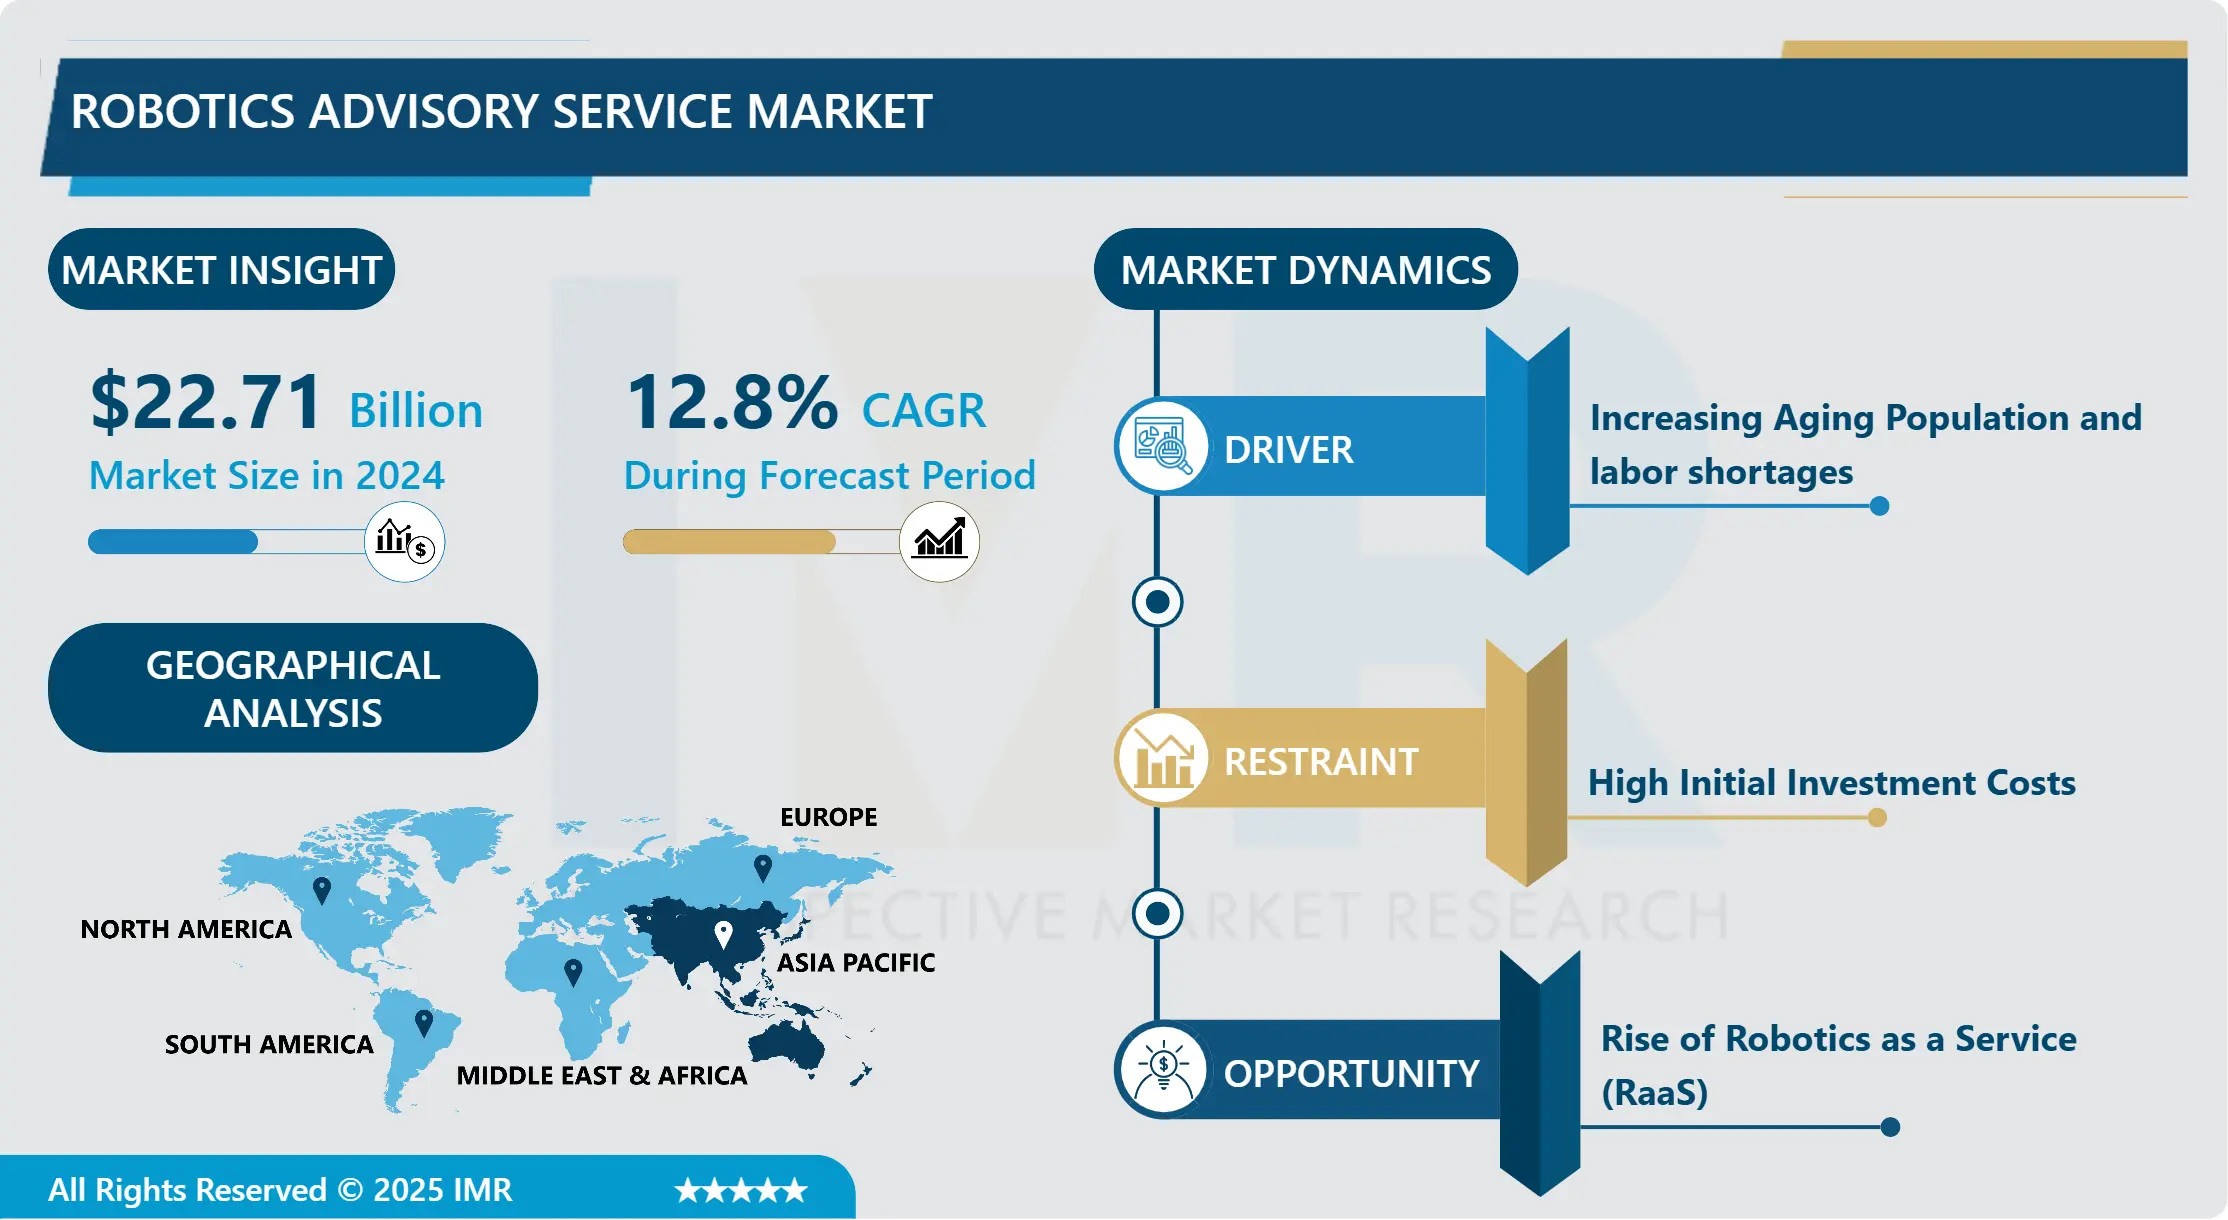
Global Robotics Advisory Service Market Size Was Valued At USD 22.71 Billion In 2024, And Is Projected To Reach USD 59.52 Billion By 2032, Growing At A CAGR Of 12.8 % From 2025-2032.
The Robotics Advisory Service furnishes expert assistance and guidance for navigating the intricacies of robotics technologies and applications. It delivers strategic insights, tailored recommendations, and pragmatic solutions to organizations aiming to implement or enhance robotic systems effectively.
The Robotics Advisory Service plays a crucial role in assisting organizations with the implementation and optimization of robotics technologies. It is applicable across diverse sectors such as manufacturing, healthcare, logistics, and agriculture, where robotics solutions offer opportunities for automation, efficiency improvement, and cost reduction. By leveraging the expertise of robotics advisors, organizations can effectively select, integrate, and deploy robotic systems tailored to their specific needs and operational requirements.
An inherent advantage of the Robotics Advisory Service lies in its capacity to offer tailored strategic insights and recommendations that address the unique objectives and challenges of each organization. Through comprehensive analysis and evaluation, robotics advisors identify avenues for process optimization, workflow automation, and performance enhancement, thereby driving increased operational efficiency and competitiveness. Furthermore, the pragmatic solutions provided by robotics advisors enable organizations to mitigate the risks associated with robotics implementation, facilitating smoother transitions and quicker returns on investment.
There is anticipated significant growth in the demand for Robotics Advisory Services as industries increasingly adopt robotics technologies to remain competitive in rapidly evolving markets. With advancements in robotics capabilities, such as artificial intelligence, machine learning, and collaborative robotics, organizations will seek expert guidance to effectively navigate the complexities of technology adoption. Additionally, as industries continue to digitize and automate their operations, there will be an escalating requirement for robotics advisors who can offer insights into emerging trends, best practices, and innovative applications of robotics across various sectors.

Robotics Advisory Service Market Trend Analysis:
Increasing Aging Population and labour shortages
- The Robotics Advisory Service Market is being propelled by the increasing ageing population and labour shortages. Global populations, particularly in developed nations, are ageing, leading to a rising demand for solutions to address the challenges associated with an older workforce. Labour shortages, exacerbated by demographic shifts and changing workforce dynamics, are further driving the need for automation and robotics solutions to bridge gaps in the labor market.
- Industries are turning to robotics technologies to augment human labor and offset workforce shortages in response to these challenges. Robotics Advisory Services are pivotal in guiding organizations through the implementation of tailored robotics solutions to meet specific operational needs. By leveraging the expertise of robotics advisors, companies can pinpoint opportunities for automation, efficiency enhancement, and cost reduction to tackle the obstacles posed by aging populations and labor shortages
- Anticipated growth in the Robotics Advisory Service Market is driven by industries seeking expert guidance to navigate the complexities of adopting robotics technologies across various sectors like manufacturing, healthcare, logistics, and agriculture. With an aging workforce and labor shortages on the rise, there's an increased demand for robotics advisors who can offer strategic insights, personalized recommendations, and practical solutions to seamlessly integrate robotics systems into organizational workflows and processes.
Rise of Robotics as a Service (RaaS)
- The rise of Robotics as a Service (RaaS) represents a significant opportunity for fueling the expansion of the Robotics Advisory Service Market. RaaS allows businesses to access robotics technologies on a subscription basis, eliminating the need for hefty upfront investments in hardware and infrastructure. This flexible model enables organizations to deploy robotics solutions as needed, tailored precisely to their unique operational requirements, thereby reducing barriers to entry and promoting broader adoption of robotics technologies across diverse industries.
- The ascent of RaaS creates fresh avenues for delivering expert guidance and assistance through Robotics Advisory Services. Robotics advisors play a pivotal role in aiding businesses in navigating the intricacies of RaaS adoption, from selecting suitable robotics providers to seamlessly integrating robotics systems into existing workflows. By providing strategic insights, personalized recommendations, and practical solutions, robotics advisory services empower organizations to maximize the benefits of RaaS while mitigating risks and ensuring successful outcomes.
- Furthermore, the proliferation of RaaS presents opportunities for robotics advisory firms to diversify their service portfolios and explore untapped markets. With more businesses embracing RaaS to meet their automation needs, there is a growing demand for robotics advisory services to facilitate the effective adoption and utilization of RaaS solutions. This trend is poised to propel growth in the Robotics Advisory Service Market as businesses increasingly recognize the importance of expert guidance in optimizing the potential of robotics technologies through RaaS models.
Robotics Advisory Service Market Segment Analysis:
Robotics Advisory Service Market Segmented on the basis of Service Type and Industry
By Service Type, Strategic Consulting segment is expected to dominate the market during the forecast period
- The Strategic Consulting segment is poised to emerge as the frontrunner in terms of growth. This segment specializes in delivering strategic direction and tailored advice to organizations aiming to effectively harness robotics technologies. Strategic consulting services are instrumental in aiding businesses in comprehending the potential implications of robotics on their operations, pinpointing avenues for automation and efficiency enhancement, and formulating comprehensive strategies for successful robotics integration.
- Strategic consulting services furnish invaluable insights and proficiency in navigating the intricacies of robotics adoption, thereby aiding organizations in making informed choices and devising definitive pathways for embedding robotics within their workflows. Additionally, strategic consultants offer bespoke solutions tailored to address the distinct objectives and hurdles of each organization, ensuring optimal results and ROI. As businesses increasingly acknowledge the significance of strategic counsel in maximizing the advantages of robotics technologies, the demand for strategic consulting services is poised to grow, propelling the expansion of the Robotics Advisory Service Market.
By Industry, Manufacturing segment held the largest share
- The Manufacturing segment leads in both market share and growth. This segment specializes in offering tailored advisory services to address the unique requirements and obstacles encountered by manufacturing enterprises looking to adopt robotics technologies. As the manufacturing sector progressively adopts automation to enhance productivity, quality, and efficiency, there is a rising demand for expert guidance to navigate the intricacies of robotics integration.
- Manufacturing firms heavily depend on robotics to streamline operations, refine processes, and maintain competitiveness in the global arena. Robotics advisory services are instrumental in aiding manufacturers in identifying automation opportunities, selecting suitable robotics solutions, and devising implementation strategies aligned with their production objectives. Moreover, as robotics technology advances, manufacturing entities seek ongoing support and insights to remain updated on emerging trends and maximize the advantages of robotics in their operations, driving sustained demand for advisory services within the Manufacturing segment of the Robotics Advisory Service Market.
Robotics Advisory Service Market Regional Insights:
Asia Pacific is Expected to Dominate the Market Over the Forecast period
- Asia Pacific is poised to lead in both growth and dominance. The region's burgeoning economies, rapid industrialization, and increasing adoption of automation technologies provide ample opportunities for the expansion of Robotics Advisory Services. countries such as China, Japan, and South Korea are spearheading robotics innovation and implementation, creating a high demand for expert guidance in navigating the complexities of integrating robotics across diverse industries.
- The region's manufacturing sector drives the adoption of robotics to enhance operational efficiency and competitiveness. Moreover, government initiatives and investments in robotics research and development further propel market growth. Additionally, the emergence of Southeast Asian economies presents fresh prospects for Robotics Advisory Services as industries in these regions seek to harness robotics technologies for growth and innovation. Asia Pacific is poised to maintain its leadership position in the global Robotics Advisory Service market in the foreseeable future.
Robotics Advisory Service Market Top Key Players:
- Amazon Robotics (U.S.)
- IBM (U.S.)
- Microsoft (U.S.)
- Hit Robot (U.S.)
- Deloitte (U.S.)
- Bain & Company (U.S.)
- Oliver Wyman (U.S.)
- AlixPartners (U.S.)
- Alvarez & Marsal (U.S.)
- Huron Consulting Group (U.S.)
- FTI Consulting (U.S.)
- Roland Berger (Germany)
- EY (UK)
- PwC (UK)
- L.E.K. Consulting (UK)
- Capgemini (France)
- Accenture (Ireland)
- KPMG (Netherlands)
- Rapyuta Robotics (Japan)
- Huawei Technologies Co., Ltd. (China)
- CloudMinds (China), and Other Active Players
Key Industry Developments in the Robotics Advisory Service Market:
- In August 2022, Amazon and iRobot agreed to a definitive merger agreement, with Amazon set to acquire iRobot in an all-cash transaction valued at approximately USD 1.7 billion.
- In September 2022, Canadian robotics company Avidbots raised $70 million in a Series C funding round, primarily focused on autonomous cleaning robots. They developed Neo 2, a robotic floor cleaner for commercial environments like warehouses and airports.
|
Robotics Advisory Service Market |
|||
|
Base Year: |
2024 |
Forecast Period: |
2025-2032 |
|
Historical Data: |
2018 to 2023 |
Market Size in 2024: |
USD 22.71 Bn. |
|
Forecast Period 2024-32 CAGR: |
12.8 % |
Market Size in 2032: |
USD 59.52 Bn. |
|
Segments Covered: |
By Service Type |
|
|
|
By Industry |
|
||
|
By Region |
|
||
|
Key Market Drivers: |
|
||
|
Key Market Restraints: |
|
||
|
Key Opportunities: |
|
||
|
Companies Covered in the report: |
|
||
Chapter 1: Introduction
1.1 Scope and Coverage
Chapter 2:Executive Summary
Chapter 3: Market Landscape
3.1 Market Dynamics
3.1.1 Drivers
3.1.2 Restraints
3.1.3 Opportunities
3.1.4 Challenges
3.2 Market Trend Analysis
3.3 PESTLE Analysis
3.4 Porter's Five Forces Analysis
3.5 Industry Value Chain Analysis
3.6 Ecosystem
3.7 Regulatory Landscape
3.8 Price Trend Analysis
3.9 Patent Analysis
3.10 Technology Evolution
3.11 Investment Pockets
3.12 Import-Export Analysis
Chapter 4: Robotics Advisory Service Market by Service Type (2018-2032)
4.1 Robotics Advisory Service Market Snapshot and Growth Engine
4.2 Market Overview
4.3 Strategic Consulting
4.3.1 Introduction and Market Overview
4.3.2 Historic and Forecasted Market Size in Value USD and Volume Units
4.3.3 Key Market Trends, Growth Factors, and Opportunities
4.3.4 Geographic Segmentation Analysis
4.4 Technical Consulting
4.5 Financial Consulting
4.6 Operational Consulting
Chapter 5: Robotics Advisory Service Market by Industry (2018-2032)
5.1 Robotics Advisory Service Market Snapshot and Growth Engine
5.2 Market Overview
5.3 Manufacturing
5.3.1 Introduction and Market Overview
5.3.2 Historic and Forecasted Market Size in Value USD and Volume Units
5.3.3 Key Market Trends, Growth Factors, and Opportunities
5.3.4 Geographic Segmentation Analysis
5.4 Healthcare
5.5 Logistics
5.6 Warehousing
5.7 Retail
5.8 Agriculture
Chapter 6: Company Profiles and Competitive Analysis
6.1 Competitive Landscape
6.1.1 Competitive Benchmarking
6.1.2 Robotics Advisory Service Market Share by Manufacturer (2024)
6.1.3 Industry BCG Matrix
6.1.4 Heat Map Analysis
6.1.5 Mergers and Acquisitions
6.2 CERNER CORPORATION (UNITED STATES)
6.2.1 Company Overview
6.2.2 Key Executives
6.2.3 Company Snapshot
6.2.4 Role of the Company in the Market
6.2.5 Sustainability and Social Responsibility
6.2.6 Operating Business Segments
6.2.7 Product Portfolio
6.2.8 Business Performance
6.2.9 Key Strategic Moves and Recent Developments
6.2.10 SWOT Analysis
6.3 ALLSCRIPTS HEALTHCARE SOLUTIONS INC. (UNITED STATES)
6.4 EPIC SYSTEMS CORPORATION (UNITED STATES)
6.5 NEXTGEN HEALTHCARE INC. (UNITED STATES)
6.6 MCKESSON CORPORATION (UNITED STATES)
6.7 MEDITECH (UNITED STATES)
6.8 GE HEALTHCARE (UNITED STATES)
6.9 SIEMENS HEALTHINEERS (GERMANY)
6.10 SURGICAL INFORMATION SYSTEMS (UNITED STATES)
6.11 AMKAISOLUTIONS (UNITED STATES)
6.12 ADVANTECH COLTD. (TAIWAN)
6.13 HSTPATHWAYS (UNITED STATES)
6.14 PROGNOCIS BY BIZMATICS (UNITED STATES)
6.15 MEDICAL INFORMATION TECHNOLOGY INC. (MEDITECH) (UNITED STATES)
6.16 QGENDA (UNITED STATES)
6.17 AMKAIOFFICE (UNITED STATES)
6.18 SIMPLIFY ASC (UNITED STATES)
6.19 SURGICAL INFORMATION SYSTEMS (UNITED STATES)
6.20 KAREO (UNITED STATES)
6.21 ECLINICALWORKS (UNITED STATES)
6.22 OTHER KEY PLAYERS
6.23
Chapter 7: Global Robotics Advisory Service Market By Region
7.1 Overview
7.2. North America Robotics Advisory Service Market
7.2.1 Key Market Trends, Growth Factors and Opportunities
7.2.2 Top Key Companies
7.2.3 Historic and Forecasted Market Size by Segments
7.2.4 Historic and Forecasted Market Size by Service Type
7.2.4.1 Strategic Consulting
7.2.4.2 Technical Consulting
7.2.4.3 Financial Consulting
7.2.4.4 Operational Consulting
7.2.5 Historic and Forecasted Market Size by Industry
7.2.5.1 Manufacturing
7.2.5.2 Healthcare
7.2.5.3 Logistics
7.2.5.4 Warehousing
7.2.5.5 Retail
7.2.5.6 Agriculture
7.2.6 Historic and Forecast Market Size by Country
7.2.6.1 US
7.2.6.2 Canada
7.2.6.3 Mexico
7.3. Eastern Europe Robotics Advisory Service Market
7.3.1 Key Market Trends, Growth Factors and Opportunities
7.3.2 Top Key Companies
7.3.3 Historic and Forecasted Market Size by Segments
7.3.4 Historic and Forecasted Market Size by Service Type
7.3.4.1 Strategic Consulting
7.3.4.2 Technical Consulting
7.3.4.3 Financial Consulting
7.3.4.4 Operational Consulting
7.3.5 Historic and Forecasted Market Size by Industry
7.3.5.1 Manufacturing
7.3.5.2 Healthcare
7.3.5.3 Logistics
7.3.5.4 Warehousing
7.3.5.5 Retail
7.3.5.6 Agriculture
7.3.6 Historic and Forecast Market Size by Country
7.3.6.1 Russia
7.3.6.2 Bulgaria
7.3.6.3 The Czech Republic
7.3.6.4 Hungary
7.3.6.5 Poland
7.3.6.6 Romania
7.3.6.7 Rest of Eastern Europe
7.4. Western Europe Robotics Advisory Service Market
7.4.1 Key Market Trends, Growth Factors and Opportunities
7.4.2 Top Key Companies
7.4.3 Historic and Forecasted Market Size by Segments
7.4.4 Historic and Forecasted Market Size by Service Type
7.4.4.1 Strategic Consulting
7.4.4.2 Technical Consulting
7.4.4.3 Financial Consulting
7.4.4.4 Operational Consulting
7.4.5 Historic and Forecasted Market Size by Industry
7.4.5.1 Manufacturing
7.4.5.2 Healthcare
7.4.5.3 Logistics
7.4.5.4 Warehousing
7.4.5.5 Retail
7.4.5.6 Agriculture
7.4.6 Historic and Forecast Market Size by Country
7.4.6.1 Germany
7.4.6.2 UK
7.4.6.3 France
7.4.6.4 The Netherlands
7.4.6.5 Italy
7.4.6.6 Spain
7.4.6.7 Rest of Western Europe
7.5. Asia Pacific Robotics Advisory Service Market
7.5.1 Key Market Trends, Growth Factors and Opportunities
7.5.2 Top Key Companies
7.5.3 Historic and Forecasted Market Size by Segments
7.5.4 Historic and Forecasted Market Size by Service Type
7.5.4.1 Strategic Consulting
7.5.4.2 Technical Consulting
7.5.4.3 Financial Consulting
7.5.4.4 Operational Consulting
7.5.5 Historic and Forecasted Market Size by Industry
7.5.5.1 Manufacturing
7.5.5.2 Healthcare
7.5.5.3 Logistics
7.5.5.4 Warehousing
7.5.5.5 Retail
7.5.5.6 Agriculture
7.5.6 Historic and Forecast Market Size by Country
7.5.6.1 China
7.5.6.2 India
7.5.6.3 Japan
7.5.6.4 South Korea
7.5.6.5 Malaysia
7.5.6.6 Thailand
7.5.6.7 Vietnam
7.5.6.8 The Philippines
7.5.6.9 Australia
7.5.6.10 New Zealand
7.5.6.11 Rest of APAC
7.6. Middle East & Africa Robotics Advisory Service Market
7.6.1 Key Market Trends, Growth Factors and Opportunities
7.6.2 Top Key Companies
7.6.3 Historic and Forecasted Market Size by Segments
7.6.4 Historic and Forecasted Market Size by Service Type
7.6.4.1 Strategic Consulting
7.6.4.2 Technical Consulting
7.6.4.3 Financial Consulting
7.6.4.4 Operational Consulting
7.6.5 Historic and Forecasted Market Size by Industry
7.6.5.1 Manufacturing
7.6.5.2 Healthcare
7.6.5.3 Logistics
7.6.5.4 Warehousing
7.6.5.5 Retail
7.6.5.6 Agriculture
7.6.6 Historic and Forecast Market Size by Country
7.6.6.1 Turkiye
7.6.6.2 Bahrain
7.6.6.3 Kuwait
7.6.6.4 Saudi Arabia
7.6.6.5 Qatar
7.6.6.6 UAE
7.6.6.7 Israel
7.6.6.8 South Africa
7.7. South America Robotics Advisory Service Market
7.7.1 Key Market Trends, Growth Factors and Opportunities
7.7.2 Top Key Companies
7.7.3 Historic and Forecasted Market Size by Segments
7.7.4 Historic and Forecasted Market Size by Service Type
7.7.4.1 Strategic Consulting
7.7.4.2 Technical Consulting
7.7.4.3 Financial Consulting
7.7.4.4 Operational Consulting
7.7.5 Historic and Forecasted Market Size by Industry
7.7.5.1 Manufacturing
7.7.5.2 Healthcare
7.7.5.3 Logistics
7.7.5.4 Warehousing
7.7.5.5 Retail
7.7.5.6 Agriculture
7.7.6 Historic and Forecast Market Size by Country
7.7.6.1 Brazil
7.7.6.2 Argentina
7.7.6.3 Rest of SA
Chapter 8 Analyst Viewpoint and Conclusion
8.1 Recommendations and Concluding Analysis
8.2 Potential Market Strategies
Chapter 9 Research Methodology
9.1 Research Process
9.2 Primary Research
9.3 Secondary Research
|
Robotics Advisory Service Market |
|||
|
Base Year: |
2024 |
Forecast Period: |
2025-2032 |
|
Historical Data: |
2018 to 2023 |
Market Size in 2024: |
USD 22.71 Bn. |
|
Forecast Period 2024-32 CAGR: |
12.8 % |
Market Size in 2032: |
USD 59.52 Bn. |
|
Segments Covered: |
By Service Type |
|
|
|
By Industry |
|
||
|
By Region |
|
||
|
Key Market Drivers: |
|
||
|
Key Market Restraints: |
|
||
|
Key Opportunities: |
|
||
|
Companies Covered in the report: |
|
||


