


Raman Spectroscopy Market Synopsis:
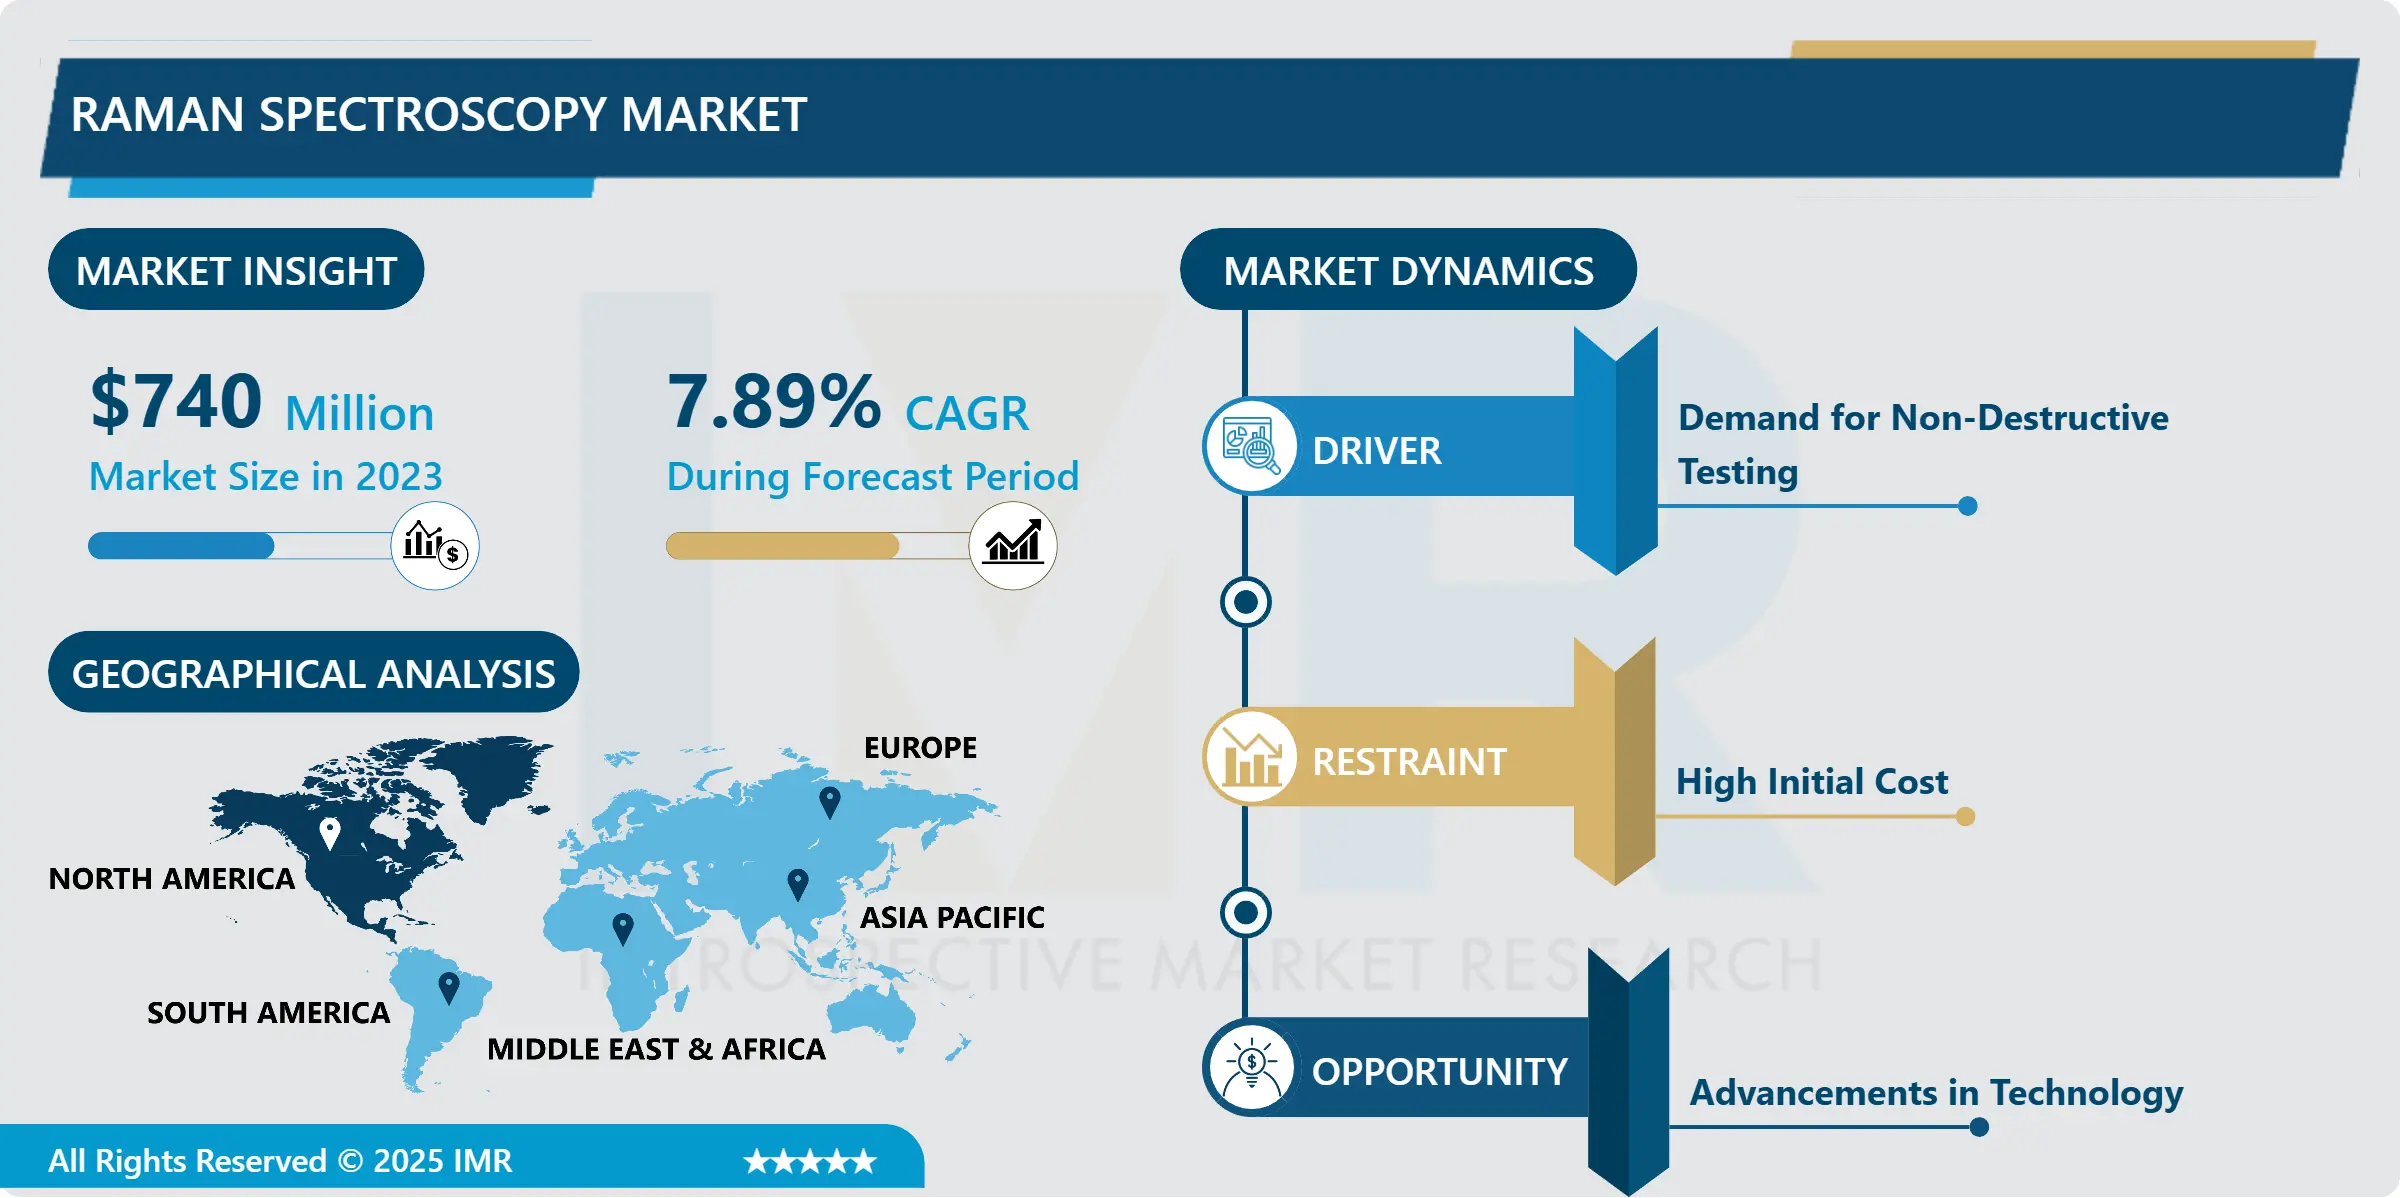
Raman Spectroscopy Market Size Was Valued at USD 740 Million in 2023, and is Projected to Reach USD 1,465.76 Million by 2032, Growing at a CAGR of 7.89% From 2024-2032.
Raman spectroscopy is a non-contact and non-invasive analytical tool used to analyze vibrational changes happening at molecular level in order to convey specific information concerning to molecular structures and chemical makeup of the substance under evaluation. Its function is based on illumination of a monochromatic light source, usually laser, and measuring the change in the frequency of the emitted light wave with the sample. The variation in the frequency is called Raman shift which is specific to the vibrative frequency of molecules in the investigated sample. It is used in chemistry, material studies, life sciences, and in pharmacy for the molecular analysis, substance identification and to characterize changes in a complex matrix.
The market for Raman Spectroscopy is rapidly growing and is being used widely by the industries including pharmaceuticals, biotechnology, chemicals, and material science. This testing technology efficiently strengthens the element of quality control and acts as a fast molecular analyzer generally used for identifying and characterizing a specimen non-destructively to quantify or qualify it for use in a number of scientific industries or research and development sectors. The enablement of the market can be regarded as other such as portable Raman spectrometers due to flexibility and portability in various situations. The current trend of approved high standard drugs and the requirement for appropriate quality assurance are some of the drivers of the market. In addition, safety and environmental consciousness is contributing to the increased employment of Raman spectroscopy for overseeing and evaluating risky materials particularly in chemical markets. Similarly, development of new research and development activities along with enhancement in the pharmaceutical and biotechnology sector in the emerging nations will help in augmented growth of the market in the near future.
The Raman Spectroscopy market is driven by growth of key players offering various products and solution to the consumer. The following companies are geared toward new solutions and partnerships to cover a wider market and improve their offerings. Joint ventures, amalgamation, and acquisitions belong to the most effective and frequently used sources of supporting the agreement of positions and meeting the growing demand. Also, the players are getting engaged in consolidating the geographical network, especially in the developing territory, to grasp the further growth prospects. The following are some of the problems faced by the market: High initial setup costs, and technical issues are inhibiting the advanced Raman spectroscopy systems. But slowly with the evolution in technologies these challenges are being dealt with more effectiveness and efficiency and hence proving to be more effective with the lower costs which are expected to propel the growth in this market further. The market is expected to expand and provide major opportunities to the key participants involved in the market because the Raman spectroscopy finds application across those industries which increasingly look for higher precision and improved efficiency in their operational processes.
Raman Spectroscopy Market Trend Analysis:
Raman Spectroscopy Market Growth and Innovations
- The capacity for non-destructive, real-time chemical analysis across a multitude of industries such as pharmaceuticals and biotechnology, material sciences and the environment have increased the use of the technology. It is because of this versatility that Raman spectroscopy meets many of the requirements that industry has for it, including the ability to conduct non-destructive and fast analysis. Recent advancements in Raman spectroscopy enabled portable and handheld devices, which narrowed the technology application gap for field analyses. This is especially useful for field that require instant result like food Inspection and Forensic analysis. Other additional features such as artificial intelligence and even machines learning integrated with Raman spectroscopy systems take data analysis to another level as it delivers more efficient outcomes. They enable extension of the market as well as expand the potential uses and increased growth in other industries.
- The making quality and regulatory concerns the global Raman spectroscopy market has received considerable impetus due to the need for better quality assurance across industries. For example in the pharmaceutical industry it is used highly in drug quality testing, impurity identification, and assurance of the drugs in conformance to regulatory requirements. The ascending interest in environmental protection, coupled with continuing concerns about the purity of the air, water, and soil, is also stimulating market growth with the aid of Raman spectroscopy to detect specific types of pollution. Thus, as appreciation for these advantages increases, so does the Raman Spectroscopy market, with new developments potentially extending its use even more.
Market Advancements in Raman Spectroscopy
- The major factor that fuels the growth of the Raman Spectroscopy market is the growing installations of the technology across the Pharmaceutical and Chemicals and Materials Science industries. Due to non destructive and high accuracy chemical analysis it is very useful in quality control, process control, research and development. Applicably, in pharmaceuticals, Raman analysis is employed in determining the purity of the drug, shelf-life as well as variations which are vital in compliance to required standards in the market as well as health standards. In chemicals and material science it is very useful to determine the composition of the material as well as to provide assessments of quality. The increasing demand of Raman spectroscopy in the biotechnology applications, primarily the drug discovery and identification of biomolecules is considered as the new growth factors. It helps in the McIntosh that defines specific properties of biological substances, and lets experts select new therapeutic goals, as well as work on efficient remedies. This capability is fast becoming important as the research in the area of personalized medicine goes on.
- Raman spectroscopy equipment continues to improve including the creation of portable and handheld Raman systems which would allow for increased bridging of the gap between the laboratory and field uses. Challenges had to be met in this way and these developments can facilitate on-site testing, which in certain situations is invaluable given that laboratory results cannot always be obtained. The portable Raman spectrometers can offer the results within minutes of being used therefore can be used in real-time applications including agriculture and environmental monitoring. This is set to propel the take of Raman spectroscopy in addition to appealing as a cheap solution for companies interested in extending quick analysis to their processes.
Raman Spectroscopy Market Segment Analysis:
Raman Spectroscopy Market is Segmented on the basis of By Type, Applications, Sampling Technique, Instruments, and Region.
By Type, Bench Top Type segment is expected to dominate the market during the forecast period
- Bench Top Raman spectrometers are developed for being used in particular structural laboratory environments, offering great efficiency and discriminative power. These systems are associated with elaborate optical and electronic parts that guarantee precise assessments and measurements. The high sensitivity and reproducibility make them suitable for precise analysis in industries such as pharmaceutical, material science and semiconductor.
- In pharmaceutics, these instruments serve in quality control and formulation research where identification and quantitative characterization of chemical compounds are vital. In material sciences, they help in determination of the mechanical behaviour of materials like polymers, metals and ceramics to name but a few of essential application in materials development and production. In semiconductor industries, bench top Raman spectrometers are widely used in the determination of properties of the semiconductor wafers along with the semiconductor devices before they were fabricated into electronic parts.
By Instruments, Probe-based Raman segment expected to held the largest share
- Since the probe delivers the laser light directly to the sample, probe-based Raman systems are highly suited for in-situ investigations. These systems include a probe that can be placed directly onto on the sample surface, allowing testing of the sample’s chemical and structural composition right away. About direct contact, the necessary information is received and collected so that it represents the actual situation of the sample accurately. This makes probe based Raman systems to support real time monitoring in for example quality control in production as well as environmental and medical monitoring. In pharmaceutics they are used to conduct on-site tests such drug formulation and stability, so that any changes in production to improve product quality can be made in real time. In material sciences, they afford useful information on one or the other property of the material like stress distribution in composites and soundness of coatings which
- Probe based Raman systems are also invaluable in life sciences where they are applied to the analysis of cells and tissues. It can mimic specialties, such as structural biology or immunology, in that the field has the power to discover relevant information about the cells and diseases directly from the samples without causing sizeable invasions of tissue samples. For instance, it can be applied on the changes of cellular metabolism, identification of the disease markers and the influence of drugs in real time. This capability is very useful in diagnostics where a quick positive result followed by intervention is essential to treatment planning. Due to their high speed technique and non-destructive nature, probe-based Raman systems are considered mandatory tools in the contemporary biomedical and clinical science.
Raman Spectroscopy Market Regional Insights:
North America is Expected to Dominate the Market Over the Forecast period
- On the same note, the Raman Spectroscopy market of North America is also boosted by increasing number of large vendors and strong market demand for analytical instruments in pharmaceutical and biotechnology industries as well the environmental testing activities. Leading countries widespread with applications of Raman spectroscopy are the United States and Canada, where research institutions and regulatory agencies increasingly apply it for quality control of products and material identification.
- This has been driven by demand for more efficient analysis in drug development, chemical testing, and monitoring, sustained by increased research expenditure in these geographies. In addition, major concern of industries for quality and safety/accreditation in current manufacturing processes also boost the need for using Raman spectroscopy technology.
Active Key Players in the Raman Spectroscopy Market:
- Horiba Scientific (Japan/France)
- Bruker Corporation (U.S.)
- Thermo Fisher Scientific (U.S.)
- Renishaw plc (United Kingdom)
- Agilent Technologies (U.S.)
- PerkinElmer, Inc. (U.S.)
- Shimadzu Corporation (Japan)
- JASCO Corporation (Japan)
- B&W Tek (U.S.)
- Kaiser Optical Systems (U.S.)
- Metrohm AG (Switzerland)
- WITec GmbH (Germany)
- Snowy Range Instruments (U.S.)
- BaySpec, Inc. (U.S.)
- Ocean Insight (U.S.), and Other Active Players
Key Industry Developments in the Raman Spectroscopy Market
- In October 2023, HORIBA Scientific acquired Process Instruments Inc., a prominent manufacturer of Raman spectroscopy technology. This acquisition strengthens HORIBA’s portfolio in analytical instrumentation, enhancing its capability in Raman spectroscopy solutions. Process Instruments’ expertise will enable HORIBA to expand its offerings and serve industries such as pharmaceuticals, chemical analysis, and materials science with advanced Raman technologies
- In February 2023, Agilent Technologies Inc. launched a significant software upgrade for its Vaya handheld Raman spectrometer. This upgrade enhances raw material identification by expanding the device's capabilities, allowing it to analyze both opaque and transparent containers. This development improves the efficiency and accuracy of quality control processes in various industries, particularly for pharmaceutical and biopharmaceutical applications
|
Global Raman Spectroscopy Market |
|||
|
Base Year: |
2023 |
Forecast Period: |
2024-2032 |
|
Historical Data: |
2017 to 2023 |
Market Size in 2023: |
USD 740 Million |
|
Forecast Period 2024-32 CAGR: |
7.89% |
Market Size in 2032: |
USD 1,465.76 Million |
|
|
By Type |
|
|
|
By Applications |
|
||
|
By Sampling Technique |
|
||
|
By Instruments |
|
||
|
By Region |
|
||
|
Key Market Drivers: |
|
||
|
Key Market Restraints: |
|
||
|
Key Opportunities: |
|
||
|
Companies Covered in the report: |
|
||
Chapter 1: Introduction
1.1 Scope and Coverage
Chapter 2:Executive Summary
Chapter 3: Market Landscape
3.1 Market Dynamics
3.1.1 Drivers
3.1.2 Restraints
3.1.3 Opportunities
3.1.4 Challenges
3.2 Market Trend Analysis
3.3 PESTLE Analysis
3.4 Porter's Five Forces Analysis
3.5 Industry Value Chain Analysis
3.6 Ecosystem
3.7 Regulatory Landscape
3.8 Price Trend Analysis
3.9 Patent Analysis
3.10 Technology Evolution
3.11 Investment Pockets
3.12 Import-Export Analysis
Chapter 4: Raman Spectroscopy Market by Indication
4.1 Raman Spectroscopy Market Snapshot and Growth Engine
4.2 Raman Spectroscopy Market Overview
4.3 (Intestinal & Stomach Ulcers
4.3.1 Introduction and Market Overview
4.3.2 Historic and Forecasted Market Size in Value USD and Volume Units (2017-2032F)
4.3.3 Key Market Trends, Growth Factors and Opportunities
4.3.4 (Intestinal & Stomach Ulcers: Geographic Segmentation Analysis
4.4 Gastroesophageal Reflux
4.4.1 Introduction and Market Overview
4.4.2 Historic and Forecasted Market Size in Value USD and Volume Units (2017-2032F)
4.4.3 Key Market Trends, Growth Factors and Opportunities
4.4.4 Gastroesophageal Reflux : Geographic Segmentation Analysis
Chapter 5: Raman Spectroscopy Market by Disease
5.1 Raman Spectroscopy Market Snapshot and Growth Engine
5.2 Raman Spectroscopy Market Overview
5.3 GERD
5.3.1 Introduction and Market Overview
5.3.2 Historic and Forecasted Market Size in Value USD and Volume Units (2017-2032F)
5.3.3 Key Market Trends, Growth Factors and Opportunities
5.3.4 GERD: Geographic Segmentation Analysis
5.4 Esophagitis
5.4.1 Introduction and Market Overview
5.4.2 Historic and Forecasted Market Size in Value USD and Volume Units (2017-2032F)
5.4.3 Key Market Trends, Growth Factors and Opportunities
5.4.4 Esophagitis: Geographic Segmentation Analysis
5.5 Zollinger-Ellison Syndrome
5.5.1 Introduction and Market Overview
5.5.2 Historic and Forecasted Market Size in Value USD and Volume Units (2017-2032F)
5.5.3 Key Market Trends, Growth Factors and Opportunities
5.5.4 Zollinger-Ellison Syndrome: Geographic Segmentation Analysis
5.6 and Others
5.6.1 Introduction and Market Overview
5.6.2 Historic and Forecasted Market Size in Value USD and Volume Units (2017-2032F)
5.6.3 Key Market Trends, Growth Factors and Opportunities
5.6.4 and Others: Geographic Segmentation Analysis
Chapter 6: Raman Spectroscopy Market by Population Type
6.1 Raman Spectroscopy Market Snapshot and Growth Engine
6.2 Raman Spectroscopy Market Overview
6.3 (Children and Adults
6.3.1 Introduction and Market Overview
6.3.2 Historic and Forecasted Market Size in Value USD and Volume Units (2017-2032F)
6.3.3 Key Market Trends, Growth Factors and Opportunities
6.3.4 (Children and Adults: Geographic Segmentation Analysis
Chapter 7: Raman Spectroscopy Market by Dosage Form
7.1 Raman Spectroscopy Market Snapshot and Growth Engine
7.2 Raman Spectroscopy Market Overview
7.3 (Solid Oral
7.3.1 Introduction and Market Overview
7.3.2 Historic and Forecasted Market Size in Value USD and Volume Units (2017-2032F)
7.3.3 Key Market Trends, Growth Factors and Opportunities
7.3.4 (Solid Oral: Geographic Segmentation Analysis
7.4 Liquid
7.4.1 Introduction and Market Overview
7.4.2 Historic and Forecasted Market Size in Value USD and Volume Units (2017-2032F)
7.4.3 Key Market Trends, Growth Factors and Opportunities
7.4.4 Liquid: Geographic Segmentation Analysis
7.5 and Parenteral
7.5.1 Introduction and Market Overview
7.5.2 Historic and Forecasted Market Size in Value USD and Volume Units (2017-2032F)
7.5.3 Key Market Trends, Growth Factors and Opportunities
7.5.4 and Parenteral: Geographic Segmentation Analysis
Chapter 8: Company Profiles and Competitive Analysis
8.1 Competitive Landscape
8.1.1 Competitive Benchmarking
8.1.2 Raman Spectroscopy Market Share by Manufacturer (2023)
8.1.3 Industry BCG Matrix
8.1.4 Heat Map Analysis
8.1.5 Mergers and Acquisitions
8.2 HORIBA SCIENTIFIC (JAPAN/FRANCE)
8.2.1 Company Overview
8.2.2 Key Executives
8.2.3 Company Snapshot
8.2.4 Role of the Company in the Market
8.2.5 Sustainability and Social Responsibility
8.2.6 Operating Business Segments
8.2.7 Product Portfolio
8.2.8 Business Performance
8.2.9 Key Strategic Moves and Recent Developments
8.2.10 SWOT Analysis
8.3 BRUKER CORPORATION (U.S.)
8.4 THERMO FISHER SCIENTIFIC (U.S.)
8.5 RENISHAW PLC (UNITED KINGDOM)
8.6 AGILENT TECHNOLOGIES (U.S.)
8.7 PERKINELMER INC. (U.S.)
8.8 SHIMADZU CORPORATION (JAPAN)
8.9 JASCO CORPORATION (JAPAN)
8.10 B&W TEK (U.S.)
8.11 KAISER OPTICAL SYSTEMS (U.S.)
8.12 METROHM AG (SWITZERLAND)
8.13 WITEC GMBH (GERMANY)
8.14 SNOWY RANGE INSTRUMENTS (U.S.)
8.15 BAYSPEC INC. (U.S.)
8.16 OCEAN INSIGHT (U.S.)
8.17 OTHER ACTIVE PLAYERS
Chapter 9: Global Raman Spectroscopy Market By Region
9.1 Overview
9.2. North America Raman Spectroscopy Market
9.2.1 Key Market Trends, Growth Factors and Opportunities
9.2.2 Top Key Companies
9.2.3 Historic and Forecasted Market Size by Segments
9.2.4 Historic and Forecasted Market Size By Indication
9.2.4.1 (Intestinal & Stomach Ulcers
9.2.4.2 Gastroesophageal Reflux
9.2.5 Historic and Forecasted Market Size By Disease
9.2.5.1 GERD
9.2.5.2 Esophagitis
9.2.5.3 Zollinger-Ellison Syndrome
9.2.5.4 and Others
9.2.6 Historic and Forecasted Market Size By Population Type
9.2.6.1 (Children and Adults
9.2.7 Historic and Forecasted Market Size By Dosage Form
9.2.7.1 (Solid Oral
9.2.7.2 Liquid
9.2.7.3 and Parenteral
9.2.8 Historic and Forecast Market Size by Country
9.2.8.1 US
9.2.8.2 Canada
9.2.8.3 Mexico
9.3. Eastern Europe Raman Spectroscopy Market
9.3.1 Key Market Trends, Growth Factors and Opportunities
9.3.2 Top Key Companies
9.3.3 Historic and Forecasted Market Size by Segments
9.3.4 Historic and Forecasted Market Size By Indication
9.3.4.1 (Intestinal & Stomach Ulcers
9.3.4.2 Gastroesophageal Reflux
9.3.5 Historic and Forecasted Market Size By Disease
9.3.5.1 GERD
9.3.5.2 Esophagitis
9.3.5.3 Zollinger-Ellison Syndrome
9.3.5.4 and Others
9.3.6 Historic and Forecasted Market Size By Population Type
9.3.6.1 (Children and Adults
9.3.7 Historic and Forecasted Market Size By Dosage Form
9.3.7.1 (Solid Oral
9.3.7.2 Liquid
9.3.7.3 and Parenteral
9.3.8 Historic and Forecast Market Size by Country
9.3.8.1 Russia
9.3.8.2 Bulgaria
9.3.8.3 The Czech Republic
9.3.8.4 Hungary
9.3.8.5 Poland
9.3.8.6 Romania
9.3.8.7 Rest of Eastern Europe
9.4. Western Europe Raman Spectroscopy Market
9.4.1 Key Market Trends, Growth Factors and Opportunities
9.4.2 Top Key Companies
9.4.3 Historic and Forecasted Market Size by Segments
9.4.4 Historic and Forecasted Market Size By Indication
9.4.4.1 (Intestinal & Stomach Ulcers
9.4.4.2 Gastroesophageal Reflux
9.4.5 Historic and Forecasted Market Size By Disease
9.4.5.1 GERD
9.4.5.2 Esophagitis
9.4.5.3 Zollinger-Ellison Syndrome
9.4.5.4 and Others
9.4.6 Historic and Forecasted Market Size By Population Type
9.4.6.1 (Children and Adults
9.4.7 Historic and Forecasted Market Size By Dosage Form
9.4.7.1 (Solid Oral
9.4.7.2 Liquid
9.4.7.3 and Parenteral
9.4.8 Historic and Forecast Market Size by Country
9.4.8.1 Germany
9.4.8.2 UK
9.4.8.3 France
9.4.8.4 The Netherlands
9.4.8.5 Italy
9.4.8.6 Spain
9.4.8.7 Rest of Western Europe
9.5. Asia Pacific Raman Spectroscopy Market
9.5.1 Key Market Trends, Growth Factors and Opportunities
9.5.2 Top Key Companies
9.5.3 Historic and Forecasted Market Size by Segments
9.5.4 Historic and Forecasted Market Size By Indication
9.5.4.1 (Intestinal & Stomach Ulcers
9.5.4.2 Gastroesophageal Reflux
9.5.5 Historic and Forecasted Market Size By Disease
9.5.5.1 GERD
9.5.5.2 Esophagitis
9.5.5.3 Zollinger-Ellison Syndrome
9.5.5.4 and Others
9.5.6 Historic and Forecasted Market Size By Population Type
9.5.6.1 (Children and Adults
9.5.7 Historic and Forecasted Market Size By Dosage Form
9.5.7.1 (Solid Oral
9.5.7.2 Liquid
9.5.7.3 and Parenteral
9.5.8 Historic and Forecast Market Size by Country
9.5.8.1 China
9.5.8.2 India
9.5.8.3 Japan
9.5.8.4 South Korea
9.5.8.5 Malaysia
9.5.8.6 Thailand
9.5.8.7 Vietnam
9.5.8.8 The Philippines
9.5.8.9 Australia
9.5.8.10 New Zealand
9.5.8.11 Rest of APAC
9.6. Middle East & Africa Raman Spectroscopy Market
9.6.1 Key Market Trends, Growth Factors and Opportunities
9.6.2 Top Key Companies
9.6.3 Historic and Forecasted Market Size by Segments
9.6.4 Historic and Forecasted Market Size By Indication
9.6.4.1 (Intestinal & Stomach Ulcers
9.6.4.2 Gastroesophageal Reflux
9.6.5 Historic and Forecasted Market Size By Disease
9.6.5.1 GERD
9.6.5.2 Esophagitis
9.6.5.3 Zollinger-Ellison Syndrome
9.6.5.4 and Others
9.6.6 Historic and Forecasted Market Size By Population Type
9.6.6.1 (Children and Adults
9.6.7 Historic and Forecasted Market Size By Dosage Form
9.6.7.1 (Solid Oral
9.6.7.2 Liquid
9.6.7.3 and Parenteral
9.6.8 Historic and Forecast Market Size by Country
9.6.8.1 Turkiye
9.6.8.2 Bahrain
9.6.8.3 Kuwait
9.6.8.4 Saudi Arabia
9.6.8.5 Qatar
9.6.8.6 UAE
9.6.8.7 Israel
9.6.8.8 South Africa
9.7. South America Raman Spectroscopy Market
9.7.1 Key Market Trends, Growth Factors and Opportunities
9.7.2 Top Key Companies
9.7.3 Historic and Forecasted Market Size by Segments
9.7.4 Historic and Forecasted Market Size By Indication
9.7.4.1 (Intestinal & Stomach Ulcers
9.7.4.2 Gastroesophageal Reflux
9.7.5 Historic and Forecasted Market Size By Disease
9.7.5.1 GERD
9.7.5.2 Esophagitis
9.7.5.3 Zollinger-Ellison Syndrome
9.7.5.4 and Others
9.7.6 Historic and Forecasted Market Size By Population Type
9.7.6.1 (Children and Adults
9.7.7 Historic and Forecasted Market Size By Dosage Form
9.7.7.1 (Solid Oral
9.7.7.2 Liquid
9.7.7.3 and Parenteral
9.7.8 Historic and Forecast Market Size by Country
9.7.8.1 Brazil
9.7.8.2 Argentina
9.7.8.3 Rest of SA
Chapter 10 Analyst Viewpoint and Conclusion
10.1 Recommendations and Concluding Analysis
10.2 Potential Market Strategies
Chapter 11 Research Methodology
11.1 Research Process
11.2 Primary Research
11.3 Secondary Research
|
Global Raman Spectroscopy Market |
|||
|
Base Year: |
2023 |
Forecast Period: |
2024-2032 |
|
Historical Data: |
2017 to 2023 |
Market Size in 2023: |
USD 740 Million |
|
Forecast Period 2024-32 CAGR: |
7.89% |
Market Size in 2032: |
USD 1,465.76 Million |
|
|
By Type |
|
|
|
By Applications |
|
||
|
By Sampling Technique |
|
||
|
By Instruments |
|
||
|
By Region |
|
||
|
Key Market Drivers: |
|
||
|
Key Market Restraints: |
|
||
|
Key Opportunities: |
|
||
|
Companies Covered in the report: |
|
||


