


Practice Management Software for Accountants & Bookkeepers Market Synopsis
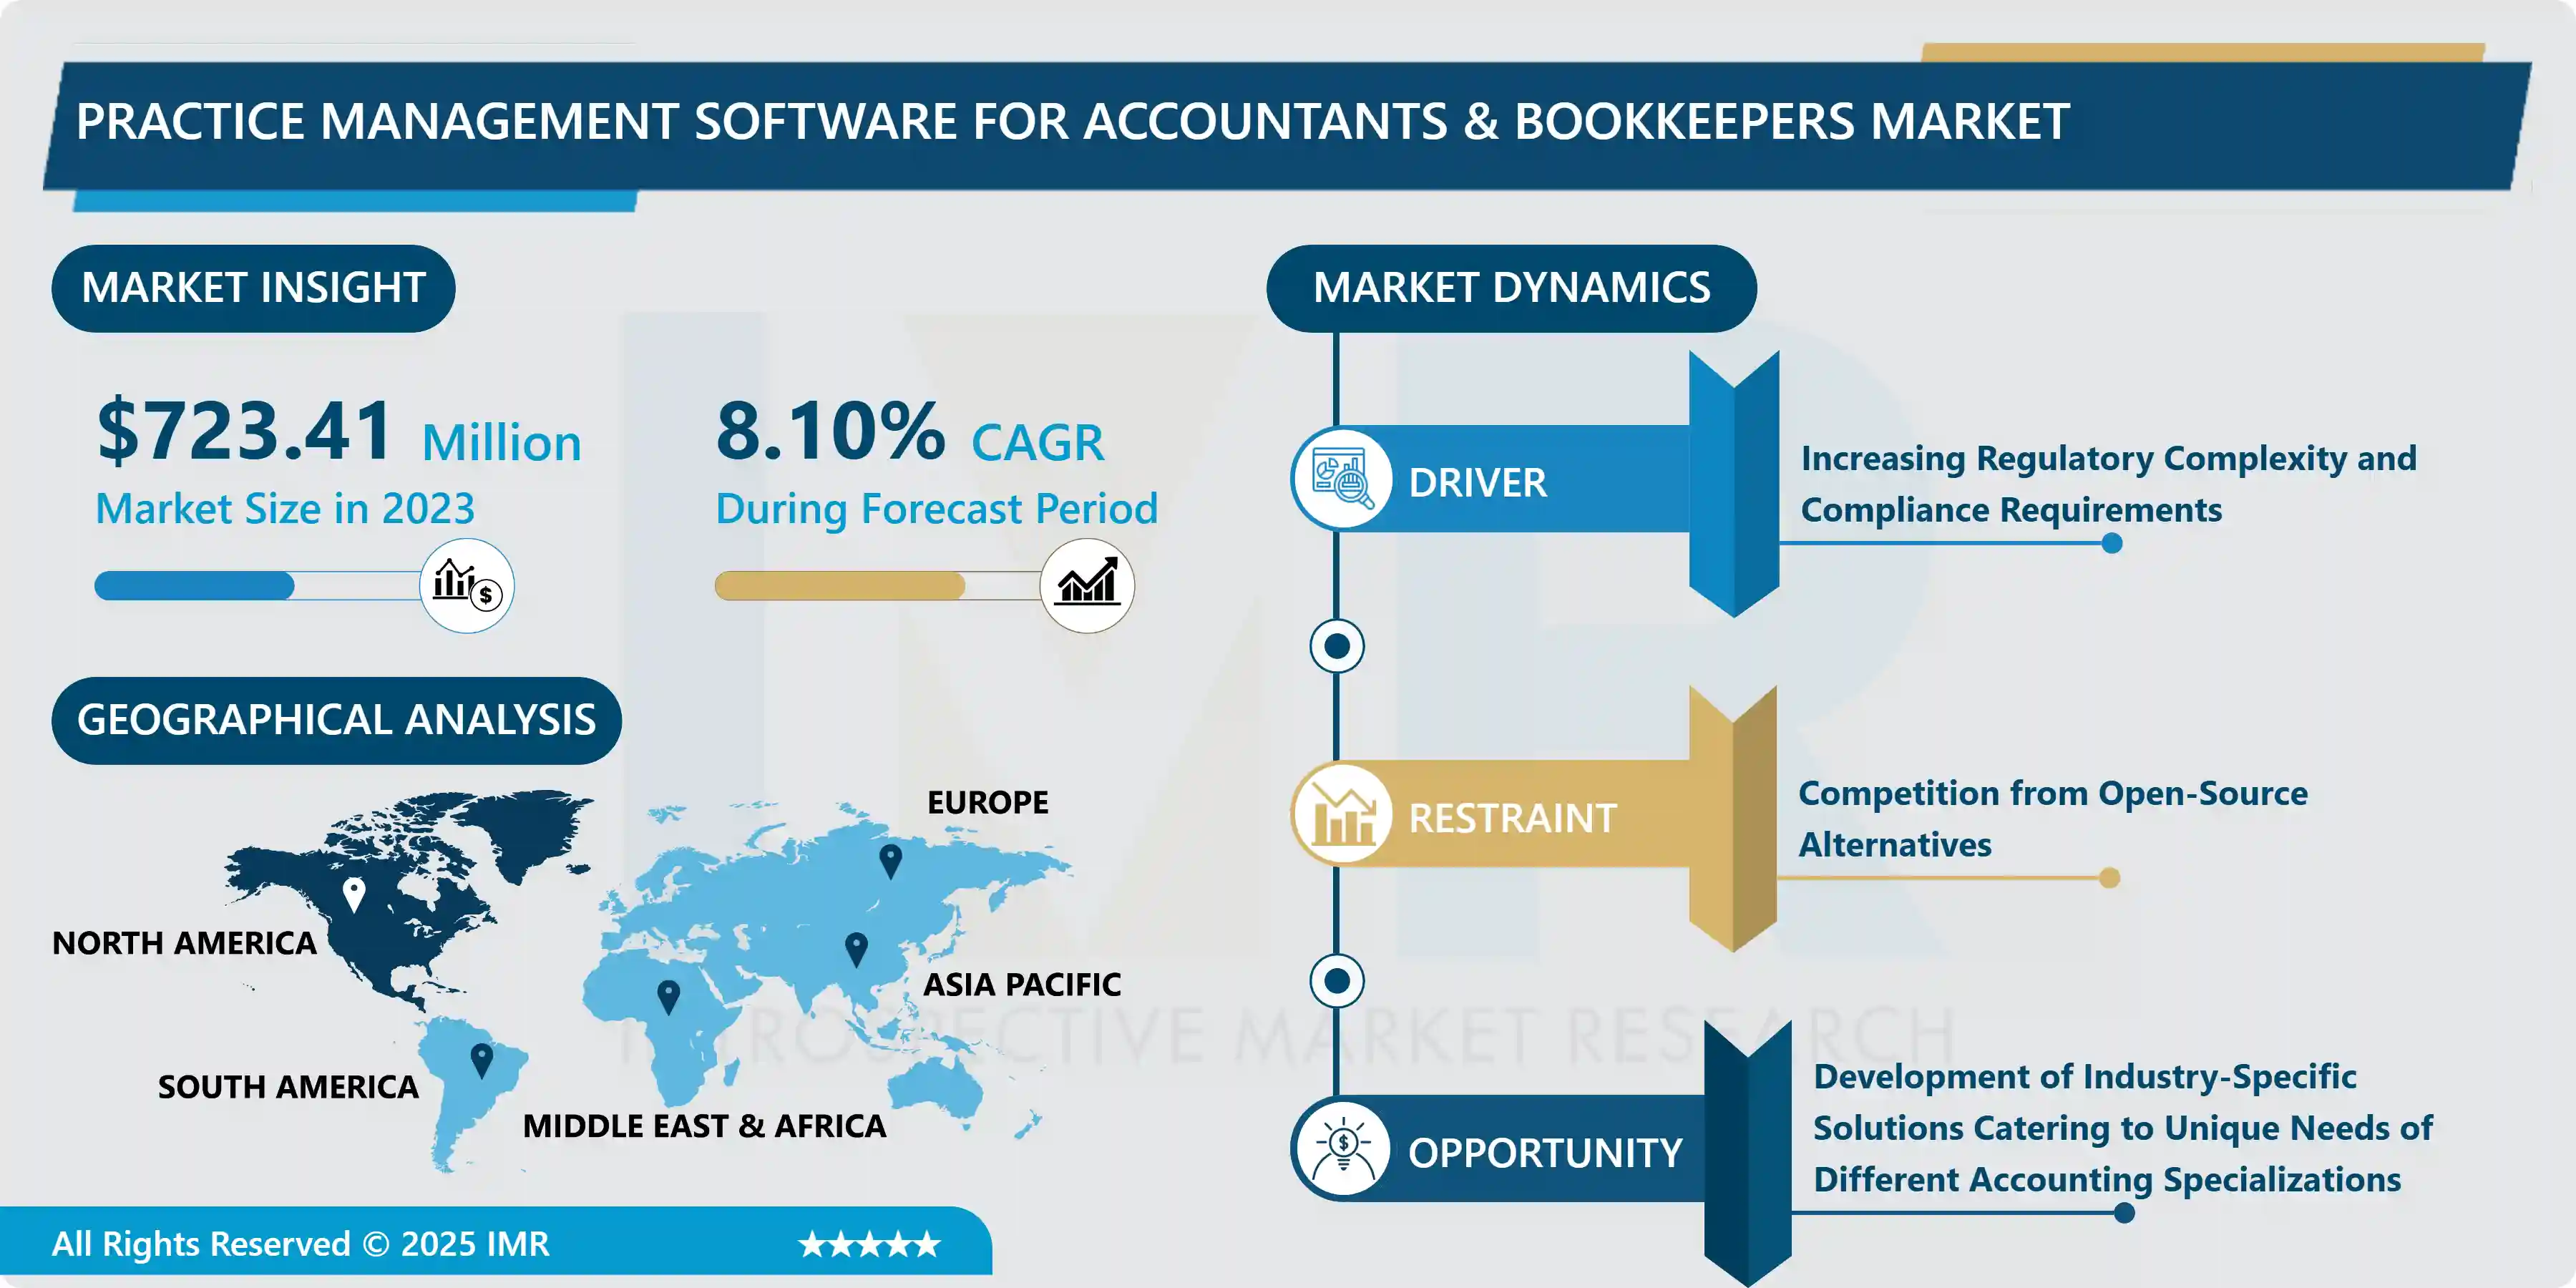
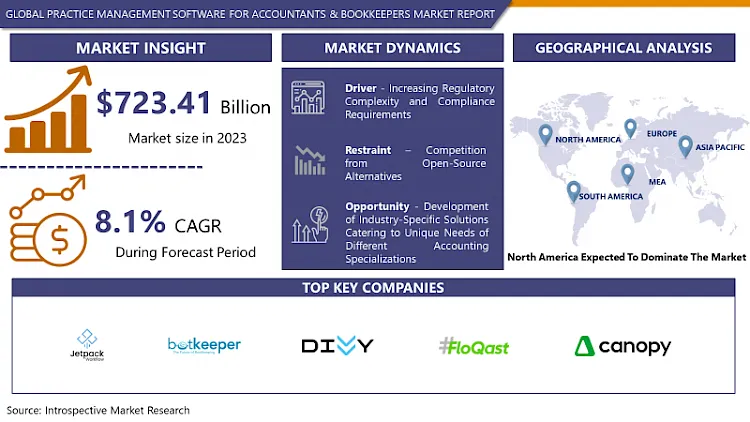
Global Practice Management Software for Accountants & Bookkeepers Market Size Was Valued at USD 723.41 Million in 2023 and is Projected to Reach USD 1458.2 Million by 2032, Growing at a CAGR of 8.10% From 2024-2032.
Practice management software for accountants and bookkeepers refers to specialized digital tools designed to streamline and optimize various aspects of accounting and bookkeeping practices. This software typically includes features such as client management, billing and invoicing, time tracking, task management, and financial reporting, providing professionals with efficient tools to manage their workflows and client interactions effectively.
Practice management software for accountants and bookkeepers is extensively applied across the financial services sector, facilitating efficient management of client engagements, invoicing, time tracking, task delegation, and financial reporting. These software solutions automate repetitive tasks, streamline workflow processes, and provide real-time insights, enabling professionals to focus more on strategic decision-making and client advisory services. Additionally, they offer integration with accounting software, ensuring seamless data transfer and accuracy in financial records.
The advantages of practice management software for accountants and bookkeepers are manifold. they enhance productivity by reducing manual errors and saving time on administrative tasks, allowing professionals to allocate more resources to value-added services. These software solutions improve client satisfaction by providing transparent communication, timely deliverables, and accurate financial reporting, thereby strengthening client relationships and loyalty. Moreover, they offer scalability, adaptability, and customization options, catering to the evolving needs of accounting and bookkeeping practices in a dynamic business environment.
Practice management software in the accounting and bookkeeping industry is expected to surge as firms increasingly prioritize digital transformation and automation. With advancements in technology, such as artificial intelligence and cloud computing, these software solutions are becoming more sophisticated, offering predictive analytics, cybersecurity features, and mobile accessibility. As the demand for efficiency, accuracy, and compliance continues to rise, the adoption of practice management software among accountants and bookkeepers is projected to grow significantly, driving innovation and market expansion in the coming years.
Practice Management Software for Accountants & Bookkeepers Market Trend Analysis:
Increasing Regulatory Complexity and Compliance Requirements
- The growth of the practice management software market for accountants and bookkeepers is being driven significantly by increasing regulatory complexity and compliance requirements in the financial sector. As regulatory standards evolve and become more stringent, professionals in accounting and bookkeeping face a growing burden of compliance tasks and reporting obligations. Practice management software plays a vital role in helping these professionals navigate through complex regulatory frameworks by automating compliance checks, generating accurate reports, and ensuring adherence to regulatory guidelines.
- Moreover, the implementation of practice management software enables accountants and bookkeepers to stay updated with regulatory changes in real-time. These software solutions often come equipped with features that provide alerts and notifications about regulatory updates, helping professionals proactively address compliance issues and avoid penalties. The ability to maintain compliance efficiently and effectively positions practice management software as a valuable asset for accounting and bookkeeping firms operating in a highly regulated environment.
- Furthermore, the demand for practice management software is expected to continue growing as regulatory requirements become more intricate and specialized. With the need for comprehensive risk management, data security, and audit trail capabilities, professionals increasingly rely on advanced software solutions to ensure compliance and mitigate regulatory risks. As the regulatory landscape continues to evolve, the market for practice management software is poised for further expansion, driven by the imperative need for robust compliance tools and streamlined workflows in the accounting and bookkeeping industry.
Development of Industry-Specific Solutions Catering to Unique Needs of Different Accounting Specializations
- The development of industry-specific solutions tailored to meet the unique requirements of various accounting specializations presents a significant opportunity for the growth of the practice management software market for accountants and bookkeepers. As the accounting profession diversifies and professionals specialize in different areas such as tax accounting, audit services, forensic accounting, and financial advisory, there is a growing demand for software solutions that can address the specific needs and challenges of each specialization.
- Industry-specific practice management software offers customized features and functionalities that cater to the workflows, reporting standards, compliance requirements, and client management practices inherent in different accounting specializations. For instance, software designed for tax accountants may include modules for tax planning, filing, and compliance tracking, while software for forensic accountants may focus on data analysis, fraud detection, and investigation capabilities.
- The emergence of these tailored solutions not only enhances the efficiency and accuracy of accounting processes but also improves client service delivery and satisfaction. By leveraging industry-specific software, accountants and bookkeepers can optimize their operations, minimize errors, mitigate risks, and deliver value-added services more effectively. This trend is expected to drive the adoption of practice management software across various accounting specializations, fueling market growth and fostering innovation in software development to meet the evolving needs of the accounting profession.
Practice Management Software for Accountants & Bookkeepers Market Segment Analysis:
Practice Management Software for Accountants & Bookkeepers Market Segmented on the basis of Deployment Model, Pricing Model, and Application.
By Application., Small and Medium-Sized Practices segment is expected to dominate the market during the forecast period
- The small and medium-sized practices segment is poised to dominate the growth of the practice management software market for accountants and bookkeepers. This trend is driven by several factors, including the increasing adoption of digital solutions among smaller practices to enhance efficiency, improve client service, and remain competitive in a dynamic business environment. Practice management software offers these practices an integrated platform to manage client relationships, streamline workflows, automate routine tasks, and ensure compliance with regulatory standards.
- Furthermore, the affordability and scalability of practice management software solutions make them particularly attractive to small and medium-sized practices. These software tools provide cost-effective alternatives to manual processes, reducing overhead costs, minimizing errors, and enabling practitioners to focus more on value-added services and client advisory roles. As the demand for efficient practice management solutions continues to rise among smaller practices seeking to optimize operations and deliver high-quality services, the small and medium-sized practices segment is expected to experience significant growth in the practice management software market for accountants and bookkeepers.
By Deployment Model, Cloud-based segment held the largest share of 83.12% in 2022
- The cloud-based segment has maintained the largest share in driving the growth of the practice management software market for accountants and bookkeepers. This dominance is attributed to the numerous benefits offered by cloud-based solutions, including accessibility, scalability, cost-effectiveness, and real-time collaboration. Cloud-based practice management software allows professionals to access their data and tools from anywhere with an internet connection, enabling remote work capabilities and enhancing productivity.
- Moreover, cloud-based solutions eliminate the need for on-premises infrastructure and maintenance costs associated with traditional software installations, making them more cost-effective for small to medium-sized practices. The scalability of cloud-based software allows firms to adjust their usage and storage needs as their business grows, ensuring flexibility and efficiency in resource management. Additionally, cloud-based platforms facilitate seamless collaboration among team members and clients, improving communication, data sharing, and client service delivery. These advantages have positioned the cloud-based segment as the preferred choice for accountants and bookkeepers looking to leverage modern technology for practice management.
Practice Management Software for Accountants & Bookkeepers Market Regional Insights:
North America is Expected to Dominate the Market Over the Forecast period
- North America is anticipated to lead in dominating the region for the growth of the practice management software market for accountants and bookkeepers. This expectation stems from several factors, including the strong presence of key market players, advanced technological infrastructure, and the widespread adoption of digital solutions among accounting and bookkeeping firms in the region. Additionally, North America boasts a large number of small and medium-sized practices that are increasingly embracing practice management software to enhance efficiency, streamline workflows, and improve client service delivery.
- Furthermore, the regulatory landscape in North America, characterized by evolving compliance requirements and reporting standards, drives the demand for sophisticated practice management solutions that can ensure compliance and mitigate risks effectively. The market in this region also benefits from the availability of cloud-based software solutions, which offer scalability, accessibility, and cost-effectiveness, catering to the diverse needs of accounting and bookkeeping professionals. As North America continues to prioritize technological advancements and digital transformation in the financial services sector, it is poised to maintain its dominance in the practice management software market for accountants and bookkeepers.
Practice Management Software for Accountants & Bookkeepers Market Top Key Players:
- Jetpack Workflow (U.S.)
- BQE Software, Inc. (U.S.)
- Botkeeper, Inc. (U.S.)
- Divvy (U.S.)
- FloQast (U.S.)
- AbacusNext (U.S.)
- Canopy Tax, Inc. (U.S.)
- Sage Group plc (U.S.)
- QuickBooks (U.S.)
- NetSuite Inc. (U.S.)
- Thomson Reuters Corporation (Canada)
- Wave Financial Inc. (Canada)
- FreshBooks (Canada)
- Bench Accounting (Canada)
- KashFlow Software Ltd (UK)
- Ignition (Australia)
- MYOB Australia Pty Ltd (Australia)
- Xero Limited (New Zealand)
- Zoho Corporation Pvt. Ltd (India), and Other Major Players
Key Industry Developments in the Practice Management Software for Accountants & Bookkeepers Market:
- In January 2024, CoralTree, Inc. introduced significant upgrades to its Basil Practice Management software, tailored for CPAs, enrolled agents, bookkeepers, and business owners. Known for Qbox, trusted by tens of thousands of QuickBooks™ users for secure financial data sharing, CoralTree extends its expertise to Basil. Designed to ensure consistency and security, Basil empowers accountants with a robust platform for efficient client management. These enhancements underscore CoralTree's commitment to providing cutting-edge solutions that streamline workflow and elevate performance in the accounting industry.
- In March 2022, Xero, a global small business platform, launched its Making Tax Digital for Income Tax Self-Assessment (MTD for ITSA) beta, enabling accountants and bookkeepers to participate in HMRC's pilot and prepare for a significant tax system change impacting 4.2 million UK taxpayers. This will enable advisors to comply with new reporting regulations and progress in their digital journey.
|
Global Practice Management Software for Accountants & Bookkeepers Market |
|||
|
Base Year: |
2023 |
Forecast Period: |
2024-2032 |
|
Historical Data: |
2017 to 2032 |
Market Size in 2023: |
USD 723.41 Mn. |
|
Forecast Period 2024-32 CAGR: |
8.10% |
Market Size in 2030: |
USD 1458.2 Mn. |
|
Segments Covered: |
By Deployment Model |
|
|
|
By Pricing Model |
|
||
|
By Application |
|
||
|
By Region |
|
||
|
Key Market Drivers: |
|
||
|
Key Market Restraints: |
|
||
|
Key Opportunities: |
|
||
|
Companies Covered in the report: |
|
||
Chapter 1: Introduction
1.1 Scope and Coverage
Chapter 2:Executive Summary
Chapter 3: Market Landscape
3.1 Market Dynamics
3.1.1 Drivers
3.1.2 Restraints
3.1.3 Opportunities
3.1.4 Challenges
3.2 Market Trend Analysis
3.3 PESTLE Analysis
3.4 Porter's Five Forces Analysis
3.5 Industry Value Chain Analysis
3.6 Ecosystem
3.7 Regulatory Landscape
3.8 Price Trend Analysis
3.9 Patent Analysis
3.10 Technology Evolution
3.11 Investment Pockets
3.12 Import-Export Analysis
Chapter 4: Practice Management Software for Accountants & Bookkeepers Market by Deployment Model (2018-2032)
4.1 Practice Management Software for Accountants & Bookkeepers Market Snapshot and Growth Engine
4.2 Market Overview
4.3 Cloud-based
4.3.1 Introduction and Market Overview
4.3.2 Historic and Forecasted Market Size in Value USD and Volume Units
4.3.3 Key Market Trends, Growth Factors, and Opportunities
4.3.4 Geographic Segmentation Analysis
4.4 On-premise
Chapter 5: Practice Management Software for Accountants & Bookkeepers Market by Pricing Model (2018-2032)
5.1 Practice Management Software for Accountants & Bookkeepers Market Snapshot and Growth Engine
5.2 Market Overview
5.3 Pay-as-you-go
5.3.1 Introduction and Market Overview
5.3.2 Historic and Forecasted Market Size in Value USD and Volume Units
5.3.3 Key Market Trends, Growth Factors, and Opportunities
5.3.4 Geographic Segmentation Analysis
5.4 Perpetual License
Chapter 6: Practice Management Software for Accountants & Bookkeepers Market by Application (2018-2032)
6.1 Practice Management Software for Accountants & Bookkeepers Market Snapshot and Growth Engine
6.2 Market Overview
6.3 Small and Medium-Sized Practices
6.3.1 Introduction and Market Overview
6.3.2 Historic and Forecasted Market Size in Value USD and Volume Units
6.3.3 Key Market Trends, Growth Factors, and Opportunities
6.3.4 Geographic Segmentation Analysis
6.4 Large Accounting Firms
Chapter 7: Company Profiles and Competitive Analysis
7.1 Competitive Landscape
7.1.1 Competitive Benchmarking
7.1.2 Practice Management Software for Accountants & Bookkeepers Market Share by Manufacturer (2024)
7.1.3 Industry BCG Matrix
7.1.4 Heat Map Analysis
7.1.5 Mergers and Acquisitions
7.2 SKETCHUP (U.S.)
7.2.1 Company Overview
7.2.2 Key Executives
7.2.3 Company Snapshot
7.2.4 Role of the Company in the Market
7.2.5 Sustainability and Social Responsibility
7.2.6 Operating Business Segments
7.2.7 Product Portfolio
7.2.8 Business Performance
7.2.9 Key Strategic Moves and Recent Developments
7.2.10 SWOT Analysis
7.3 AUTODESK (U.S.)
7.4 CHIEF ARCHITECT (U.S.)
7.5 REVIT (U.S.)
7.6 RHINO (U.S.)
7.7 ARCHICAD (HUNGARY)
7.8 CEDREO (FRANCE)
7.9 HOME DESIGNER SOFTWARE (U.S.)
7.10 SWEET HOME 3D (FRANCE)
7.11 3D HOME ARCHITECT (U.S.)
7.12 PLANNER 5D (LITHUANIA)
7.13 LIVE HOME 3D (LITHUANIA)
7.14 TURBOCAD (U.S.)
7.15 FLOORPLANNER (NETHERLANDS)
7.16 HOMEBYME (FRANCE)
7.17 PUNCH! SOFTWARE (U.S.)
7.18 EASY BLUE PRINT (U.S.)
7.19 ROOMSKETCHER (NORWAY)
7.20 SPACE DESIGNER 3D (FRANCE)
7.21 CEDREO HOME PLANNER (FRANCE)
7.22 HOMESTYLER (U.S.)
7.23 MAGICPLAN (GERMANY)
7.24 PLANNER 5D (LITHUANIA)
7.25 ROOMLE (AUSTRIA)
Chapter 8: Global Practice Management Software for Accountants & Bookkeepers Market By Region
8.1 Overview
8.2. North America Practice Management Software for Accountants & Bookkeepers Market
8.2.1 Key Market Trends, Growth Factors and Opportunities
8.2.2 Top Key Companies
8.2.3 Historic and Forecasted Market Size by Segments
8.2.4 Historic and Forecasted Market Size by Deployment Model
8.2.4.1 Cloud-based
8.2.4.2 On-premise
8.2.5 Historic and Forecasted Market Size by Pricing Model
8.2.5.1 Pay-as-you-go
8.2.5.2 Perpetual License
8.2.6 Historic and Forecasted Market Size by Application
8.2.6.1 Small and Medium-Sized Practices
8.2.6.2 Large Accounting Firms
8.2.7 Historic and Forecast Market Size by Country
8.2.7.1 US
8.2.7.2 Canada
8.2.7.3 Mexico
8.3. Eastern Europe Practice Management Software for Accountants & Bookkeepers Market
8.3.1 Key Market Trends, Growth Factors and Opportunities
8.3.2 Top Key Companies
8.3.3 Historic and Forecasted Market Size by Segments
8.3.4 Historic and Forecasted Market Size by Deployment Model
8.3.4.1 Cloud-based
8.3.4.2 On-premise
8.3.5 Historic and Forecasted Market Size by Pricing Model
8.3.5.1 Pay-as-you-go
8.3.5.2 Perpetual License
8.3.6 Historic and Forecasted Market Size by Application
8.3.6.1 Small and Medium-Sized Practices
8.3.6.2 Large Accounting Firms
8.3.7 Historic and Forecast Market Size by Country
8.3.7.1 Russia
8.3.7.2 Bulgaria
8.3.7.3 The Czech Republic
8.3.7.4 Hungary
8.3.7.5 Poland
8.3.7.6 Romania
8.3.7.7 Rest of Eastern Europe
8.4. Western Europe Practice Management Software for Accountants & Bookkeepers Market
8.4.1 Key Market Trends, Growth Factors and Opportunities
8.4.2 Top Key Companies
8.4.3 Historic and Forecasted Market Size by Segments
8.4.4 Historic and Forecasted Market Size by Deployment Model
8.4.4.1 Cloud-based
8.4.4.2 On-premise
8.4.5 Historic and Forecasted Market Size by Pricing Model
8.4.5.1 Pay-as-you-go
8.4.5.2 Perpetual License
8.4.6 Historic and Forecasted Market Size by Application
8.4.6.1 Small and Medium-Sized Practices
8.4.6.2 Large Accounting Firms
8.4.7 Historic and Forecast Market Size by Country
8.4.7.1 Germany
8.4.7.2 UK
8.4.7.3 France
8.4.7.4 The Netherlands
8.4.7.5 Italy
8.4.7.6 Spain
8.4.7.7 Rest of Western Europe
8.5. Asia Pacific Practice Management Software for Accountants & Bookkeepers Market
8.5.1 Key Market Trends, Growth Factors and Opportunities
8.5.2 Top Key Companies
8.5.3 Historic and Forecasted Market Size by Segments
8.5.4 Historic and Forecasted Market Size by Deployment Model
8.5.4.1 Cloud-based
8.5.4.2 On-premise
8.5.5 Historic and Forecasted Market Size by Pricing Model
8.5.5.1 Pay-as-you-go
8.5.5.2 Perpetual License
8.5.6 Historic and Forecasted Market Size by Application
8.5.6.1 Small and Medium-Sized Practices
8.5.6.2 Large Accounting Firms
8.5.7 Historic and Forecast Market Size by Country
8.5.7.1 China
8.5.7.2 India
8.5.7.3 Japan
8.5.7.4 South Korea
8.5.7.5 Malaysia
8.5.7.6 Thailand
8.5.7.7 Vietnam
8.5.7.8 The Philippines
8.5.7.9 Australia
8.5.7.10 New Zealand
8.5.7.11 Rest of APAC
8.6. Middle East & Africa Practice Management Software for Accountants & Bookkeepers Market
8.6.1 Key Market Trends, Growth Factors and Opportunities
8.6.2 Top Key Companies
8.6.3 Historic and Forecasted Market Size by Segments
8.6.4 Historic and Forecasted Market Size by Deployment Model
8.6.4.1 Cloud-based
8.6.4.2 On-premise
8.6.5 Historic and Forecasted Market Size by Pricing Model
8.6.5.1 Pay-as-you-go
8.6.5.2 Perpetual License
8.6.6 Historic and Forecasted Market Size by Application
8.6.6.1 Small and Medium-Sized Practices
8.6.6.2 Large Accounting Firms
8.6.7 Historic and Forecast Market Size by Country
8.6.7.1 Turkiye
8.6.7.2 Bahrain
8.6.7.3 Kuwait
8.6.7.4 Saudi Arabia
8.6.7.5 Qatar
8.6.7.6 UAE
8.6.7.7 Israel
8.6.7.8 South Africa
8.7. South America Practice Management Software for Accountants & Bookkeepers Market
8.7.1 Key Market Trends, Growth Factors and Opportunities
8.7.2 Top Key Companies
8.7.3 Historic and Forecasted Market Size by Segments
8.7.4 Historic and Forecasted Market Size by Deployment Model
8.7.4.1 Cloud-based
8.7.4.2 On-premise
8.7.5 Historic and Forecasted Market Size by Pricing Model
8.7.5.1 Pay-as-you-go
8.7.5.2 Perpetual License
8.7.6 Historic and Forecasted Market Size by Application
8.7.6.1 Small and Medium-Sized Practices
8.7.6.2 Large Accounting Firms
8.7.7 Historic and Forecast Market Size by Country
8.7.7.1 Brazil
8.7.7.2 Argentina
8.7.7.3 Rest of SA
Chapter 9 Analyst Viewpoint and Conclusion
9.1 Recommendations and Concluding Analysis
9.2 Potential Market Strategies
Chapter 10 Research Methodology
10.1 Research Process
10.2 Primary Research
10.3 Secondary Research
|
Global Practice Management Software for Accountants & Bookkeepers Market |
|||
|
Base Year: |
2023 |
Forecast Period: |
2024-2032 |
|
Historical Data: |
2017 to 2032 |
Market Size in 2023: |
USD 723.41 Mn. |
|
Forecast Period 2024-32 CAGR: |
8.10% |
Market Size in 2030: |
USD 1458.2 Mn. |
|
Segments Covered: |
By Deployment Model |
|
|
|
By Pricing Model |
|
||
|
By Application |
|
||
|
By Region |
|
||
|
Key Market Drivers: |
|
||
|
Key Market Restraints: |
|
||
|
Key Opportunities: |
|
||
|
Companies Covered in the report: |
|
||


