


Peat Market Overview
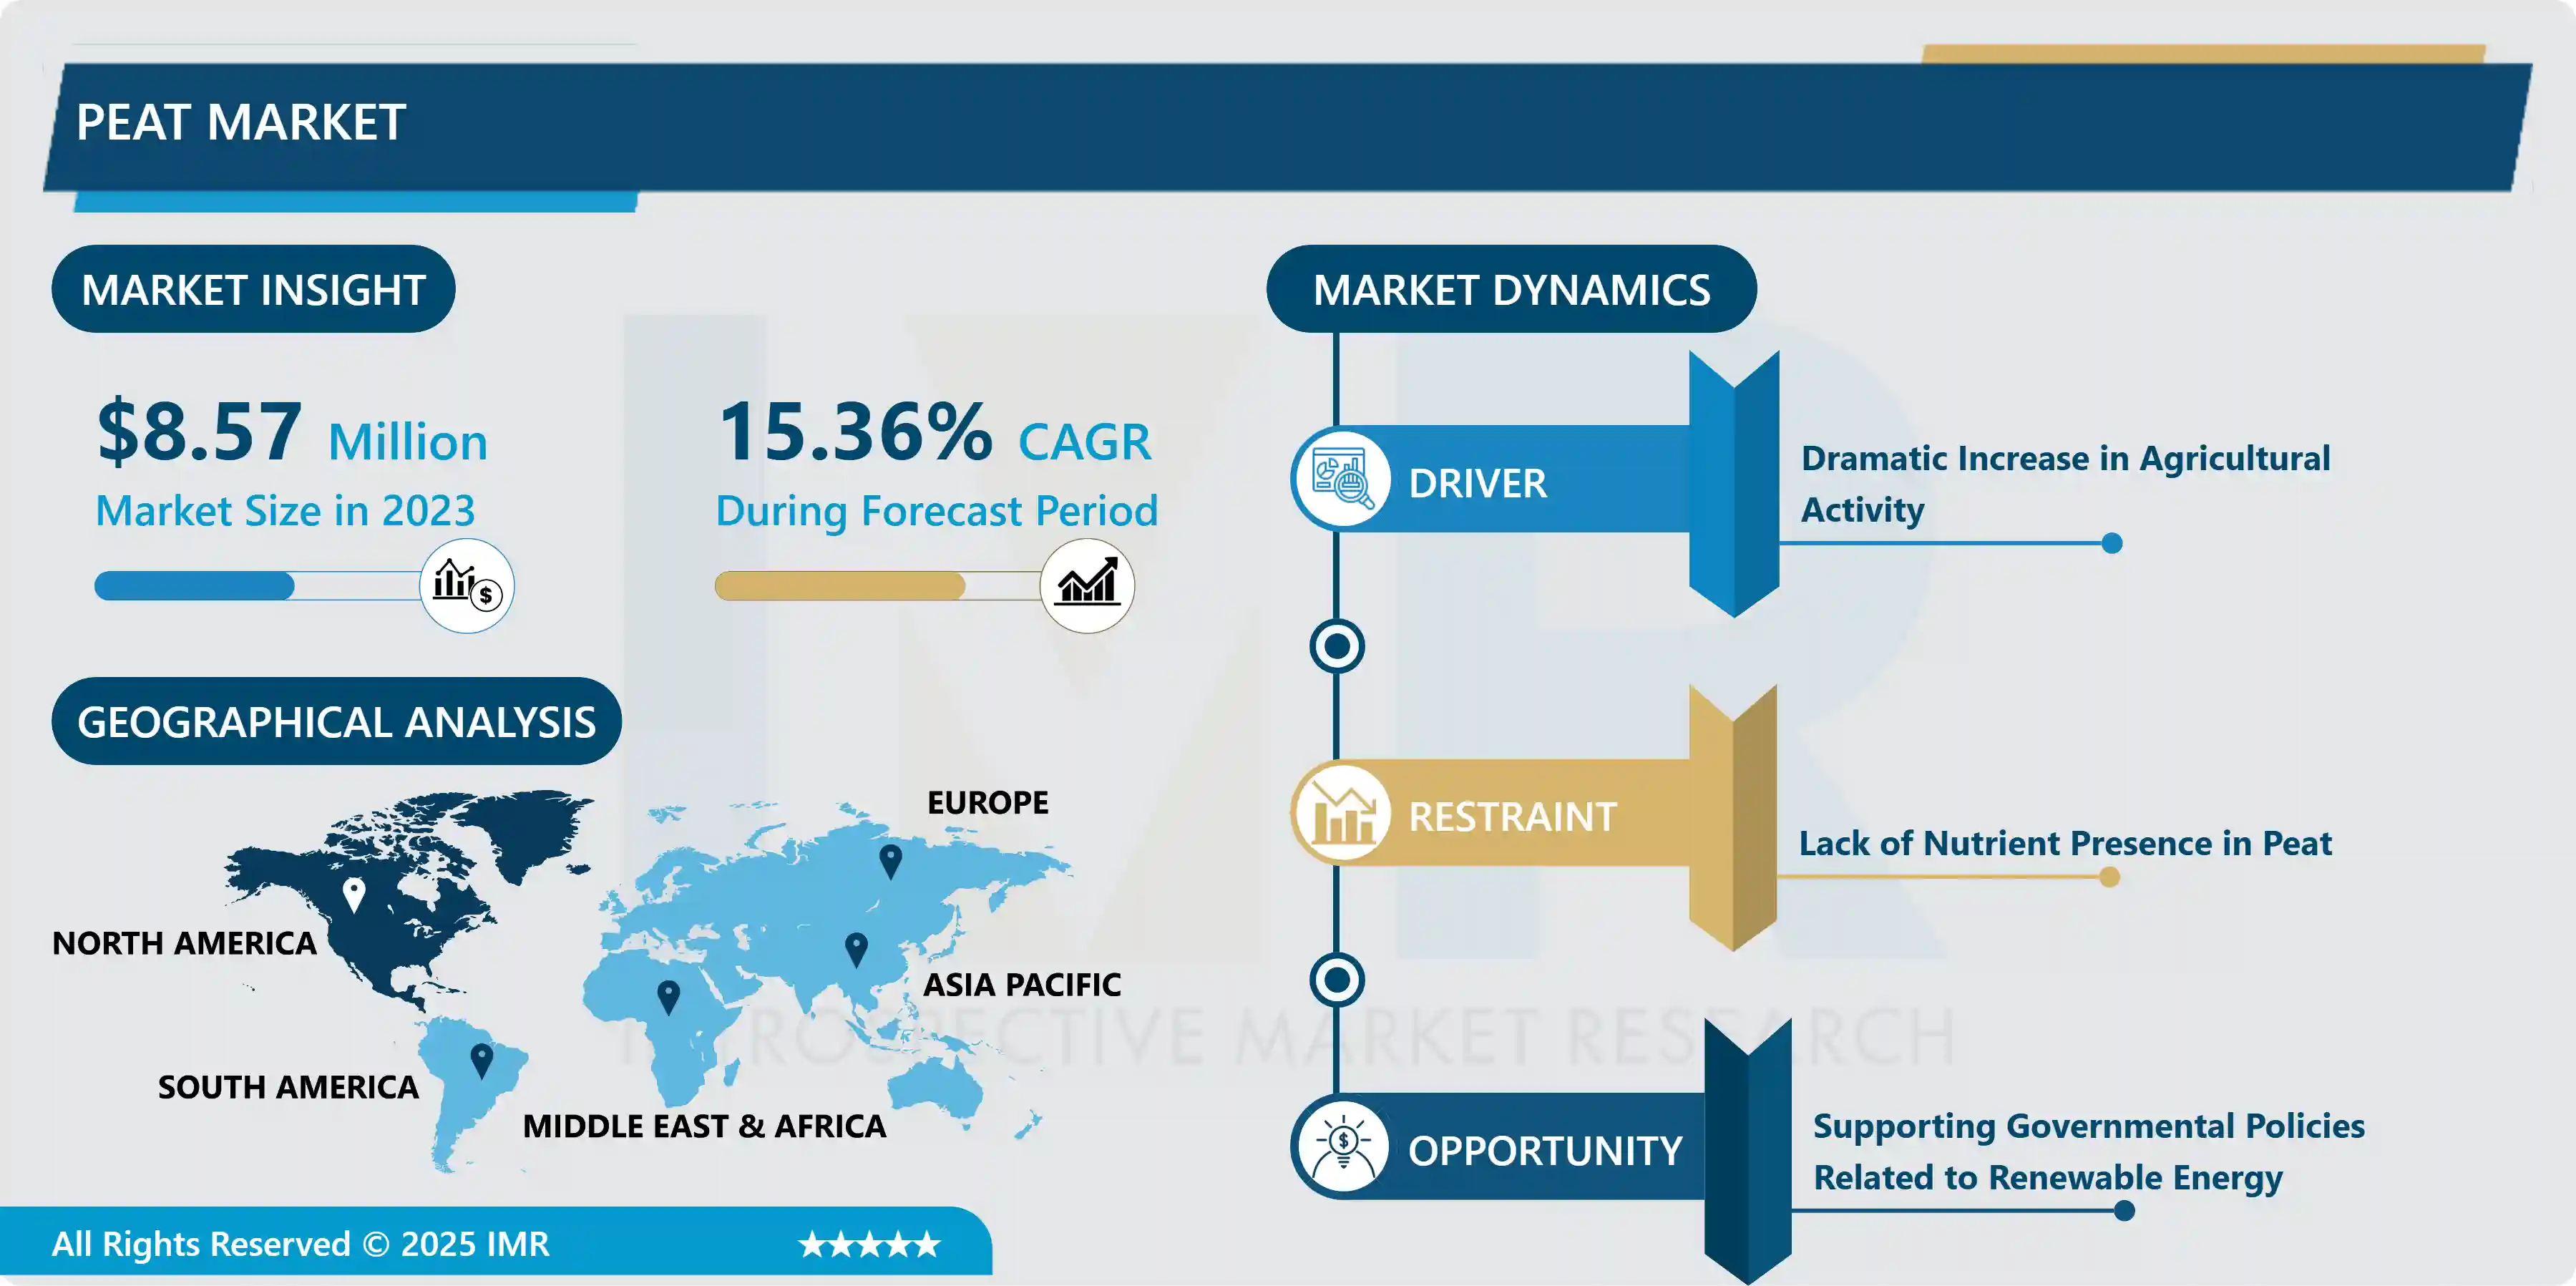
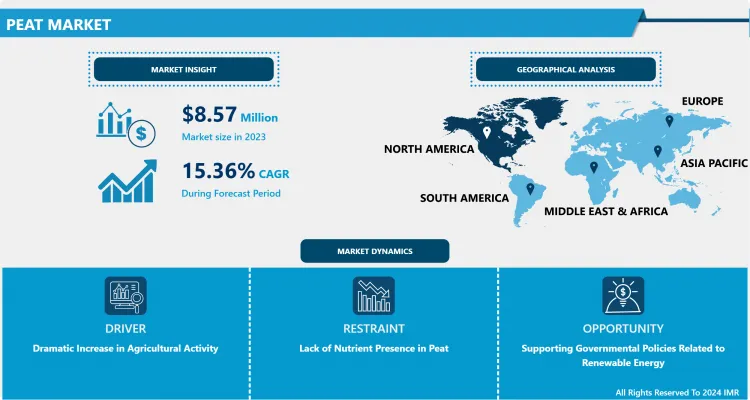
The Global Peat Market size is expected to grow from USD 8.57 Million in 2023 to USD 31.01 Million by 2032, at a CAGR of 15.36% during the forecast period (2024-2032).
Peat is a spongy material generated in wetlands such as swamps, muskegs, bogs, fens, and moors by the partial decomposition of organic matter, typically plant material. Warm moist climatic conditions favor peat formation; yet, peat can form even in cold places like Siberia, Canada, and Scandinavia. Peat is economically essential as a carbon sink, a source of fuel, and a raw material in horticulture and other industries, in addition to its significant ecological relevance. Based on their macroscopic, microscopic, and chemical features, peats can be classified as fabric, coarse hemic, hemic, fine hemic, and sapric. Four qualities separate peat from lower-ranking coals: Peats can be cut with a knife and contain free cellulose, more than 75 percent moisture, and less than 60 percent carbon. Brown coal is formed over a long period and is commonly found at depths of 100 to 400 meters (approximately 330 to 1,300 feet). Dried peat can be used as a fuel and produces a smoky flame and distinct odor when burned. Except for types with a high inorganic matter concentration, the ash is powdery and light. Peat is a fuel suited for boiler firing in either briquettes or pulverized form and is used for household heating as an alternative to firewood. Peat has also been utilized to generate modest amounts of energy and is used for household cooking in some regions.
Peat makes up a small part of the world's energy supply, but considerable quantities can be found in Canada, China, Indonesia, Russia, Scandinavia, and the United States. Finland, Ireland, Belarus, and Sweden were the leading four-peat producers in the early twenty-first century, and these and other northern European nations accounted for the majority of peat users.
Market Dynamics and Factors of the Peat Market
Drivers:
Augmenting Application of Renewable Energy Sources
- The global market for peat has been driven by an increase in demand for natural and organic matter. Increased environmental concerns and awareness of the necessity of renewable energy sources indicate that non-renewable energy sources will be depleted in the future. Due to population growth, there is also a rise in demand for power generation. Renewable energy use grew by 3% in 2020, while demand for all other fuels fell. The biggest cause was a nearly 7% increase in renewable-energy-generated power. Despite decreasing electricity demand, supply chain issues, and building delays in many parts of the world, renewables development was fueled by long-term contracts, priority access to the grid, and the continuing installation of new plants. As a result, renewables will account for 29 percent of worldwide electricity generation in 2020, up from 27 percent in 2019. The industry's usage of bioenergy increased by 3%, but this was substantially offset by a drop-in biofuel, as lower oil demand lowered the use of blended biofuels. Renewable power output is expected to grow by more than 8% in 2021, reaching 8 300 TWh, the highest annual growth rate since the 1970s. Solar PV and wind are expected to account for two-thirds of future renewable energy growth. In 2021, China alone is expected to account for about half of the global increase in renewable electricity, with the United States, the European Union, and India following closely after.
Restraints:
There Are Not Too Many Nutrients in Peat Moss.
- Discouraging many farmers from using, it has stifled growth. They have no idea how it could aid in the addition of nutrients to their crops. Crops have a high nutritional value, which helps justify farmers' demands for higher prices. Manufacturers of peat moss must figure out how to make peat moss with a higher nutrient content without contaminating and/or harming the environment. They are addressing this issue by extensively spending on research and development to create new technologies that can make peat moss more nutrient-richer while also being environmentally friendly.
Opportunities:
- The Peat market's strong CAGR provides several chances for manufacturers. Traditional peat moss has little extra value. Many firms have responded by developing technology to increase the value of peat moss.
Segmentation of the Peat Market
- By type, the coco peat segment is anticipated to hold the maximum peat market share over the forecast period. Coco coir is a natural waste product of the coconut industry and is one of the most adaptable organic growing mediums available. Coco peat is an environmentally friendly alternative to peat moss that has natural disease resistance and good water retention and aeration for plants. Coco peat increases the porosity of the soil while also increasing the water holding capacity of the potting mix. This prevents the plant from being overwatered or underwatered. Because of the high porosity, water retention capacity, and cation exchange capacity of coco peat, the amount of coco peat required per plant can be quite low. Coco peat is an extremely forgiving hydroponic (soilless) media due to its great qualities. Because it is an organic medium, it has a high Cation Exchange Capacity, which allows nutrients to be taken and released as needed by the plants.
- By material type, the fabric segment is expected to dominate the peat market over the forecast period. The sheathed cotton sedge Eriophorum vaginatum, which grows in bogs and marshy soils, contains peat fiber. Raised bogs always form on low-mineral-content soils with minimal drainage. Rainwater collects as if in a bathtub that fills up over time. Fabric peat can be used to substitute a variety of natural fibers sustainably, without the need for fiber crops to be grown on agricultural land. Peat as fiber helps to conserve wood for other use. Fabric peat has a lot of antibacterial characteristics, as well as a lot of moisture and tolerance.
- By application, the agriculture segment is expected to grab the leading position in the peat market during the forecast period. Peat is high in organic matter and contains a small amount of nitrogen, phosphorus, and potassium nutrients, which can provide a large number of nutrient elements for the soil. Peat also contains a large amount of humic acid, which aids in the formation of soil aggregate structure and improves soil properties. Peat has matured as a fertilizer technique over the world. Peat commercial organic fertilizer, peat organic-inorganic compound fertilizer, peat trace element compound fertilizer, peat biological active organic fertilizer, peat spraying fertilizer, and peat flushing fertilizer are the five types of fertilizers currently available. Because of their high humic acid concentration, the first three types of humic acid fertilizers are also known as humic acid fertilizers. Peat is also readily available, and it is mostly used in horticulture to make nutrient soil, nutrient bowls, seedbed soil, and fibrous and powdery, granular commercial peat. The collecting, processing, and industrial production of peat in some industrialized nations has been accomplished based on mature scientific theory, and the technological process has been finished, allowing for the manufacture of new high-quality products such as peat nourishment bowls and grass.
Regional Analysis of the Peat Market
- Due to increased demand from heavy industries, the peat industry in North America is likely to rise rapidly. A primary development driver in North America is the preference for peat as a substitute fuel in a variety of end-use applications such as agriculture, freshwater aquariums, water filtration, and others. Furthermore, in the short term, production in the United States is likely to average around 420,000 tons per year, with imported peat from Canada accounting for more than 80% of domestic consumption. Imports are expected to rise to 1.7 million tons in 2021, up from 1.4 million tons in 2020, while exports are expected to fall to around 38,000 tons, down from 46,000 tons in 2020. Peat stocks were expected to be roughly the same in 2021 as they were the prior year. Finland, Sweden, Germany, Latvia, Belarus, and Canada were the world's major peat producers in descending order of production in 2021, according to estimates.
- Due to increased peat usage in recent years, the European market has seen significant expansion in the worldwide peat market. In this location, peat is mostly utilized in agriculture to generate fiber crops and other products. During the projected period, rising disposable income from the agriculture sector, particularly from the United Kingdom, Germany, and Italy, is expected to contribute to market growth. The presence of a high number of peatlands in various nations across the continent, particularly in the British Isles and Scandinavia, as well as an increase in the use of peat as a fuel in Scotland, Ireland, and Finland, which are among the world's top peat consumers. According to the United Kingdom Office for National Statistics, peatlands account for 12% of total UK land area in 2019, with Scotland accounting for 60% of peatland with 1,947,750 hectares of peatland.
- Over the evaluation period, Asia-Pacific is predicted to be the fastest-growing market. The surge in demand for energy, aided by fast urbanization and an ever-increasing population, is the key driver driving market expansion in the region.
- Due to the availability of excellent climate conditions that allow the growth of tropical peat in countries including Brazil, Peru, Argentina, Colombia, and Venezuela, the Latin American market is expected to rise significantly during the forecast period.
- Due to the economic slump and low demand as a result of a lack of awareness, the Middle East and Africa are expected to expand slowly.
Key Players of the Peat Market
- Bord na Mona (Ireland)
- Premier Tech (Canada)
- CoCo Green (Pvt.) Ltd. (Sri Lanka)
- PEAT LAND UKRAINE LLC (Ukraine)
- Dutch Plantin B.V. (Netherland)
- Globalcoirs (Canada)
- Elva E.P.T. Ltd. (Estonia)
- Oulun Energia Oy (Finland)
- Global Peat Ltd. (Lativa)
- Jiffy International AS (Netherland)
- Klasmann-Deilmann GmbH (Germany)
- Lambert (US)
- Neova AB (Sweden)
- Stender AG (Germany)
- Neova Oy (Finland)
- Sun Gro Horticulture (US)
- T&J Enterprises (US)
- Tootsi Turvas (Estonia)
- Turveruukki Oy (Finland)
- Vapo Oy (Finland) and other major players.
Key Industry Development in the Peat Market
- In May 2021, by investing in renewable energy and service infrastructure, Neova hopes to increase profitability over time. The plan focuses on digitizing energy services and developing new peat-based goods.
|
Peat Market |
|||
|
Base Year: |
2023 |
Forecast Period: |
2024-2032 |
|
Historical Data: |
2017 to 2023 |
Market Size in 2023: |
USD 8.57 Mn. |
|
Forecast Period 2024-32 CAGR: |
15.36% |
Market Size in 2032: |
USD 31.01 Mn. |
|
Segments Covered: |
By Type |
|
|
|
By Material |
|
||
|
By Application |
|
||
|
By Region |
|
||
|
Key Market Drivers: |
|
||
|
Key Market Restraints: |
|
||
|
Key Opportunities: |
|
||
|
Companies Covered in the report: |
|
||
Chapter 1: Introduction
1.1 Scope and Coverage
Chapter 2:Executive Summary
Chapter 3: Market Landscape
3.1 Market Dynamics
3.1.1 Drivers
3.1.2 Restraints
3.1.3 Opportunities
3.1.4 Challenges
3.2 Market Trend Analysis
3.3 PESTLE Analysis
3.4 Porter's Five Forces Analysis
3.5 Industry Value Chain Analysis
3.6 Ecosystem
3.7 Regulatory Landscape
3.8 Price Trend Analysis
3.9 Patent Analysis
3.10 Technology Evolution
3.11 Investment Pockets
3.12 Import-Export Analysis
Chapter 4: Peat Market by Type (2018-2032)
4.1 Peat Market Snapshot and Growth Engine
4.2 Market Overview
4.3 Coco Peat
4.3.1 Introduction and Market Overview
4.3.2 Historic and Forecasted Market Size in Value USD and Volume Units
4.3.3 Key Market Trends, Growth Factors, and Opportunities
4.3.4 Geographic Segmentation Analysis
4.4 Sod Peat
4.5 Other
Chapter 5: Peat Market by Material (2018-2032)
5.1 Peat Market Snapshot and Growth Engine
5.2 Market Overview
5.3 Fabric
5.3.1 Introduction and Market Overview
5.3.2 Historic and Forecasted Market Size in Value USD and Volume Units
5.3.3 Key Market Trends, Growth Factors, and Opportunities
5.3.4 Geographic Segmentation Analysis
5.4 Hemic
5.5 Sapric
5.6 Others
Chapter 6: Peat Market by Application (2018-2032)
6.1 Peat Market Snapshot and Growth Engine
6.2 Market Overview
6.3 Agriculture
6.3.1 Introduction and Market Overview
6.3.2 Historic and Forecasted Market Size in Value USD and Volume Units
6.3.3 Key Market Trends, Growth Factors, and Opportunities
6.3.4 Geographic Segmentation Analysis
6.4 Domestic
6.5 Fuel & Energy
6.6 Medicine
6.7 Others
Chapter 7: Company Profiles and Competitive Analysis
7.1 Competitive Landscape
7.1.1 Competitive Benchmarking
7.1.2 Peat Market Share by Manufacturer (2024)
7.1.3 Industry BCG Matrix
7.1.4 Heat Map Analysis
7.1.5 Mergers and Acquisitions
7.2 ALLY FINANCIAL
7.2.1 Company Overview
7.2.2 Key Executives
7.2.3 Company Snapshot
7.2.4 Role of the Company in the Market
7.2.5 Sustainability and Social Responsibility
7.2.6 Operating Business Segments
7.2.7 Product Portfolio
7.2.8 Business Performance
7.2.9 Key Strategic Moves and Recent Developments
7.2.10 SWOT Analysis
7.3 BANK OF AMERICA
7.4 CAPITAL ONE
7.5 CHASE AUTO FINANCE
7.6 DAIMLER FINANCIAL SERVICES
7.7 FORD MOTOR CREDIT COMPANY
7.8 GM FINANCIAL INC
7.9 HITACHI CAPITAL
7.10 TOYOTA FINANCIAL SERVICES
7.11 VOLKSWAGEN FINANCIAL SERVICES
Chapter 8: Global Peat Market By Region
8.1 Overview
8.2. North America Peat Market
8.2.1 Key Market Trends, Growth Factors and Opportunities
8.2.2 Top Key Companies
8.2.3 Historic and Forecasted Market Size by Segments
8.2.4 Historic and Forecasted Market Size by Type
8.2.4.1 Coco Peat
8.2.4.2 Sod Peat
8.2.4.3 Other
8.2.5 Historic and Forecasted Market Size by Material
8.2.5.1 Fabric
8.2.5.2 Hemic
8.2.5.3 Sapric
8.2.5.4 Others
8.2.6 Historic and Forecasted Market Size by Application
8.2.6.1 Agriculture
8.2.6.2 Domestic
8.2.6.3 Fuel & Energy
8.2.6.4 Medicine
8.2.6.5 Others
8.2.7 Historic and Forecast Market Size by Country
8.2.7.1 US
8.2.7.2 Canada
8.2.7.3 Mexico
8.3. Eastern Europe Peat Market
8.3.1 Key Market Trends, Growth Factors and Opportunities
8.3.2 Top Key Companies
8.3.3 Historic and Forecasted Market Size by Segments
8.3.4 Historic and Forecasted Market Size by Type
8.3.4.1 Coco Peat
8.3.4.2 Sod Peat
8.3.4.3 Other
8.3.5 Historic and Forecasted Market Size by Material
8.3.5.1 Fabric
8.3.5.2 Hemic
8.3.5.3 Sapric
8.3.5.4 Others
8.3.6 Historic and Forecasted Market Size by Application
8.3.6.1 Agriculture
8.3.6.2 Domestic
8.3.6.3 Fuel & Energy
8.3.6.4 Medicine
8.3.6.5 Others
8.3.7 Historic and Forecast Market Size by Country
8.3.7.1 Russia
8.3.7.2 Bulgaria
8.3.7.3 The Czech Republic
8.3.7.4 Hungary
8.3.7.5 Poland
8.3.7.6 Romania
8.3.7.7 Rest of Eastern Europe
8.4. Western Europe Peat Market
8.4.1 Key Market Trends, Growth Factors and Opportunities
8.4.2 Top Key Companies
8.4.3 Historic and Forecasted Market Size by Segments
8.4.4 Historic and Forecasted Market Size by Type
8.4.4.1 Coco Peat
8.4.4.2 Sod Peat
8.4.4.3 Other
8.4.5 Historic and Forecasted Market Size by Material
8.4.5.1 Fabric
8.4.5.2 Hemic
8.4.5.3 Sapric
8.4.5.4 Others
8.4.6 Historic and Forecasted Market Size by Application
8.4.6.1 Agriculture
8.4.6.2 Domestic
8.4.6.3 Fuel & Energy
8.4.6.4 Medicine
8.4.6.5 Others
8.4.7 Historic and Forecast Market Size by Country
8.4.7.1 Germany
8.4.7.2 UK
8.4.7.3 France
8.4.7.4 The Netherlands
8.4.7.5 Italy
8.4.7.6 Spain
8.4.7.7 Rest of Western Europe
8.5. Asia Pacific Peat Market
8.5.1 Key Market Trends, Growth Factors and Opportunities
8.5.2 Top Key Companies
8.5.3 Historic and Forecasted Market Size by Segments
8.5.4 Historic and Forecasted Market Size by Type
8.5.4.1 Coco Peat
8.5.4.2 Sod Peat
8.5.4.3 Other
8.5.5 Historic and Forecasted Market Size by Material
8.5.5.1 Fabric
8.5.5.2 Hemic
8.5.5.3 Sapric
8.5.5.4 Others
8.5.6 Historic and Forecasted Market Size by Application
8.5.6.1 Agriculture
8.5.6.2 Domestic
8.5.6.3 Fuel & Energy
8.5.6.4 Medicine
8.5.6.5 Others
8.5.7 Historic and Forecast Market Size by Country
8.5.7.1 China
8.5.7.2 India
8.5.7.3 Japan
8.5.7.4 South Korea
8.5.7.5 Malaysia
8.5.7.6 Thailand
8.5.7.7 Vietnam
8.5.7.8 The Philippines
8.5.7.9 Australia
8.5.7.10 New Zealand
8.5.7.11 Rest of APAC
8.6. Middle East & Africa Peat Market
8.6.1 Key Market Trends, Growth Factors and Opportunities
8.6.2 Top Key Companies
8.6.3 Historic and Forecasted Market Size by Segments
8.6.4 Historic and Forecasted Market Size by Type
8.6.4.1 Coco Peat
8.6.4.2 Sod Peat
8.6.4.3 Other
8.6.5 Historic and Forecasted Market Size by Material
8.6.5.1 Fabric
8.6.5.2 Hemic
8.6.5.3 Sapric
8.6.5.4 Others
8.6.6 Historic and Forecasted Market Size by Application
8.6.6.1 Agriculture
8.6.6.2 Domestic
8.6.6.3 Fuel & Energy
8.6.6.4 Medicine
8.6.6.5 Others
8.6.7 Historic and Forecast Market Size by Country
8.6.7.1 Turkiye
8.6.7.2 Bahrain
8.6.7.3 Kuwait
8.6.7.4 Saudi Arabia
8.6.7.5 Qatar
8.6.7.6 UAE
8.6.7.7 Israel
8.6.7.8 South Africa
8.7. South America Peat Market
8.7.1 Key Market Trends, Growth Factors and Opportunities
8.7.2 Top Key Companies
8.7.3 Historic and Forecasted Market Size by Segments
8.7.4 Historic and Forecasted Market Size by Type
8.7.4.1 Coco Peat
8.7.4.2 Sod Peat
8.7.4.3 Other
8.7.5 Historic and Forecasted Market Size by Material
8.7.5.1 Fabric
8.7.5.2 Hemic
8.7.5.3 Sapric
8.7.5.4 Others
8.7.6 Historic and Forecasted Market Size by Application
8.7.6.1 Agriculture
8.7.6.2 Domestic
8.7.6.3 Fuel & Energy
8.7.6.4 Medicine
8.7.6.5 Others
8.7.7 Historic and Forecast Market Size by Country
8.7.7.1 Brazil
8.7.7.2 Argentina
8.7.7.3 Rest of SA
Chapter 9 Analyst Viewpoint and Conclusion
9.1 Recommendations and Concluding Analysis
9.2 Potential Market Strategies
Chapter 10 Research Methodology
10.1 Research Process
10.2 Primary Research
10.3 Secondary Research
|
Peat Market |
|||
|
Base Year: |
2023 |
Forecast Period: |
2024-2032 |
|
Historical Data: |
2017 to 2023 |
Market Size in 2023: |
USD 8.57 Mn. |
|
Forecast Period 2024-32 CAGR: |
15.36% |
Market Size in 2032: |
USD 31.01 Mn. |
|
Segments Covered: |
By Type |
|
|
|
By Material |
|
||
|
By Application |
|
||
|
By Region |
|
||
|
Key Market Drivers: |
|
||
|
Key Market Restraints: |
|
||
|
Key Opportunities: |
|
||
|
Companies Covered in the report: |
|
||


