


Global Oncology Drugs Market Synopsis
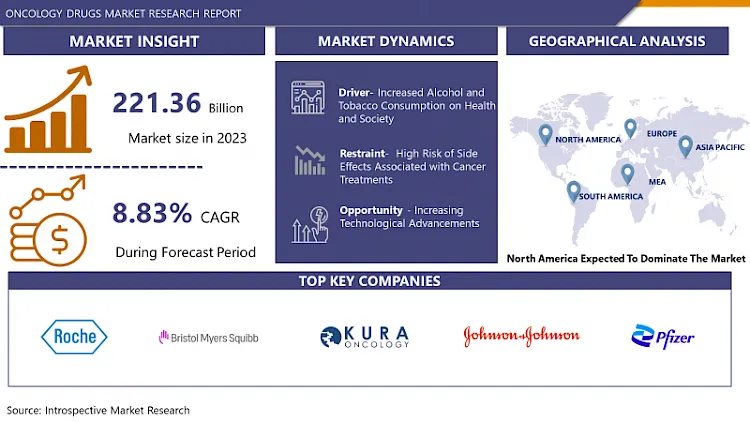
Global Oncology Drugs Market Size Was Valued at USD 221.36 Billion in 2023 and is Projected to Reach USD 474.06 Billion by 2032, Growing at a CAGR of 8.83% From 2024-2032.
Oncology is the branch of medicine that includes cancer prevention, diagnosis, treatment, and study. Cancer describes the irregular growth of cells that results in a huge mass known as a tumour.
Oncology drugs are therapeutics used to treat cancer, a group of diseases caused by uncontrolled growth and division of abnormal cells. Oncology drugs contain a range of different types of medicines, for instance, chemotherapy agents, targeted therapies, immunotherapies, and hormone therapies. Different types of drugs are also existing to support treat the side effects of oncology drugs.
An oncologist is a healthcare provider who specializes in diagnosing and treating cancer. Oncologists manage cancer treatment throughout the illness. Healthcare workers treat cancer using chemotherapy, hormonal therapies, immunotherapy, and other targeted treatments. People often think of the medical oncologist as their primary cancer specialist. Most medical oncologists also specify hematology.
Paediatric oncology is a vital medical field that treats pediatric cancer types, including serious lymphocytic leukemia, neuroblastoma, and brain and other central nervous system tumors. Treatment often changes from adult oncology. Pediatric oncology treatment may contain surgery, chemotherapy, radiation therapy, immunotherapy, and stem cell transplant.
Oncologists specialize in managing drug treatments for people with primary and advanced cancers that affect the tissues, muscles, bones, and connective tissue. Early-stage cancers may be treated with surgery or radiation therapy alone and may not essential the care of an oncologist.

Global Oncology Drugs Market Trend Analysis
Increased Alcohol and Tobacco Consumption on Health and Society
- Alcohol and tobacco use are related to several adverse health significances, including an increased risk of certain types of cancer. For instance, epidemiological studies initiate that alcohol drinking can increase the risk for cancers of the higher aerodigestive tract, stomach, large bowel, liver, and breast, with advanced levels of consumption leading to greater growth in risk.
- Cigarettes contain amounts of chemicals, with many known carcinogens. The carcinogenic role of cigarettes contrasts depending on the cigarette product. The chemical products of alcohol absorption are also explored to be toxic and assumed to cause DNA modifications that main to cancers.
- Alcohol increases the carcinogenic significance of tobacco. For example, it might increase the synthesis of specific enzymes that chance the chemical tobacco tar is created by burning tobacco into carcinogens.
- Every alcoholic drink covers ethanol. When consuming alcohol, the body breaks down the ethanol into acetaldehyde and other chemicals. Acetaldehyde damages DNA and stops bodies from restoring the damage. That damage over time may be responsible for cancer.
- Smoking causes cancer by damaging the DNA of private cells. When individuals inhale tobacco smoke into their lungs the smoke also touches the nose, mouth, voice box, throat, and gullet. The hazardous chemicals in tobacco smoke can also injury organs that are not in the route because they are absorbed into the circulation in the lungs.
Increasing Technological Advancements
- An increase in the rate of cancer rate worldwide combined with improved mortality in some of the malignancies endures poses a challenge to the biomedical scientific community for the actual administration of cancer. Prevention being a realistic prospect only in a few types of cancers, technological advancements in cancer diagnostics with accurate determination of location, size, stage, and molecular features, are immediately needed for cancer treatment, due to a worldwide increase in cancer-related mortality.
- The method for diagnosis as a part of the clinical management of cancer contains a physical inspection for irregularities in various anatomical locations and a battery of laboratory inquiries using blood and urine combined with a combination of radiologic and nuclear medicine-based non-invasive imaging modalities like electronic X-ray scan ultrasonography, magnetic resonance imaging (MRI), bone scan, positron emission tomography followed by minimally invasive biopsy or invasive (surgical) biopsy joined with histo-pathological inspection to found the identity and stage of the cancer.
- Cancer diagnosis is quickly evolving due to constant developments in knowledge of the disease and enhancements in technology that growth the feasibility of consistent diagnostic approaches. There are numerous cancer diagnostic modalities such as 2D and 3D imaging of tumors using positron emission tomography (PET), MRI, single photon emission computed tomography (SPECT), computed tomography (CT), X-ray imaging, and analysis of molecular (metabolic, proteomic, genomic, and transcriptomic) signatures of cancer cells, thus leveraging the cancer diagnosis and management.
Global Oncology Drugs Market Segment Analysis:
Global Oncology Drugs Market is Segmented on the basis of Diagnostics & Treatment, Treatment, Drugs Class, Dosage Form, Indication, Distribution Channel, And End-user.
By Diagnostics & Treatment, the Treatment segment is expected to dominate the market during the forecast period
- Cancer treatment for patients for many years which includes surgery, radiation therapy, and chemotherapy as only treatments in combination. But newly, many ways involved in cancer therapy progression and targeted enhanced intensely, with combinatorial strategies, connecting multiple targeted therapies or “traditional” chemotherapeutics, such as the taxanes and platinum compounds, originating to have a synergistic effect. such as drugs, biological molecules, and immune-mediated therapies, are being used for treatment even if the included therapy level has not stretched struggles the humanity rate and declines the prolonged survival time for metastatic cancer.
- The creation of a new uprising in neoplastic cancer or targeting drugs depends on the pathways and characteristics of diverse tumor objects. Chemotherapy is measured as the most effective and broadly used modality in treating cancers as used without help and in combination with radiotherapy. Genotoxicity is chemotherapy drugs target the tumor cells mostly making reactive oxygen species that largely abolish tumor cells.
- Chemotherapy drugs to destroy cancer cells. This specific cancer therapy, cancer cells are prohibited from increasing, dividing, and generating new cells. Numerous cancers can be treated by chemotherapy. Doctors may state chemotherapy as normal chemotherapy, conventional chemotherapy, or cytotoxic chemotherapy. The medication chemotherapy has an overall body-wide impact. This indicates that it circulates through the body via the circulation. Chemotherapy comes in a variety of forms.
By Application, the Lung Cancer segment held the largest share in 2023
- Lung cancer is one of the most common cancers and a huge number of people die of this disease each year. The disease is often exposed in a late stage, but also in previous stages lung cancer patients have inferior outcomes than patients with other cancers. Even without dispersion to other tissues, during stage I, the existence rate of lung cancer is under 70%. For instance, in breast cancer, there is 95% existence in the stage.
- Lung cancer is the unrestrained growing of irregular cells that starts in one or both lungs. These irregular cells do not transmit out the roles of normal lung cells and do not change into healthy lung tissue. The abnormal cells start to form tumors that inhibit the working of the lung.
- A diagnosis of lung cancer is serious, but treatments have enhanced extremely in recent years. People with lung cancer do improve if diagnosed with early-stage disease, so identifying lung cancer symptoms is significant. Lung cancer can frequently be present without indications, lung cancer screening is also an important tool to detect lung cancer initially in people who are at high risk.
Global Oncology Drugs Market Regional Insights:
North America is Expected to Dominate the Market Over the Forecast period
- North America has a developed healthcare system, which includes hospitals, specialized cancer centers, research institutions, and medical universities. The strong healthcare system in the area allows for effective identification, care, and control of a range of illnesses, such as cancer.
- North America spends a significant amount on healthcare, showing a strong focus on healthcare services and advancements. This investment in finances supports the growth and acceptance of new technologies, state-of-the-art therapies, and advanced treatment choices.
- The region is recognized for its significant contributions in oncology research, clinical trials, and drug development which give North America an upper hand in the market.
- The region has been an early adopter of technological advancements in the healthcare sector due to this North America has witnessed remarkable progress in precision medicine, genomic profiling, molecular diagnostics, imaging technologies, and targeted therapies.
Active Key Players in the Global Oncology Drugs Market
- Roche Holding AG (Switzerland)
- Bristol Myers Squibb (U.S.)
- Kura Oncology, Inc. (U.S.)
- Johnson & Johnson (U.S.)
- Pfizer Inc. (U.S.)
- AstraZeneca (U.K.)
- Merck & Co., Inc. (U.S.)
- Novartis AG (Switzerland)
- AbbVie Inc. (U.S.)
- Abbott Laboratorie (U.S.)
- Amgen Inc. (U.S.)
- Sanofi SA - France
- Bristol-Myers Squibb Company (U.S.)
- Gilead Sciences Inc (U.S.)
- Vertex Pharmaceuticals Inc. (U.S.)
- Regeneron Pharmaceuticals Inc. (U.S.)
- GSK plc. (U.K.)
- Daiichi Sankyo Company Ltd. Japan
- Takeda Pharmaceutical Company Ltd. (Japan)
- Moderna Inc (U.S.)
- Biogen Inc. (U.S.)
- BioNTech SE (Germany)
- Astellas Pharma Inc. (Japan)
- Illumina Inc. ((U.S.))
- Beigene Ltd. (China)
- Otsuka Pharmaceutical Ltd. (Japan)
- Incyte Corporation ((U.S.))
- Teva Pharmaceutical Industries Ltd. (Israel)
- Dr. Reddy’s Laboratories Limited (India)
- Jazz Pharmaceuticals plc (Ireland)
- Oncology Convergence, Inc ((U.S.))
- Oncology Systems Limited (U.K.)
- GenesisCare USA, Inc. ((U.S.))
- Integrated Oncology Centres (Hong Kong)
- Tennessee Oncology ((U.S.))
- Maryland Oncology Hematology ((U.S.))
- Minnesota Oncology ((U.S.))
- Arizona Oncology ((U.S.))
- Highlands Oncology ((U.S.))
- GenPath Oncology ((U.S.))
- HCG Manavata Oncology LLP (India)
- New York Oncology Hematology ((U.S.))
- McGill Oncology (Canada)
- NeoGenomics Laboratories, Inc. ((U.S.))
- Valley Health System ((U.S.))
- Jupiter Medical Center ((U.S.))
- GBMC HealthCare ((U.S.))
- Duly Health and Care ((U.S.))
- Alliance Healthcare Services, Inc. ((U.S.)) and other Active Players.
Key Industry Developments in the Global Oncology Drugs Market:
- In March 2024, Roche Pharma India launched Vabysmo, a medication for neovascular age-related macular degeneration and diabetic macular edema in India. The drug is cost-effective and collaborates with government and insurance companies for patient access. Vabysmo achieves global sales and offers durable treatment for retinal vision loss.
- In January 2024, BDR Pharmaceuticals has, in a global first, introduced the prostate cancer drug enzalutam
|
Global Oncology Market |
|||
|
Base Year: |
2023 |
Forecast Period: |
2024-2032 |
|
Historical Data: |
2017 to 2023 |
Market Size in 2023: |
USD 221.36 Bn. |
|
Forecast Period 2024-32 CAGR: |
8.83 % |
Market Size in 2032: |
USD 474.06 Bn. |
|
Segments Covered: |
By Diagnostics & Treatment |
|
|
|
By Drugs Class |
|
||
|
By Dosage Form |
|
||
|
By Indication |
|
||
|
By Distribution Channel |
|
||
|
By End-user |
|
||
|
By Region |
|
||
|
Key Market Drivers: |
|
||
|
Key Market Restraints: |
|
||
|
Key Opportunities: |
|
||
|
Companies Covered in the report: |
|
||
Chapter 1: Introduction
1.1 Scope and Coverage
Chapter 2:Executive Summary
Chapter 3: Market Landscape
3.1 Market Dynamics
3.1.1 Drivers
3.1.2 Restraints
3.1.3 Opportunities
3.1.4 Challenges
3.2 Market Trend Analysis
3.3 PESTLE Analysis
3.4 Porter's Five Forces Analysis
3.5 Industry Value Chain Analysis
3.6 Ecosystem
3.7 Regulatory Landscape
3.8 Price Trend Analysis
3.9 Patent Analysis
3.10 Technology Evolution
3.11 Investment Pockets
3.12 Import-Export Analysis
Chapter 4: Oncology Drugs Market by Diagnostics & Treatment (2018-2032)
4.1 Oncology Drugs Market Snapshot and Growth Engine
4.2 Market Overview
4.3 Diagnostics
4.3.1 Introduction and Market Overview
4.3.2 Historic and Forecasted Market Size in Value USD and Volume Units
4.3.3 Key Market Trends, Growth Factors, and Opportunities
4.3.4 Geographic Segmentation Analysis
4.4 Biopsy
4.5 Imaging
4.6 Immunohistochemistry
4.7 Tumour Biomarkers Test
4.8 In Situ Hybridization
4.9 Liquid Biopsy
4.10 Treatment
4.11 Targeted Therapy
4.12 Chemotherapy
4.13 Hormonal Therapy
4.14 Immunotherapy
Chapter 5: Oncology Drugs Market by Drugs Class (2018-2032)
5.1 Oncology Drugs Market Snapshot and Growth Engine
5.2 Market Overview
5.3 Cytotoxic Drugs
5.3.1 Introduction and Market Overview
5.3.2 Historic and Forecasted Market Size in Value USD and Volume Units
5.3.3 Key Market Trends, Growth Factors, and Opportunities
5.3.4 Geographic Segmentation Analysis
5.4 Targeted Drugs
5.5 Hormonal Drugs
5.6 Immunomodulatory Drugs
Chapter 6: Oncology Drugs Market by Dosage Form (2018-2032)
6.1 Oncology Drugs Market Snapshot and Growth Engine
6.2 Market Overview
6.3 Solid
6.3.1 Introduction and Market Overview
6.3.2 Historic and Forecasted Market Size in Value USD and Volume Units
6.3.3 Key Market Trends, Growth Factors, and Opportunities
6.3.4 Geographic Segmentation Analysis
6.4 Liquid
6.5 Injectable
Chapter 7: Oncology Drugs Market by Indication (2018-2032)
7.1 Oncology Drugs Market Snapshot and Growth Engine
7.2 Market Overview
7.3 Lungs Cancer
7.3.1 Introduction and Market Overview
7.3.2 Historic and Forecasted Market Size in Value USD and Volume Units
7.3.3 Key Market Trends, Growth Factors, and Opportunities
7.3.4 Geographic Segmentation Analysis
7.4 Colorectal Cancer
7.5 Breast Cancer
7.6 Liver Cancer
7.7 Bladder Cancer
7.8 Others (Head & Neck Cancer
7.9 Prostate Cancer
7.10 Thyroid Cancer)
Chapter 8: Oncology Drugs Market by Distribution Channel (2018-2032)
8.1 Oncology Drugs Market Snapshot and Growth Engine
8.2 Market Overview
8.3 Hospital Pharmacies
8.3.1 Introduction and Market Overview
8.3.2 Historic and Forecasted Market Size in Value USD and Volume Units
8.3.3 Key Market Trends, Growth Factors, and Opportunities
8.3.4 Geographic Segmentation Analysis
8.4 Retail Pharmacies
8.5 Online Pharmacies
Chapter 9: Oncology Drugs Market by End-user (2018-2032)
9.1 Oncology Drugs Market Snapshot and Growth Engine
9.2 Market Overview
9.3 Hospitals
9.3.1 Introduction and Market Overview
9.3.2 Historic and Forecasted Market Size in Value USD and Volume Units
9.3.3 Key Market Trends, Growth Factors, and Opportunities
9.3.4 Geographic Segmentation Analysis
9.4 Diagnostic Laboratories
9.5 Diagnostic Imaging Centres
9.6 Academia
9.7 Specialty Clinics
Chapter 10: Company Profiles and Competitive Analysis
10.1 Competitive Landscape
10.1.1 Competitive Benchmarking
10.1.2 Oncology Drugs Market Share by Manufacturer (2024)
10.1.3 Industry BCG Matrix
10.1.4 Heat Map Analysis
10.1.5 Mergers and Acquisitions
10.2 ACTIVISION BLIZZARD INCALIPAY
10.2.1 Company Overview
10.2.2 Key Executives
10.2.3 Company Snapshot
10.2.4 Role of the Company in the Market
10.2.5 Sustainability and Social Responsibility
10.2.6 Operating Business Segments
10.2.7 Product Portfolio
10.2.8 Business Performance
10.2.9 Key Strategic Moves and Recent Developments
10.2.10 SWOT Analysis
10.3 BOKU
10.4 ENTERCASH
10.5 SECURIONPAY
10.6 WORLDPAY
10.7 XSOLLA
10.8 NCSOFT
10.9 RIOT GAMES INCNEXON CO. LTDSMILEGATE (CROSSFIRE)
10.10 WARGAMING.NET
10.11 NETEASE INCVALVE CORPORATION
10.12 EPAY
10.13 FAMEHYPE AND OTHERS
Chapter 11: Global Oncology Drugs Market By Region
11.1 Overview
11.2. North America Oncology Drugs Market
11.2.1 Key Market Trends, Growth Factors and Opportunities
11.2.2 Top Key Companies
11.2.3 Historic and Forecasted Market Size by Segments
11.2.4 Historic and Forecasted Market Size by Diagnostics & Treatment
11.2.4.1 Diagnostics
11.2.4.2 Biopsy
11.2.4.3 Imaging
11.2.4.4 Immunohistochemistry
11.2.4.5 Tumour Biomarkers Test
11.2.4.6 In Situ Hybridization
11.2.4.7 Liquid Biopsy
11.2.4.8 Treatment
11.2.4.9 Targeted Therapy
11.2.4.10 Chemotherapy
11.2.4.11 Hormonal Therapy
11.2.4.12 Immunotherapy
11.2.5 Historic and Forecasted Market Size by Drugs Class
11.2.5.1 Cytotoxic Drugs
11.2.5.2 Targeted Drugs
11.2.5.3 Hormonal Drugs
11.2.5.4 Immunomodulatory Drugs
11.2.6 Historic and Forecasted Market Size by Dosage Form
11.2.6.1 Solid
11.2.6.2 Liquid
11.2.6.3 Injectable
11.2.7 Historic and Forecasted Market Size by Indication
11.2.7.1 Lungs Cancer
11.2.7.2 Colorectal Cancer
11.2.7.3 Breast Cancer
11.2.7.4 Liver Cancer
11.2.7.5 Bladder Cancer
11.2.7.6 Others (Head & Neck Cancer
11.2.7.7 Prostate Cancer
11.2.7.8 Thyroid Cancer)
11.2.8 Historic and Forecasted Market Size by Distribution Channel
11.2.8.1 Hospital Pharmacies
11.2.8.2 Retail Pharmacies
11.2.8.3 Online Pharmacies
11.2.9 Historic and Forecasted Market Size by End-user
11.2.9.1 Hospitals
11.2.9.2 Diagnostic Laboratories
11.2.9.3 Diagnostic Imaging Centres
11.2.9.4 Academia
11.2.9.5 Specialty Clinics
11.2.10 Historic and Forecast Market Size by Country
11.2.10.1 US
11.2.10.2 Canada
11.2.10.3 Mexico
11.3. Eastern Europe Oncology Drugs Market
11.3.1 Key Market Trends, Growth Factors and Opportunities
11.3.2 Top Key Companies
11.3.3 Historic and Forecasted Market Size by Segments
11.3.4 Historic and Forecasted Market Size by Diagnostics & Treatment
11.3.4.1 Diagnostics
11.3.4.2 Biopsy
11.3.4.3 Imaging
11.3.4.4 Immunohistochemistry
11.3.4.5 Tumour Biomarkers Test
11.3.4.6 In Situ Hybridization
11.3.4.7 Liquid Biopsy
11.3.4.8 Treatment
11.3.4.9 Targeted Therapy
11.3.4.10 Chemotherapy
11.3.4.11 Hormonal Therapy
11.3.4.12 Immunotherapy
11.3.5 Historic and Forecasted Market Size by Drugs Class
11.3.5.1 Cytotoxic Drugs
11.3.5.2 Targeted Drugs
11.3.5.3 Hormonal Drugs
11.3.5.4 Immunomodulatory Drugs
11.3.6 Historic and Forecasted Market Size by Dosage Form
11.3.6.1 Solid
11.3.6.2 Liquid
11.3.6.3 Injectable
11.3.7 Historic and Forecasted Market Size by Indication
11.3.7.1 Lungs Cancer
11.3.7.2 Colorectal Cancer
11.3.7.3 Breast Cancer
11.3.7.4 Liver Cancer
11.3.7.5 Bladder Cancer
11.3.7.6 Others (Head & Neck Cancer
11.3.7.7 Prostate Cancer
11.3.7.8 Thyroid Cancer)
11.3.8 Historic and Forecasted Market Size by Distribution Channel
11.3.8.1 Hospital Pharmacies
11.3.8.2 Retail Pharmacies
11.3.8.3 Online Pharmacies
11.3.9 Historic and Forecasted Market Size by End-user
11.3.9.1 Hospitals
11.3.9.2 Diagnostic Laboratories
11.3.9.3 Diagnostic Imaging Centres
11.3.9.4 Academia
11.3.9.5 Specialty Clinics
11.3.10 Historic and Forecast Market Size by Country
11.3.10.1 Russia
11.3.10.2 Bulgaria
11.3.10.3 The Czech Republic
11.3.10.4 Hungary
11.3.10.5 Poland
11.3.10.6 Romania
11.3.10.7 Rest of Eastern Europe
11.4. Western Europe Oncology Drugs Market
11.4.1 Key Market Trends, Growth Factors and Opportunities
11.4.2 Top Key Companies
11.4.3 Historic and Forecasted Market Size by Segments
11.4.4 Historic and Forecasted Market Size by Diagnostics & Treatment
11.4.4.1 Diagnostics
11.4.4.2 Biopsy
11.4.4.3 Imaging
11.4.4.4 Immunohistochemistry
11.4.4.5 Tumour Biomarkers Test
11.4.4.6 In Situ Hybridization
11.4.4.7 Liquid Biopsy
11.4.4.8 Treatment
11.4.4.9 Targeted Therapy
11.4.4.10 Chemotherapy
11.4.4.11 Hormonal Therapy
11.4.4.12 Immunotherapy
11.4.5 Historic and Forecasted Market Size by Drugs Class
11.4.5.1 Cytotoxic Drugs
11.4.5.2 Targeted Drugs
11.4.5.3 Hormonal Drugs
11.4.5.4 Immunomodulatory Drugs
11.4.6 Historic and Forecasted Market Size by Dosage Form
11.4.6.1 Solid
11.4.6.2 Liquid
11.4.6.3 Injectable
11.4.7 Historic and Forecasted Market Size by Indication
11.4.7.1 Lungs Cancer
11.4.7.2 Colorectal Cancer
11.4.7.3 Breast Cancer
11.4.7.4 Liver Cancer
11.4.7.5 Bladder Cancer
11.4.7.6 Others (Head & Neck Cancer
11.4.7.7 Prostate Cancer
11.4.7.8 Thyroid Cancer)
11.4.8 Historic and Forecasted Market Size by Distribution Channel
11.4.8.1 Hospital Pharmacies
11.4.8.2 Retail Pharmacies
11.4.8.3 Online Pharmacies
11.4.9 Historic and Forecasted Market Size by End-user
11.4.9.1 Hospitals
11.4.9.2 Diagnostic Laboratories
11.4.9.3 Diagnostic Imaging Centres
11.4.9.4 Academia
11.4.9.5 Specialty Clinics
11.4.10 Historic and Forecast Market Size by Country
11.4.10.1 Germany
11.4.10.2 UK
11.4.10.3 France
11.4.10.4 The Netherlands
11.4.10.5 Italy
11.4.10.6 Spain
11.4.10.7 Rest of Western Europe
11.5. Asia Pacific Oncology Drugs Market
11.5.1 Key Market Trends, Growth Factors and Opportunities
11.5.2 Top Key Companies
11.5.3 Historic and Forecasted Market Size by Segments
11.5.4 Historic and Forecasted Market Size by Diagnostics & Treatment
11.5.4.1 Diagnostics
11.5.4.2 Biopsy
11.5.4.3 Imaging
11.5.4.4 Immunohistochemistry
11.5.4.5 Tumour Biomarkers Test
11.5.4.6 In Situ Hybridization
11.5.4.7 Liquid Biopsy
11.5.4.8 Treatment
11.5.4.9 Targeted Therapy
11.5.4.10 Chemotherapy
11.5.4.11 Hormonal Therapy
11.5.4.12 Immunotherapy
11.5.5 Historic and Forecasted Market Size by Drugs Class
11.5.5.1 Cytotoxic Drugs
11.5.5.2 Targeted Drugs
11.5.5.3 Hormonal Drugs
11.5.5.4 Immunomodulatory Drugs
11.5.6 Historic and Forecasted Market Size by Dosage Form
11.5.6.1 Solid
11.5.6.2 Liquid
11.5.6.3 Injectable
11.5.7 Historic and Forecasted Market Size by Indication
11.5.7.1 Lungs Cancer
11.5.7.2 Colorectal Cancer
11.5.7.3 Breast Cancer
11.5.7.4 Liver Cancer
11.5.7.5 Bladder Cancer
11.5.7.6 Others (Head & Neck Cancer
11.5.7.7 Prostate Cancer
11.5.7.8 Thyroid Cancer)
11.5.8 Historic and Forecasted Market Size by Distribution Channel
11.5.8.1 Hospital Pharmacies
11.5.8.2 Retail Pharmacies
11.5.8.3 Online Pharmacies
11.5.9 Historic and Forecasted Market Size by End-user
11.5.9.1 Hospitals
11.5.9.2 Diagnostic Laboratories
11.5.9.3 Diagnostic Imaging Centres
11.5.9.4 Academia
11.5.9.5 Specialty Clinics
11.5.10 Historic and Forecast Market Size by Country
11.5.10.1 China
11.5.10.2 India
11.5.10.3 Japan
11.5.10.4 South Korea
11.5.10.5 Malaysia
11.5.10.6 Thailand
11.5.10.7 Vietnam
11.5.10.8 The Philippines
11.5.10.9 Australia
11.5.10.10 New Zealand
11.5.10.11 Rest of APAC
11.6. Middle East & Africa Oncology Drugs Market
11.6.1 Key Market Trends, Growth Factors and Opportunities
11.6.2 Top Key Companies
11.6.3 Historic and Forecasted Market Size by Segments
11.6.4 Historic and Forecasted Market Size by Diagnostics & Treatment
11.6.4.1 Diagnostics
11.6.4.2 Biopsy
11.6.4.3 Imaging
11.6.4.4 Immunohistochemistry
11.6.4.5 Tumour Biomarkers Test
11.6.4.6 In Situ Hybridization
11.6.4.7 Liquid Biopsy
11.6.4.8 Treatment
11.6.4.9 Targeted Therapy
11.6.4.10 Chemotherapy
11.6.4.11 Hormonal Therapy
11.6.4.12 Immunotherapy
11.6.5 Historic and Forecasted Market Size by Drugs Class
11.6.5.1 Cytotoxic Drugs
11.6.5.2 Targeted Drugs
11.6.5.3 Hormonal Drugs
11.6.5.4 Immunomodulatory Drugs
11.6.6 Historic and Forecasted Market Size by Dosage Form
11.6.6.1 Solid
11.6.6.2 Liquid
11.6.6.3 Injectable
11.6.7 Historic and Forecasted Market Size by Indication
11.6.7.1 Lungs Cancer
11.6.7.2 Colorectal Cancer
11.6.7.3 Breast Cancer
11.6.7.4 Liver Cancer
11.6.7.5 Bladder Cancer
11.6.7.6 Others (Head & Neck Cancer
11.6.7.7 Prostate Cancer
11.6.7.8 Thyroid Cancer)
11.6.8 Historic and Forecasted Market Size by Distribution Channel
11.6.8.1 Hospital Pharmacies
11.6.8.2 Retail Pharmacies
11.6.8.3 Online Pharmacies
11.6.9 Historic and Forecasted Market Size by End-user
11.6.9.1 Hospitals
11.6.9.2 Diagnostic Laboratories
11.6.9.3 Diagnostic Imaging Centres
11.6.9.4 Academia
11.6.9.5 Specialty Clinics
11.6.10 Historic and Forecast Market Size by Country
11.6.10.1 Turkiye
11.6.10.2 Bahrain
11.6.10.3 Kuwait
11.6.10.4 Saudi Arabia
11.6.10.5 Qatar
11.6.10.6 UAE
11.6.10.7 Israel
11.6.10.8 South Africa
11.7. South America Oncology Drugs Market
11.7.1 Key Market Trends, Growth Factors and Opportunities
11.7.2 Top Key Companies
11.7.3 Historic and Forecasted Market Size by Segments
11.7.4 Historic and Forecasted Market Size by Diagnostics & Treatment
11.7.4.1 Diagnostics
11.7.4.2 Biopsy
11.7.4.3 Imaging
11.7.4.4 Immunohistochemistry
11.7.4.5 Tumour Biomarkers Test
11.7.4.6 In Situ Hybridization
11.7.4.7 Liquid Biopsy
11.7.4.8 Treatment
11.7.4.9 Targeted Therapy
11.7.4.10 Chemotherapy
11.7.4.11 Hormonal Therapy
11.7.4.12 Immunotherapy
11.7.5 Historic and Forecasted Market Size by Drugs Class
11.7.5.1 Cytotoxic Drugs
11.7.5.2 Targeted Drugs
11.7.5.3 Hormonal Drugs
11.7.5.4 Immunomodulatory Drugs
11.7.6 Historic and Forecasted Market Size by Dosage Form
11.7.6.1 Solid
11.7.6.2 Liquid
11.7.6.3 Injectable
11.7.7 Historic and Forecasted Market Size by Indication
11.7.7.1 Lungs Cancer
11.7.7.2 Colorectal Cancer
11.7.7.3 Breast Cancer
11.7.7.4 Liver Cancer
11.7.7.5 Bladder Cancer
11.7.7.6 Others (Head & Neck Cancer
11.7.7.7 Prostate Cancer
11.7.7.8 Thyroid Cancer)
11.7.8 Historic and Forecasted Market Size by Distribution Channel
11.7.8.1 Hospital Pharmacies
11.7.8.2 Retail Pharmacies
11.7.8.3 Online Pharmacies
11.7.9 Historic and Forecasted Market Size by End-user
11.7.9.1 Hospitals
11.7.9.2 Diagnostic Laboratories
11.7.9.3 Diagnostic Imaging Centres
11.7.9.4 Academia
11.7.9.5 Specialty Clinics
11.7.10 Historic and Forecast Market Size by Country
11.7.10.1 Brazil
11.7.10.2 Argentina
11.7.10.3 Rest of SA
Chapter 12 Analyst Viewpoint and Conclusion
12.1 Recommendations and Concluding Analysis
12.2 Potential Market Strategies
Chapter 13 Research Methodology
13.1 Research Process
13.2 Primary Research
13.3 Secondary Research
|
Global Oncology Market |
|||
|
Base Year: |
2023 |
Forecast Period: |
2024-2032 |
|
Historical Data: |
2017 to 2023 |
Market Size in 2023: |
USD 221.36 Bn. |
|
Forecast Period 2024-32 CAGR: |
8.83 % |
Market Size in 2032: |
USD 474.06 Bn. |
|
Segments Covered: |
By Diagnostics & Treatment |
|
|
|
By Drugs Class |
|
||
|
By Dosage Form |
|
||
|
By Indication |
|
||
|
By Distribution Channel |
|
||
|
By End-user |
|
||
|
By Region |
|
||
|
Key Market Drivers: |
|
||
|
Key Market Restraints: |
|
||
|
Key Opportunities: |
|
||
|
Companies Covered in the report: |
|
||


