


Non-GMO Food Market Overview
The Non-GMO Food Market Was Valued at USD 2.3 Billion in 2023 and is Projected to Reach USD 7.66 Billion by 2032, Growing at a CAGR of 14.3% from 2024 to 2032.
Non-GMO foods are produced using natural or organic methods that avoid genetic engineering or biotechnological modifications. These products are gaining popularity as consumers become more health conscious and environmentally aware and seek transparency in food sourcing and production.
Key drivers for the growth of the Non-GMO Food Market include rising consumer concerns about the potential health risks of GMOs, increased demand for organic and natural products, and stricter regulatory standards on food labeling. Additionally, campaigns promoting sustainable agricultural practices and the environmental benefits of non-GMO farming are influencing market trends. Retailers and manufacturers are responding by expanding their non-GMO product lines, including snacks, beverages, dairy, and packaged foods.
The market is segmented by product type, distribution channel, and region. North America and Europe dominate the market, driven by stringent labeling laws and high consumer awareness. Asia-Pacific is emerging as a significant growth region, fueled by a growing middle class and increasing adoption of health-focused diets. Despite its growth, the market faces challenges such as higher production costs and limited consumer awareness in some regions. Nonetheless, innovations in non-GMO food production and a robust demand for clean-label products suggest a promising future for the non-GMO food Market.
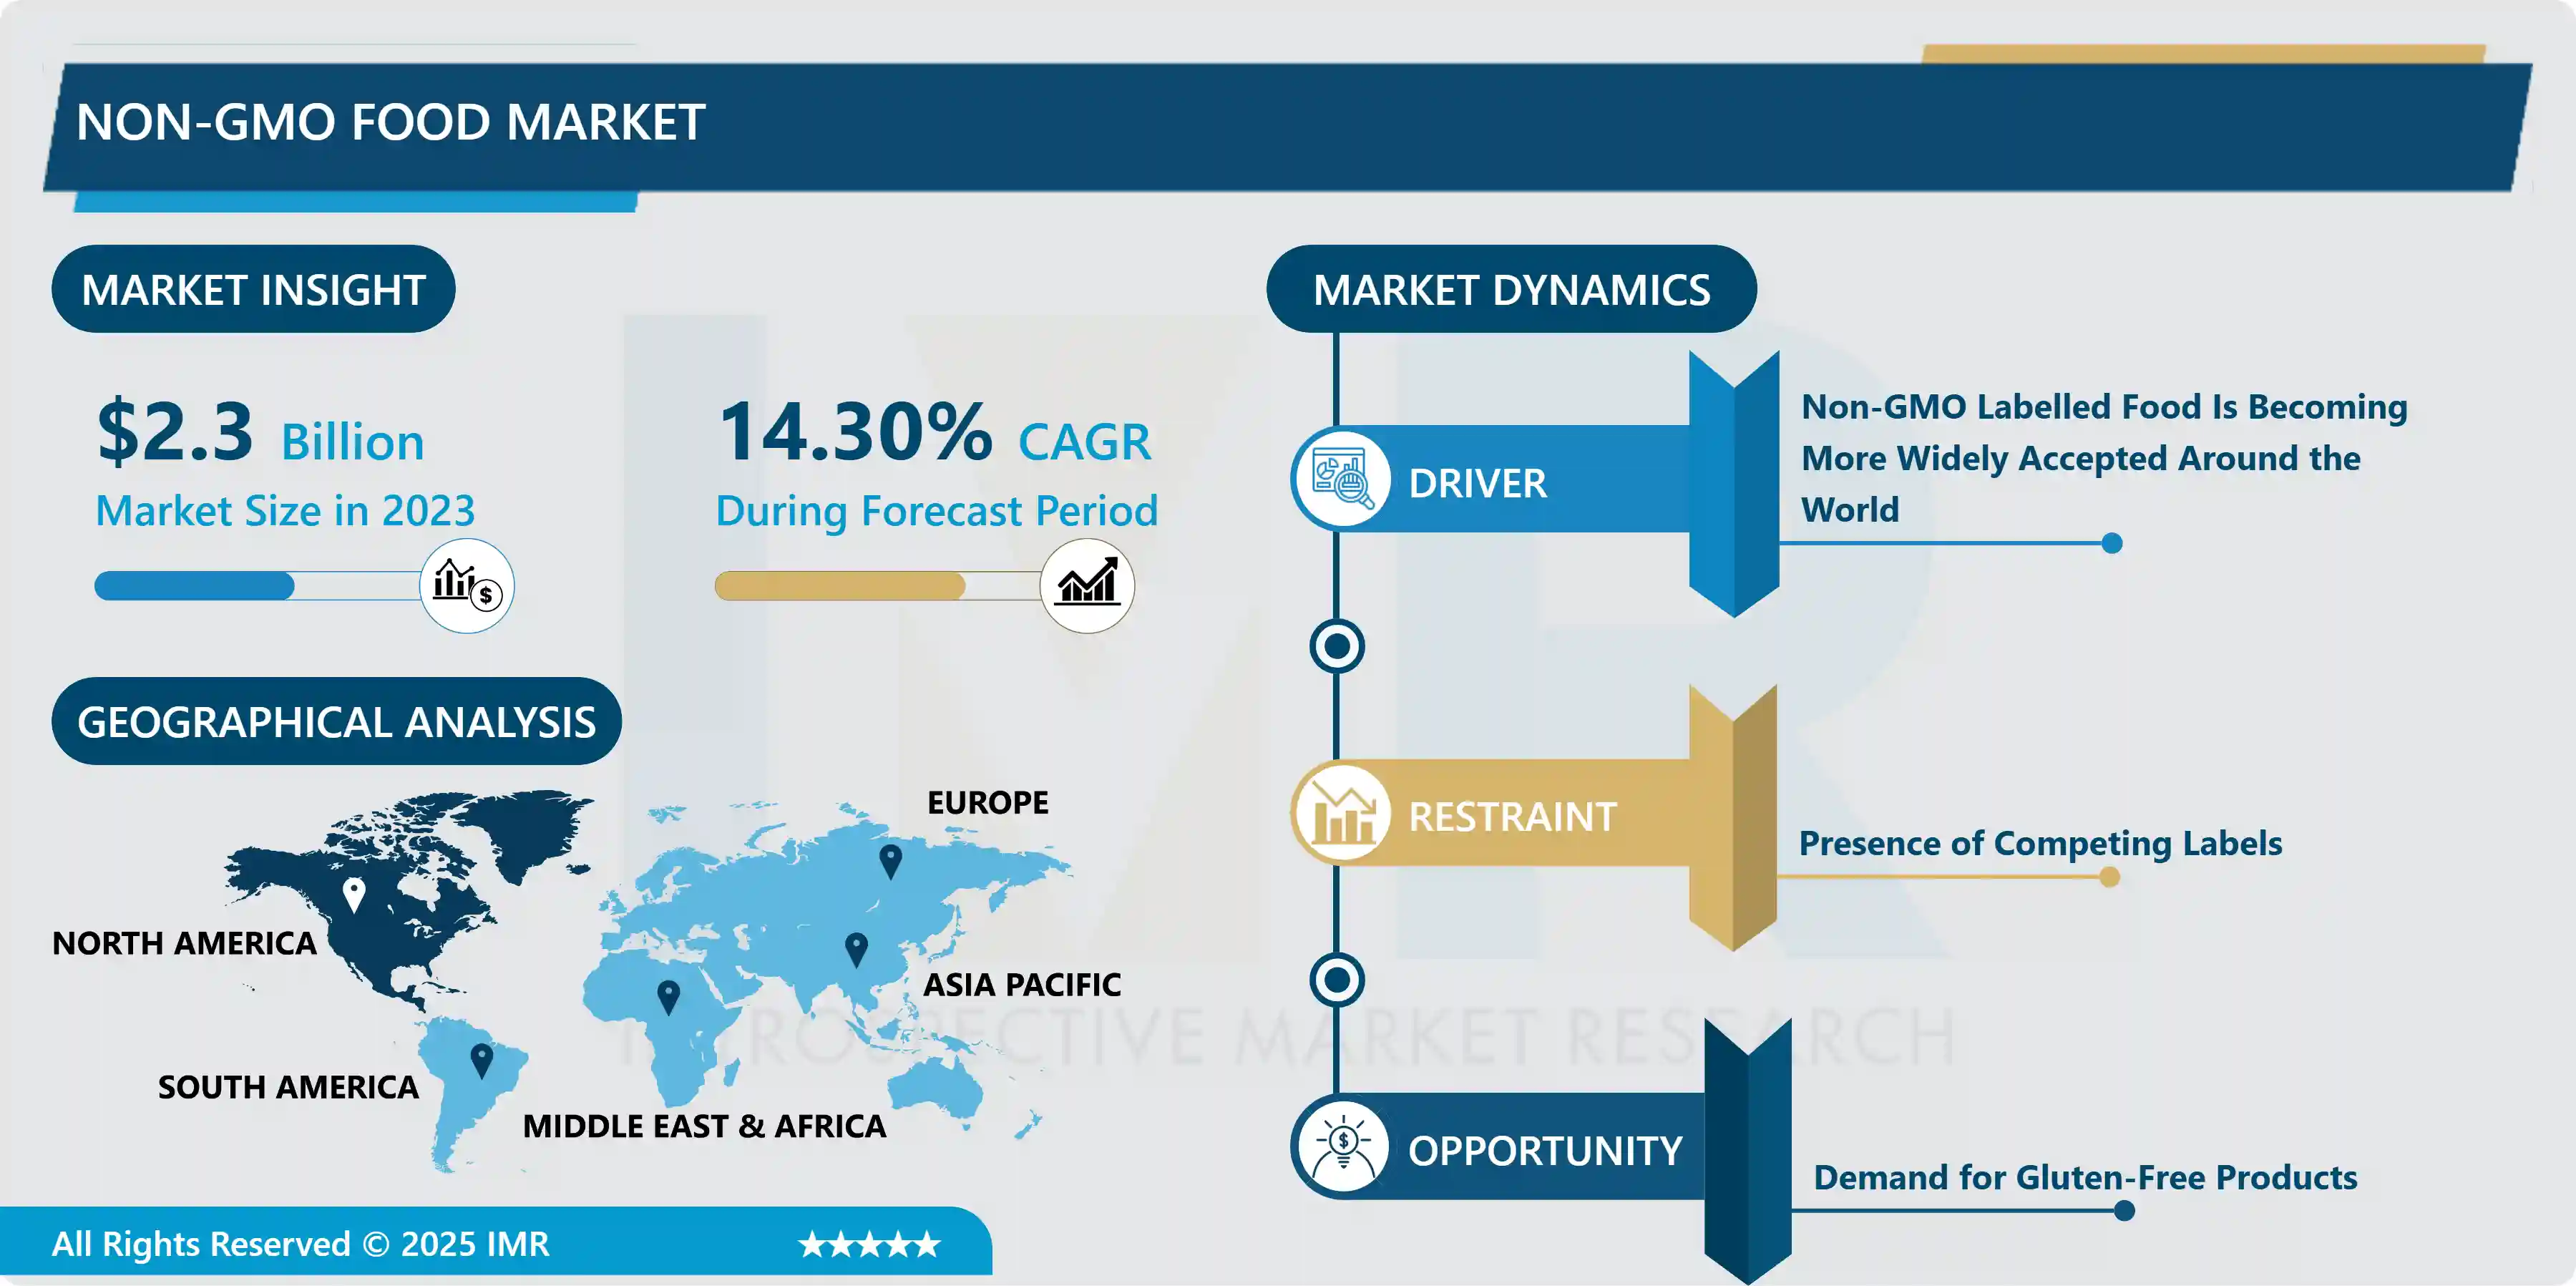

Market Dynamics And Factors For Non-GMO Food Market
Drivers:
Non-GMO Labelled Food Is Becoming More Widely Accepted Around The World
- The Non-GMO Market is rising due to the growing acceptability of Non-GMO labeled food around the world, as well as the growing popularity of Non-GMO food products among consumers. Furthermore, rising public health awareness and numerous government-sponsored health initiatives are expected to boost the Non-GMO food market's growth throughout the forecast period. "Today's consumers want more variety and transparency in their food," said Pam Stauffer, Cargill's global marketing programs manager in Minneapolis. "They want to be able to recognize ingredients, understand what they do in a product, and even know where they come from." This overall trend in consumer purchase decisions is reflected in customer interest in non-GMO products. "According to the 2018 Food and Health Survey conducted by the International Food Information Council (IFIC) Foundation, 40% of consumers believe that products manufactured with non-GMO ingredients are healthier than products made with GMO ingredients.
Restraints:
Presence of Competing Labels
- Although non-GMO is the most popular eco-label, the food and beverage industry has over 150 designations that represent sustainable/ethical features. Consumers now have a variety of options for purchasing food and beverages that are sustainable or healthy. Organic, natural, vegan, and free-from goods are competitors in terms of ethical designations. In the coming years, the presence of competing brands is projected to limit market expansion. Furthermore, manufacturers and sellers must be concerned about maintaining a consistent supply of non-GMO raw materials. Producers should take extra precautions to ensure that non-GMO components are available in sufficient amounts for product manufacture. Thus, the presence of competing labels hinders the market growth of the market over the forecast period.
Opportunities:
Demand for Gluten-Free Products
- The rise of the Non-GMO flour business has been aided by rising worries about gluten-free products. Gluten in flour has negative health consequences, including indigestion, intestinal damage, and recurrent diarrhea. The global Non-GMO flour market is being driven by consumer health consciousness and growing awareness of gluten-free products. Consumers in North America and Europe, in particular, are rejecting GMO flour in favor of Non-GMO flour, which is a current and emerging trend in this industry. As a result of this increased health awareness, non-GMO flour substitutes such as white rice flour, brown rice flour, maize flour, barley flour, and corn flour have become more popular. Non-GMO flour is a fast expanding food category, demonstrating that this market exhibits significant growth potential over the forecast period.
Market Segmentation
Segmentation Analysis of Non-GMO Food Market:
- By Distribution Channel, the hypermarkets & supermarkets segment is anticipated to hold a significant share in the market. As the demand for non-GMO goods and products grows, these stores are allocating more shelf space to non-GMO brands that appeal to health-conscious consumers. Additionally, they may provide home delivery and gifts to entice customers. These variables are expected to boost product sales at these establishments. In the future years, the online retail outlets market is expected to develop at a healthy CAGR. In recent years, the practice of purchasing food items via e-commerce has flourished all across the world. Customers, particularly those who live in more rural locations where some commodities are unavailable, cherish the convenience that e-commerce provides. With the help of the COVID-19 epidemic, which saw a substantial movement towards E-commerce, the online retail industry has evolved to become a new norm in the market. Amazon recently debuted its Amazon Fresh service, which seeks to make it easier to have fresh goods delivered quickly all around the world. Major e-commerce retailers' initiatives like these are anticipated to bolster the segment's growth.
- By Product, cereals & grains segment is anticipated to hold the non-GMO foods maximum market growth during the forecast period. The category is expected to be driven by rising demand for whole grain products as a source of fiber and carbs. GMO-free cereals are predicted to be the most widely consumed product. Due to increasing product demand around the world, the meat and poultry product segment is expected to increase at the fastest rate over the projection period. Due to the rising demand for healthy, organic bakery products, the bakery products segment is expected to increase significantly in the future years.
Regional Analysis of Non-GMO Food Market:
- North America region is anticipated to dominate the market over the forecast period. This is due to a rise in demand for non-GMO food products in this region, such as soybeans and non-alcoholic drinks, as well as increased awareness of the negative effects of GMO food intake, such as gastrointestinal issues, organ damage, cancer, and infertility. Furthermore, increased urbanization and changing people's lifestyles are also contributing to the market's growth in this region. Big grocery stores in the United States that show a personal interest in environmental and human health are more likely to stock these products, which will help the regional market flourish. Furthermore, the market is likely to be driven by strong and growing consumer awareness of health and environmental issues, including a growing resistance among customers to food products created with genetically modified organisms and GM farming.
- Europe region is observed significant growth of the market during the forecast period. In Europe, the non-GMO food and feed industry has grown into a significant market force with increasing demand. Non-GMO labeling is currently regulated voluntarily in Austria, the Czech Republic, France, Germany, Hungary, Italy, Poland, Slovenia, Switzerland, and Bosnia and Herzegovina. The number of Non-GMO items on the market is increasing in all segments, as is the total market volume of non-genetically modified food and feed. In 2020, German customers will have spent 12 billion euros on over 14,000 products bearing the non-GMO stamp, which is controlled by the German government. With approximately 3,800 items, the members of the Austrian association ARGE Gentechnik-Frei (platform for Non-GMO production) generate an estimated annual turnover of around 1.5 billion euros. In Germany, 60-70 percent of milk, chicken meat, and eggs are produced without genetically modified organisms. Since 2010, all milk and egg production in Austria has been "Non-GMO," as has all poultry production since 2012.
- Asia Pacific is a developing area in the market, with the greatest CAGR projected over the forecast period. While higher-income, better-educated people in Korea, Japan, and Australia are enthusiastic about the product, consumers in China and India are driving demand growth in the area. For example, the Government of India's Food Safety and Standards Authority of India (FSSAI) modified Section 22 of the Food Safety and Standards Act, 2006 on August 21, 2020, mandating that beginning January 1, 2021, specific food product imports (fruits, vegetables, and grains) into India identified in Annex-I must be accompanied by a certificate stating that the product is of non-GM origin and does not contain genetically modified organisms and also not genetically modified organisms.
Players Covered In Non-GMO Food Market are:
- Cargill
- Nestle S.A.
- The Kellogg Company
- Amy's Kitchen Inc.
- Blue Diamond Growers
- Organic Valley
- The Hain Celestial Group Inc.
- PepsiCo Inc.
- Pernod Ricard
- Clif Bar & Company
Key Industry Developments In Non-GMO Food Market
- In November 2023, Myna Snacks, a food product manufacturing company, introduced several new cookies and snacks products. The company’s newly launched Midnight Mini Cookie and other snack products are manufactured from non-GMO and gluten-free ingredients.
- In March 2022, AUM LifeTech, Inc. announced a DARPA-funded project with Colorado State University (CSU) to use AUM LifeTech's self-deliverable RNA Silencing FANA Antisense Oligonucleotides (FANA ASO) technology in a DARPA-funded project. The award of US$ 496,965 will be utilized to create non-GMO, non-viral RNA-targeting solutions for agricultural management advancements and improved disease and pest resistance. The Defense Advanced Research Projects Agency (DARPA) is a US Department of Defense research and development agency.
|
Non-GMO Food Market |
|||
|
Base Year: |
2023 |
Forecast Period: |
2024-2032 |
|
Historical Data: |
2017 to 2023 |
Market Size in 2023: |
USD 2.3 Bn. |
|
Forecast Period 2024-32 CAGR: |
14.3% |
Market Size in 2032: |
USD 7.66 Bn. |
|
Segments Covered: |
By Product |
|
|
|
By Distribution Channels |
|
||
|
By Region |
|
||
|
Key Market Drivers: |
|
||
|
Key Market Restraints: |
|
||
|
Key Opportunities: |
|
||
|
Companies Covered in the report: |
|
||
Chapter 1: Introduction
1.1 Scope and Coverage
Chapter 2:Executive Summary
Chapter 3: Market Landscape
3.1 Market Dynamics
3.1.1 Drivers
3.1.2 Restraints
3.1.3 Opportunities
3.1.4 Challenges
3.2 Market Trend Analysis
3.3 PESTLE Analysis
3.4 Porter's Five Forces Analysis
3.5 Industry Value Chain Analysis
3.6 Ecosystem
3.7 Regulatory Landscape
3.8 Price Trend Analysis
3.9 Patent Analysis
3.10 Technology Evolution
3.11 Investment Pockets
3.12 Import-Export Analysis
Chapter 4: Non-GMO Food Market by Product (2018-2032)
4.1 Non-GMO Food Market Snapshot and Growth Engine
4.2 Market Overview
4.3 Cereals & Grains
4.3.1 Introduction and Market Overview
4.3.2 Historic and Forecasted Market Size in Value USD and Volume Units
4.3.3 Key Market Trends, Growth Factors, and Opportunities
4.3.4 Geographic Segmentation Analysis
4.4 Meat & Poultry
4.5 Liquor
4.6 Edible Oil
4.7 Bakery
Chapter 5: Non-GMO Food Market by Distribution Channels (2018-2032)
5.1 Non-GMO Food Market Snapshot and Growth Engine
5.2 Market Overview
5.3 Hypermarkets & Supermarkets
5.3.1 Introduction and Market Overview
5.3.2 Historic and Forecasted Market Size in Value USD and Volume Units
5.3.3 Key Market Trends, Growth Factors, and Opportunities
5.3.4 Geographic Segmentation Analysis
5.4 Food Specialty Stores
5.5 Convenience Stores
5.6 Online
Chapter 6: Company Profiles and Competitive Analysis
6.1 Competitive Landscape
6.1.1 Competitive Benchmarking
6.1.2 Non-GMO Food Market Share by Manufacturer (2024)
6.1.3 Industry BCG Matrix
6.1.4 Heat Map Analysis
6.1.5 Mergers and Acquisitions
6.2 CARGILL (U.S.)
6.2.1 Company Overview
6.2.2 Key Executives
6.2.3 Company Snapshot
6.2.4 Role of the Company in the Market
6.2.5 Sustainability and Social Responsibility
6.2.6 Operating Business Segments
6.2.7 Product Portfolio
6.2.8 Business Performance
6.2.9 Key Strategic Moves and Recent Developments
6.2.10 SWOT Analysis
6.3 INGREDION INCORPORATED (U.S.)
6.4 ARCHER DANIELS MIDLAND COMPANY (U.S.)
6.5 ROQUETTE FRÈRES (FRANCE)
6.6 TATE & LYLE PLC (U.K.)
6.7 GRAIN PROCESSING CORPORATION (U.S.)
6.8 EMSLAND GROUP (GERMANY)
6.9 AVEBE (NETHERLANDS)
6.10 BENEO GMBH (GERMANY)
6.11 AGRANA GROUP (AUSTRIA)
6.12 PENFORD CORPORATION (U.S.)
6.13 SÜDSTÄRKE GMBH (GERMANY)
6.14 SMS CORPORATION (THAILAND)
6.15 GLOBAL BIO-CHEM TECHNOLOGY GROUP COMPANY LIMITED (HONG KONG)
6.16 THAI FLOUR INDUSTRY COLTD. (THAILAND)
6.17 AVEBE U.A. (NETHERLANDS)
6.18 KARANDIKARS CASHELL PRIVATE LIMITED (INDIA)
6.19 EVEREST STARCH (INDIA)
6.20 UNIVERSAL STARCH-CHEM ALLIED LTD. (INDIA)
6.21 TEREOS S.A. (FRANCE)
6.22 THE TEREOS GROUP (FRANCE)
6.23 BANPONG TAPIOCA FLOUR INDUSTRIAL COLTD. (THAILAND)
6.24 ADM CORN PROCESSING (U.S.)
Chapter 7: Global Non-GMO Food Market By Region
7.1 Overview
7.2. North America Non-GMO Food Market
7.2.1 Key Market Trends, Growth Factors and Opportunities
7.2.2 Top Key Companies
7.2.3 Historic and Forecasted Market Size by Segments
7.2.4 Historic and Forecasted Market Size by Product
7.2.4.1 Cereals & Grains
7.2.4.2 Meat & Poultry
7.2.4.3 Liquor
7.2.4.4 Edible Oil
7.2.4.5 Bakery
7.2.5 Historic and Forecasted Market Size by Distribution Channels
7.2.5.1 Hypermarkets & Supermarkets
7.2.5.2 Food Specialty Stores
7.2.5.3 Convenience Stores
7.2.5.4 Online
7.2.6 Historic and Forecast Market Size by Country
7.2.6.1 US
7.2.6.2 Canada
7.2.6.3 Mexico
7.3. Eastern Europe Non-GMO Food Market
7.3.1 Key Market Trends, Growth Factors and Opportunities
7.3.2 Top Key Companies
7.3.3 Historic and Forecasted Market Size by Segments
7.3.4 Historic and Forecasted Market Size by Product
7.3.4.1 Cereals & Grains
7.3.4.2 Meat & Poultry
7.3.4.3 Liquor
7.3.4.4 Edible Oil
7.3.4.5 Bakery
7.3.5 Historic and Forecasted Market Size by Distribution Channels
7.3.5.1 Hypermarkets & Supermarkets
7.3.5.2 Food Specialty Stores
7.3.5.3 Convenience Stores
7.3.5.4 Online
7.3.6 Historic and Forecast Market Size by Country
7.3.6.1 Russia
7.3.6.2 Bulgaria
7.3.6.3 The Czech Republic
7.3.6.4 Hungary
7.3.6.5 Poland
7.3.6.6 Romania
7.3.6.7 Rest of Eastern Europe
7.4. Western Europe Non-GMO Food Market
7.4.1 Key Market Trends, Growth Factors and Opportunities
7.4.2 Top Key Companies
7.4.3 Historic and Forecasted Market Size by Segments
7.4.4 Historic and Forecasted Market Size by Product
7.4.4.1 Cereals & Grains
7.4.4.2 Meat & Poultry
7.4.4.3 Liquor
7.4.4.4 Edible Oil
7.4.4.5 Bakery
7.4.5 Historic and Forecasted Market Size by Distribution Channels
7.4.5.1 Hypermarkets & Supermarkets
7.4.5.2 Food Specialty Stores
7.4.5.3 Convenience Stores
7.4.5.4 Online
7.4.6 Historic and Forecast Market Size by Country
7.4.6.1 Germany
7.4.6.2 UK
7.4.6.3 France
7.4.6.4 The Netherlands
7.4.6.5 Italy
7.4.6.6 Spain
7.4.6.7 Rest of Western Europe
7.5. Asia Pacific Non-GMO Food Market
7.5.1 Key Market Trends, Growth Factors and Opportunities
7.5.2 Top Key Companies
7.5.3 Historic and Forecasted Market Size by Segments
7.5.4 Historic and Forecasted Market Size by Product
7.5.4.1 Cereals & Grains
7.5.4.2 Meat & Poultry
7.5.4.3 Liquor
7.5.4.4 Edible Oil
7.5.4.5 Bakery
7.5.5 Historic and Forecasted Market Size by Distribution Channels
7.5.5.1 Hypermarkets & Supermarkets
7.5.5.2 Food Specialty Stores
7.5.5.3 Convenience Stores
7.5.5.4 Online
7.5.6 Historic and Forecast Market Size by Country
7.5.6.1 China
7.5.6.2 India
7.5.6.3 Japan
7.5.6.4 South Korea
7.5.6.5 Malaysia
7.5.6.6 Thailand
7.5.6.7 Vietnam
7.5.6.8 The Philippines
7.5.6.9 Australia
7.5.6.10 New Zealand
7.5.6.11 Rest of APAC
7.6. Middle East & Africa Non-GMO Food Market
7.6.1 Key Market Trends, Growth Factors and Opportunities
7.6.2 Top Key Companies
7.6.3 Historic and Forecasted Market Size by Segments
7.6.4 Historic and Forecasted Market Size by Product
7.6.4.1 Cereals & Grains
7.6.4.2 Meat & Poultry
7.6.4.3 Liquor
7.6.4.4 Edible Oil
7.6.4.5 Bakery
7.6.5 Historic and Forecasted Market Size by Distribution Channels
7.6.5.1 Hypermarkets & Supermarkets
7.6.5.2 Food Specialty Stores
7.6.5.3 Convenience Stores
7.6.5.4 Online
7.6.6 Historic and Forecast Market Size by Country
7.6.6.1 Turkiye
7.6.6.2 Bahrain
7.6.6.3 Kuwait
7.6.6.4 Saudi Arabia
7.6.6.5 Qatar
7.6.6.6 UAE
7.6.6.7 Israel
7.6.6.8 South Africa
7.7. South America Non-GMO Food Market
7.7.1 Key Market Trends, Growth Factors and Opportunities
7.7.2 Top Key Companies
7.7.3 Historic and Forecasted Market Size by Segments
7.7.4 Historic and Forecasted Market Size by Product
7.7.4.1 Cereals & Grains
7.7.4.2 Meat & Poultry
7.7.4.3 Liquor
7.7.4.4 Edible Oil
7.7.4.5 Bakery
7.7.5 Historic and Forecasted Market Size by Distribution Channels
7.7.5.1 Hypermarkets & Supermarkets
7.7.5.2 Food Specialty Stores
7.7.5.3 Convenience Stores
7.7.5.4 Online
7.7.6 Historic and Forecast Market Size by Country
7.7.6.1 Brazil
7.7.6.2 Argentina
7.7.6.3 Rest of SA
Chapter 8 Analyst Viewpoint and Conclusion
8.1 Recommendations and Concluding Analysis
8.2 Potential Market Strategies
Chapter 9 Research Methodology
9.1 Research Process
9.2 Primary Research
9.3 Secondary Research
|
Non-GMO Food Market |
|||
|
Base Year: |
2023 |
Forecast Period: |
2024-2032 |
|
Historical Data: |
2017 to 2023 |
Market Size in 2023: |
USD 2.3 Bn. |
|
Forecast Period 2024-32 CAGR: |
14.3% |
Market Size in 2032: |
USD 7.66 Bn. |
|
Segments Covered: |
By Product |
|
|
|
By Distribution Channels |
|
||
|
By Region |
|
||
|
Key Market Drivers: |
|
||
|
Key Market Restraints: |
|
||
|
Key Opportunities: |
|
||
|
Companies Covered in the report: |
|
||


