


Non-alcoholic Drinks Market Synopsis
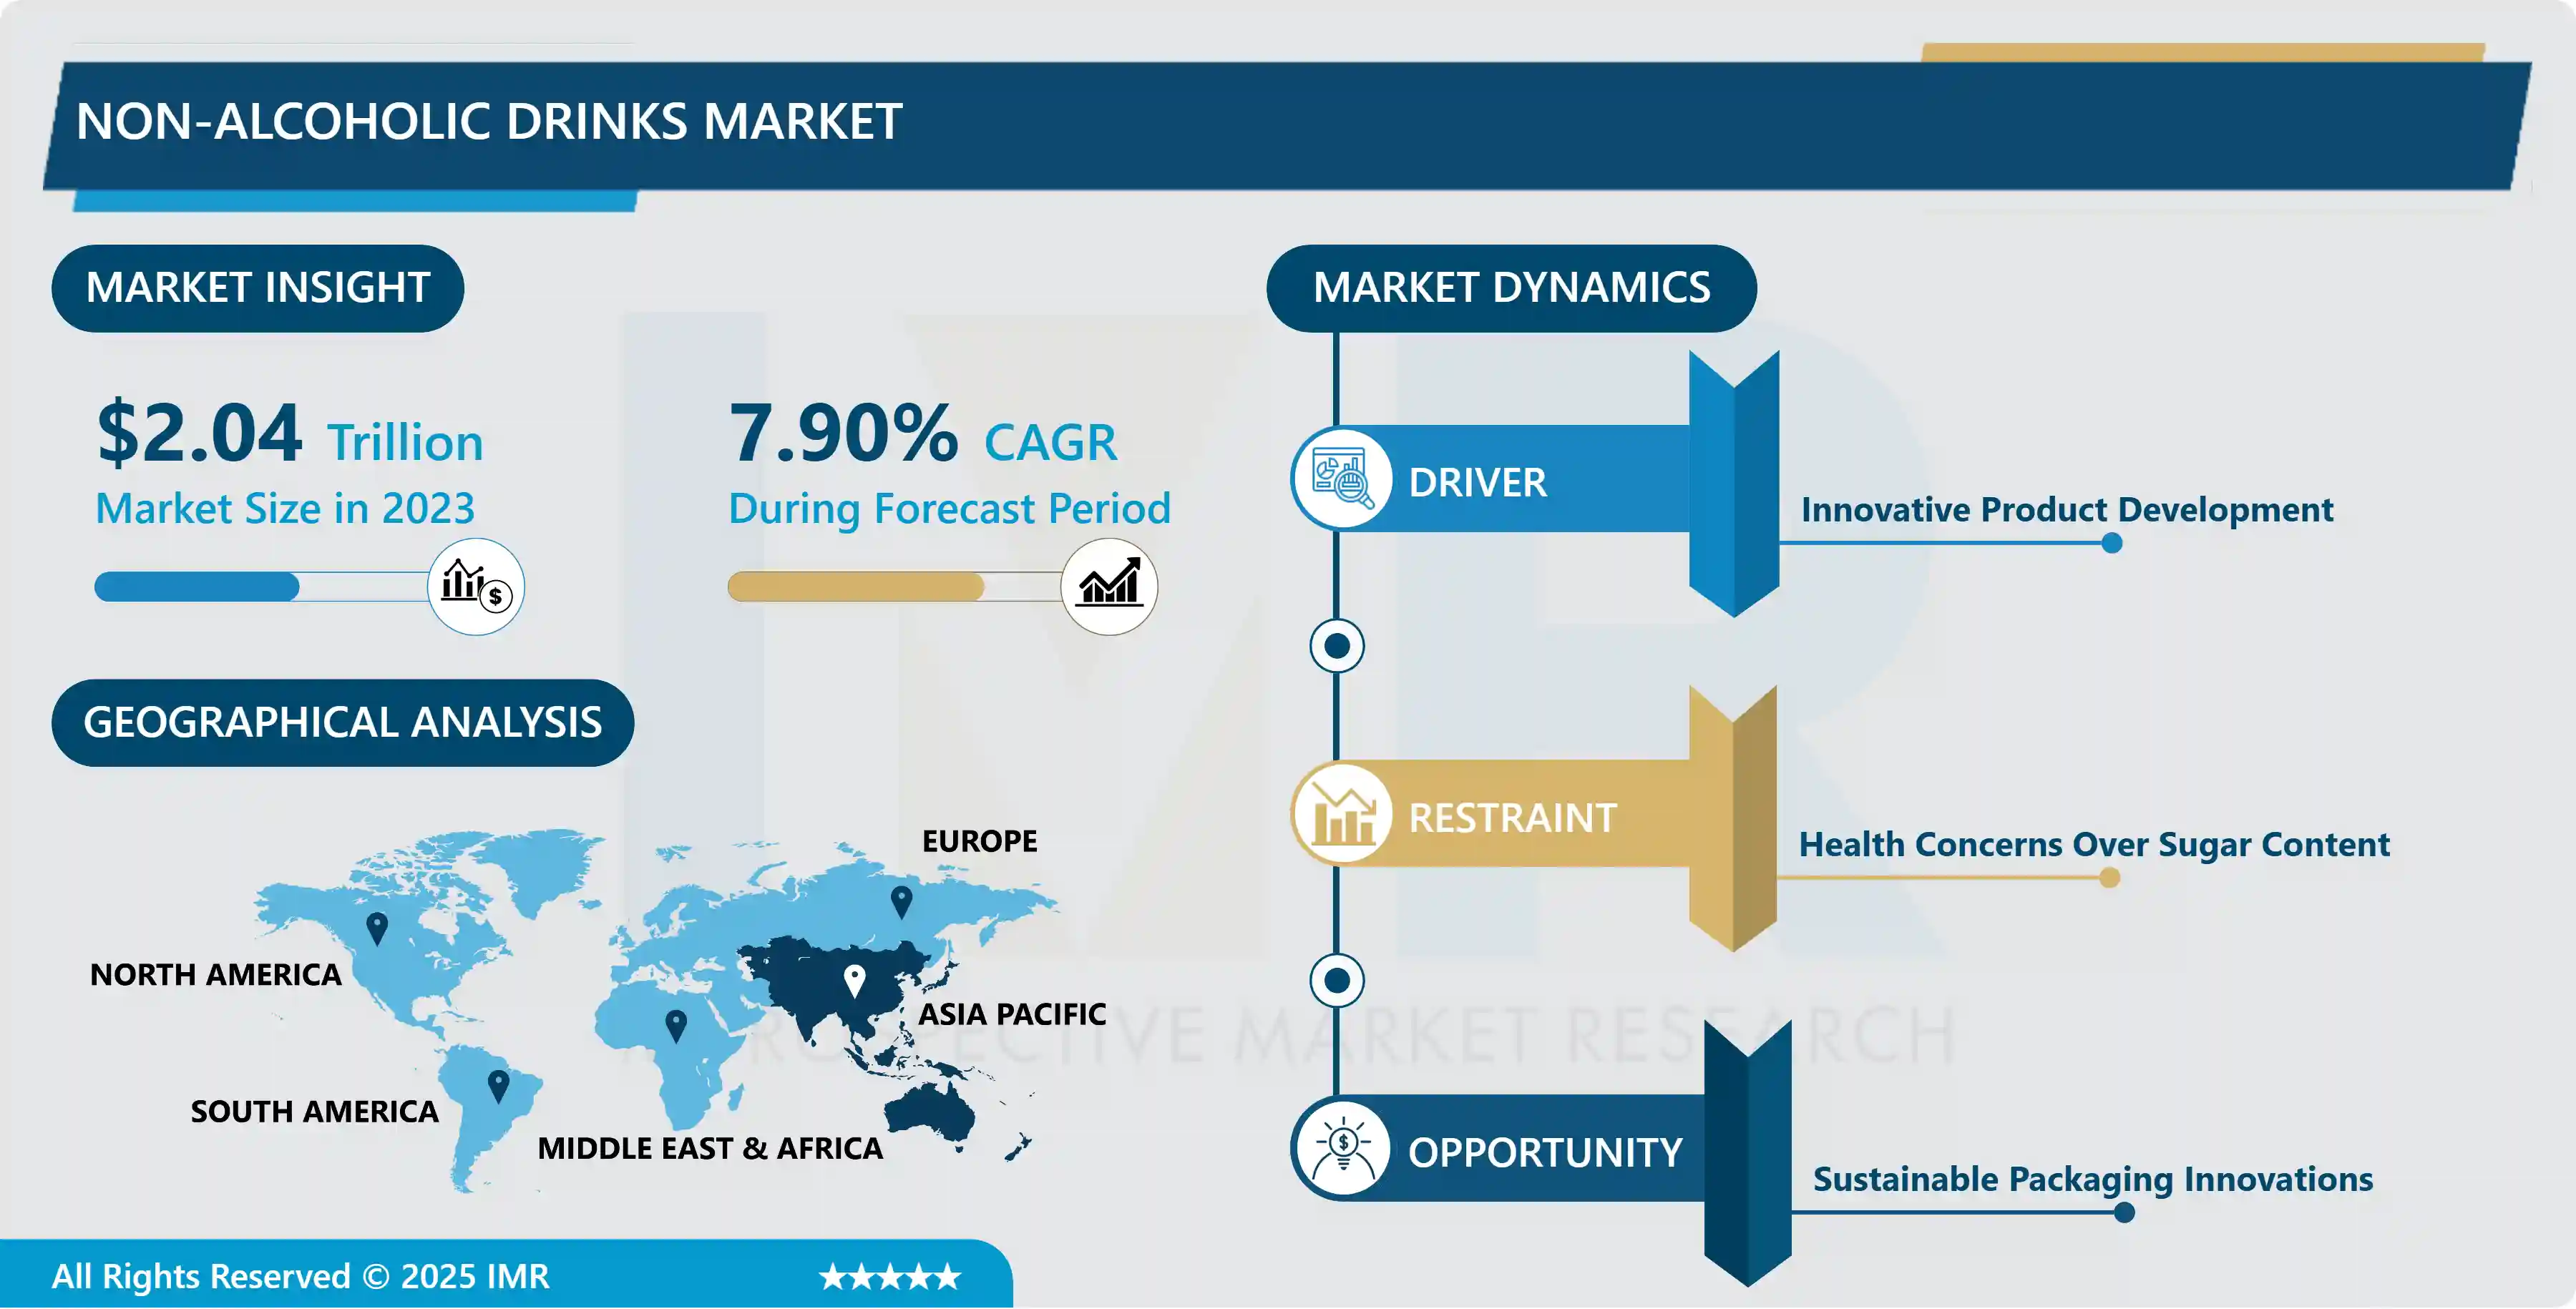
Non-alcoholic Drinks Market Size Was Valued at USD 1.89 Trillion in 2023, and is Projected to Reach USD 3.75 Trillion by 2032, Growing at a CAGR of 7.90% From 2024-2032.
Non alcoholic are those beverages whose proportion of alcohol is very low or they do not contain any alcohol at all. The company says it is clear and has less than 0.5% ABV, meaning that there is no significant presence of alcohol in the product at all. These include soft drinks, juices, teas, coffees, flavoured water, near beer and near wine to satisfy a consumer need or want to drink without alcohol.
Some of the highlights for the past couple of years have come from the NA drinks category, primarily the result of consumers shifting their habits towards healthier lifestyles and wellness. There will be a shift of consumers being conscious of their overall health which will promote the need for other products that have added value to the human system; such as fluid resuscitation, supply of essential nutrients and energy directly in the beverages. Current trends in new categories are flavored water, functional beverages and non alcoholic beers and others in this style makes HCC health conscious consumers on another lethal rocky path that is anything but traditional sweetened Carbonated Soft Drinks and alcoholic beverages. This plays out in increased interest from consumers across items that contain more plant-based and natural ingredients, as brands seek to innovate through developing superfoods, herbal extracts, and low-calorie sweeteners into their lineages. Other essential influences on the non-alcoholic drink market come from the mindset drinking propensity, wherein consumers want to cut down or completely abstain from alcohol, thereby presenting an emerging market for product lines that do not contain alcohol.
Product line differentiation for non-alcoholic beverages is strong as brands expand their product lines with broad choices to appeal to consumers toward them. Gone are the days of low-grade products such as craft non-alcoholic beers and gourmet soft drinks that have totally changed the market landscape to appeal to the choosy consumer who is willing to pay for quality and taste. In addition, e-commerce has revolutionalized the way of distribution channels by making available to the consumers a wider variety of non-alcoholic beverages online. The trend seems to be showing omnichannel strategies, with retailers increasing personal marketing and direct-to-consumer sales models for further customer experience. The market continues to evolve without losing focus on sustainability, leading the way to eco-friendly packaging and sourcing practices, which are expected to be among companies' highest considerations in light of the environmentally conscious consumers.
Analysis of the non- alcoholic drink market can be done on the basis of some market segments like soft drink market, bottled water market, fruit juices market, tea and coffee market.. The largest proportion, however, belongs to bottled water that due to perceived health qualities and remarkable convenience has experienced the largest drivers of demand. Flavored water containing natural flavors and vitamins are fast growing products due to increasing interest in healthier beverages. A key driver for the fruit juice segment is the development of a natural juice but the threat of sugar is leading to the consumption of 100% juices and low sugar juice ratios. The bottled RTD, ready to drink tea and coffee is expanding as the consumers look for easy to consume products that have better taste and functionality. North America and Europe are identified to be the most promising regions in the considered geography due to the rich disposable income and stronger health & wellness aspects.• Asia-Pacific, however, a population increase at a progressive rate which still has a growing potential.gorized into market segments such as soft drinks, bottled water, fruit juices, and tea and coffee. The most significant share, however, is on the part of bottled water, whose perceived health benefits and convenience have become the greatest drivers of demand. Demand for flavored water, infused with natural flavors and vitamins, is on an uptrend and attributed to consumer preferences for healthier hydration options. The fruit juice segment is gaining impetus owing to the increasing awareness about the benefits of a more natural juice but the dangers posed by sugar content are driving demand for 100% juices and low-sugar juice blends. Ready-to-drink tea and coffee are growing as consumers seek convenient formats that offer taste and functional benefits. North America and Europe represent the most promising geographies in the considered geography, both due to high disposable incomes and strong health and wellness trends.
Asia-Pacific, however, is an emerging growth region. It is accompanied by growth factors such as a continuously increasing urbanisation, the development of the middle-aged population and a shift towards wellness products. At the same time, countries like China and India are.MemberUp rapidly opening the markets because more and more consumers get to know health benefits of non-alcoholic beverages. This means that there are various competitors in this industry mostly including new and old players as organisations seek to create new technologies and thus gain more market share to cover the needs of change in expectations among the consumers. Alliances and joint ventures are also often observed, as the skillful acquisition of the new product or service line or expansion of geographical reach is necessary for many firms. In short, there is growth with increasing ascendancy of expansion in the non-alcoholic drinks segment as consumer preferences change, innovative product offers new variants, and overall sustainability of healthy products come into focus.
As competition intensifies and market dynamics change, corporations that get hold of their strategy to precisely align with emerging consumer trends will have the best opportunities to make the most of those opportunities within the growing market. As the levels of health, wellness, and convenience consciousness continue to grow, the future for non-carbonated beverages looks bright and full of promise in every respect for continued growth and innovation across segments.

Non-alcoholic Drinks Market Trend Analysis
Innovation in Flavor Profiles
- Innovation in flavor profile is fueled by consumer demand for multiple interesting, healthy beverages. More recently, with greater focus on need for health-conscious living, beverage manufacturers have taken more risks about unique flavorings with natural ingredients, herbs, spices, and botanicals, especially as the market continues to move toward healthier lifestyles. The ones that come to mind are the colorful, food-infused drinks with superfoods like turmeric, ginger, and matcha, which are touted not only for their functional benefits but for their great taste as well. The general concept is traditionally reimagined through innovative techniques such as cold brewing, fermentation, and carbonation, to name a few, which can enhance the sensory experience and differentiate a product from others on the shelves.
- And with the craft beverage movement has come the encouragement to push towards small-batch and artisanal style, moving drinks toward more bold, interesting, and unexpected flavor expressions. No longer imitative, non-alcoholic beverages are inventing something new. In processes of delectation, such as exotic fruit, floral note infusions, and spiced profiles, global cuisines create thrill in consumers' taste buds and inspire adventure. It also appeals to all those interested in finding healthier choices, while at the same time targeting the younger demographic interested in sophisticated non-alcoholic options. Going forward, one can expect more companies to come forward and focus their efforts on taste innovation as the market continues growing.
Sustainable Packaging Innovations
- Non-Alcoholic Drinks Market - Sustainable Packaging Innovation dealing with the increasing trend toward the use of sustainable packaging innovations to cater for the ever growing demand for environmentally sustainable products by consumers. Different companies are turning to biodegradable plastics, plant material, and The recyclable glass packaging for their products. There are efforts being made by companies to invest in research and development of these materials enhancing their functionalities in a way that does not negativities, sustainability goals and yet meet product integrity and shelf-life challenges. Examples of innovations include food packaging that will soon be consumable and reusable containers. These push brands to brandish their uniqueness in a very crowded market space, attracting the ever-increasing audience of green-conscious consumers.
- There are also regulatory pressures and corporate social responsibility initiatives to keep the drinks industry focused on sustainable practices. To this end, several companies have agreed to ambitious targets of cutting the number of single-use plastics and increasing the recyclability of its packages by a specific percentage in the next few years. Beverage producers are even taking partnerships with packaging innovators to create new solutions aimed at overcoming waste management and sustainability challenges. Such a proactive approach not only will ensure that the brands are non-compliant but also enhance reputation before consumers adopt sustainable values. In general, adaptation of sustainable innovations into packaging is becoming an imperative component of strategy planning in the Non-Alcoholic Drinks Market, thereby opening doors to a more sustainable future.
Non-alcoholic Drinks Market Segment Analysis:
Non-alcoholic Drinks MarketSegmented based on Product Type, Distribution Channel , and Price Point.
By Product Type, Bottled Water segment is expected to dominate the market during the forecast period
- The non-alcoholic drinks market is a dynamic sector encompassing various product types, including soft drinks, bottled water, tea and coffee, juice, dairy drinks, and others. Soft drinks remain a significant contributor to the market, driven by innovative flavors, low-calorie options, and the growing demand for functional beverages. Bottled water continues to gain traction, with consumers increasingly prioritizing hydration and health. The rise in awareness of the benefits of tea and coffee, particularly in their ready-to-drink formats, further propels this segment. Additionally, the juice category is witnessing a shift towards organic and natural options, reflecting changing consumer preferences for healthier alternatives.
- The dairy drinks segment is also experiencing growth, supported by the rising popularity of lactose-free and plant-based alternatives, appealing to health-conscious consumers. Other categories, including energy drinks and flavored waters, are emerging as key players, catering to a diverse consumer base seeking convenience and variety. Sustainable packaging innovations and eco-friendly practices are becoming integral to brand strategies, as consumers increasingly favor environmentally responsible products. Overall, the non-alcoholic drinks market is poised for continued expansion, driven by evolving consumer preferences, health trends, and sustainability initiatives.
By Distribution Channel , Supermarket/Hypermarket segment held the largest share in 2023
- The Non-Alcoholic Drinks Market has grown by leaps and bounds over the years through various sales channels. Though supermarkets and hypermarkets are still the largest channels, their enormous product portfolios and ease of accessibility guarantee a huge consumer base. Larger retail formats generally amalgamate promoters and discounts, thus increasing customer loyalty, making them a shopper's preferred choice for non-alcoholic beverages. There are also the convenience stores that have fast become popular today because of their accessibility and growing consumption on the go, especially in an urban setup of time-scant people who are compelled to make fast decisions in regards to buying. Specialty stores cater to niches like organic, health-conscious, or gourmet nonalcoholic beverages that particularly appeal to sophisticated consumers seeking unique products that support their lifestyle choices.
- The online retail sales segment has seen spectacular growth from the shift in e-commerce penetration and also changing consumer shopping habits, especially post-pandemic. Consumers love to browse from a wider assortment of soft drinks from the comfort of their bedrooms, with average order values usually being higher due to bundled purchase behavior. There has also been rapid growth of direct-to-consumer brands, and online sales, which then supported the ability to offer more tailored products and personalized marketing strategies. Other significant channels in the market are vending machines and foodservice outlets, and such mechanisms contribute to a very comprehensive ecosystem, one that respects the diverse consumer preferences in the sector of non-alcoholic beverages.
Non-alcoholic Drinks MarketRegional Insights:
Asia Pacific is Expected to Dominate the Market Over the Forecast period
- The Non-Alcoholic Drinks Market in the Asia Pacific region is expected to be the market leader during the forecast period due to a growing population and upscaling of disposable incomes, as well as changing consumer preferences toward healthier beverage options. Growing urbanization with an expanding middle class has led to growing demand for a range of non-alcoholic drinks, including carbonated water, fruit juice, and health-oriented beverages such as kombucha and herbal teas. Other factors that contribute to this trend are changing lifestyles by which consumers seek convenience and refreshing beverages that can replace alcoholic drinks, particularly among the younger population which is more concerned with wellness and a healthy lifestyle.
- The region is also replete with innovations and new product developments in the non-alcoholic beverage segment due to companies' responses to changing consumer tastes and preferences. Due to rising sustainability and environmentally friendly packaging concerns from consumers, brands are investing more in eco-friendly practices. The also increased method of expansion of the channels of distribution, such as retail or e-commerce platforms. These make it easier for wider markets to access non-alcoholic beverages. The Asia Pacific region is, hence likely to grow considerably and even remain to be among the most important ones in the world non-alcoholic drinks market.
Active Key Players in the Non-alcoholic Drinks Market
- Kraft Foods Group, Inc. (USA)
- Suja Life, LLC (USA)
- FreshBev (USA)
- Pressed Juicery (USA)
- Suntory Beverage & Food (Japan)
- Unilever (UK/Netherlands)
- Asahi Group (Japan)
- Jacobs Douwe Egberts (Netherlands)
- Kirin Holdings Co. (Japan)
- Others Key Player
Key Industry Developments in the Non-alcoholic Drinks Market
- In July 2022, Colorado is now home to PepsiCo's biggest bottling facility in the US. The proposed plant may accomplish reduced use of virgin plastic, best-in-class water efficiency, and 100% renewable electricity.
- In March 2022, Red Bull introduced its strawberry and apricot limited-edition flavour extension. Beginning on April 4, 2022, Red Bull Summer Edition Strawberry Apricot was stocked on Walmart's shelves in the United States. It was offered in single cans, measuring 8.4 oz (25 cm) and 12 oz (35 cm).
- In March 2022, Start-up based in the United Kingdom A line of natural energy drinks in cans, powered by matcha green tea, was introduced by PerfectTed. Made from actual fruit juice, the three flavours are pineapple yuzu, apple raspberry, and pear ginger. The beverages include no added sugar, preservatives, additives, or gluten and are made entirely of plants.
|
Global Non-alcoholic Drinks Market |
|||
|
Base Year: |
2023 |
Forecast Period: |
2024-2032 |
|
Historical Data: |
2017 to 2023 |
Market Size in 2024: |
USD 1.89 Tn. |
|
Forecast Period 2024-32 CAGR: |
7.90% |
Market Size in 2032: |
USD 3.75 Tn. |
|
Segments Covered: |
By Product Type |
|
|
|
By Distribution Channel |
|
||
|
By Price Point |
|
||
|
By Region |
|
||
|
Key Market Drivers: |
|
||
|
Key Market Restraints: |
|
||
|
Key Opportunities: |
|
||
|
Companies Covered in the report: |
|
||
Chapter 1: Introduction
1.1 Scope and Coverage
Chapter 2:Executive Summary
Chapter 3: Market Landscape
3.1 Market Dynamics
3.1.1 Drivers
3.1.2 Restraints
3.1.3 Opportunities
3.1.4 Challenges
3.2 Market Trend Analysis
3.3 PESTLE Analysis
3.4 Porter's Five Forces Analysis
3.5 Industry Value Chain Analysis
3.6 Ecosystem
3.7 Regulatory Landscape
3.8 Price Trend Analysis
3.9 Patent Analysis
3.10 Technology Evolution
3.11 Investment Pockets
3.12 Import-Export Analysis
Chapter 4: Non-alcoholic Drinks Market by Product Type (2018-2032)
4.1 Non-alcoholic Drinks Market Snapshot and Growth Engine
4.2 Market Overview
4.3 Soft Drinks
4.3.1 Introduction and Market Overview
4.3.2 Historic and Forecasted Market Size in Value USD and Volume Units
4.3.3 Key Market Trends, Growth Factors, and Opportunities
4.3.4 Geographic Segmentation Analysis
4.4 Bottled Water
4.5 Tea and Coffee
4.6 Juice
4.7 Dairy Drinks
4.8 Others
Chapter 5: Non-alcoholic Drinks Market by Distribution Channel (2018-2032)
5.1 Non-alcoholic Drinks Market Snapshot and Growth Engine
5.2 Market Overview
5.3 Supermarket/Hypermarket
5.3.1 Introduction and Market Overview
5.3.2 Historic and Forecasted Market Size in Value USD and Volume Units
5.3.3 Key Market Trends, Growth Factors, and Opportunities
5.3.4 Geographic Segmentation Analysis
5.4 Convenience stores
5.5 Specialty Stores
5.6 Online Retails
5.7 Others
Chapter 6: Non-alcoholic Drinks Market by Price Point (2018-2032)
6.1 Non-alcoholic Drinks Market Snapshot and Growth Engine
6.2 Market Overview
6.3 Standard
6.3.1 Introduction and Market Overview
6.3.2 Historic and Forecasted Market Size in Value USD and Volume Units
6.3.3 Key Market Trends, Growth Factors, and Opportunities
6.3.4 Geographic Segmentation Analysis
6.4 Premium
6.5 Luxury
Chapter 7: Company Profiles and Competitive Analysis
7.1 Competitive Landscape
7.1.1 Competitive Benchmarking
7.1.2 Non-alcoholic Drinks Market Share by Manufacturer (2024)
7.1.3 Industry BCG Matrix
7.1.4 Heat Map Analysis
7.1.5 Mergers and Acquisitions
7.2 KRAFT FOODS GROUP INC. (USA)
7.2.1 Company Overview
7.2.2 Key Executives
7.2.3 Company Snapshot
7.2.4 Role of the Company in the Market
7.2.5 Sustainability and Social Responsibility
7.2.6 Operating Business Segments
7.2.7 Product Portfolio
7.2.8 Business Performance
7.2.9 Key Strategic Moves and Recent Developments
7.2.10 SWOT Analysis
7.3 SUJA LIFE
7.4 LLC (USA)
7.5 FRESHBEV (USA)
7.6 PRESSED JUICERY (USA)
7.7 SUNTORY BEVERAGE & FOOD (JAPAN)
7.8 UNILEVER (UK/NETHERLANDS)
7.9 ASAHI GROUP (JAPAN)
7.10 JACOBS DOUWE EGBERTS (NETHERLANDS)
7.11 KIRIN HOLDINGS CO. (JAPAN)
7.12 OTHERS KEY PLAYER
Chapter 8: Global Non-alcoholic Drinks Market By Region
8.1 Overview
8.2. North America Non-alcoholic Drinks Market
8.2.1 Key Market Trends, Growth Factors and Opportunities
8.2.2 Top Key Companies
8.2.3 Historic and Forecasted Market Size by Segments
8.2.4 Historic and Forecasted Market Size by Product Type
8.2.4.1 Soft Drinks
8.2.4.2 Bottled Water
8.2.4.3 Tea and Coffee
8.2.4.4 Juice
8.2.4.5 Dairy Drinks
8.2.4.6 Others
8.2.5 Historic and Forecasted Market Size by Distribution Channel
8.2.5.1 Supermarket/Hypermarket
8.2.5.2 Convenience stores
8.2.5.3 Specialty Stores
8.2.5.4 Online Retails
8.2.5.5 Others
8.2.6 Historic and Forecasted Market Size by Price Point
8.2.6.1 Standard
8.2.6.2 Premium
8.2.6.3 Luxury
8.2.7 Historic and Forecast Market Size by Country
8.2.7.1 US
8.2.7.2 Canada
8.2.7.3 Mexico
8.3. Eastern Europe Non-alcoholic Drinks Market
8.3.1 Key Market Trends, Growth Factors and Opportunities
8.3.2 Top Key Companies
8.3.3 Historic and Forecasted Market Size by Segments
8.3.4 Historic and Forecasted Market Size by Product Type
8.3.4.1 Soft Drinks
8.3.4.2 Bottled Water
8.3.4.3 Tea and Coffee
8.3.4.4 Juice
8.3.4.5 Dairy Drinks
8.3.4.6 Others
8.3.5 Historic and Forecasted Market Size by Distribution Channel
8.3.5.1 Supermarket/Hypermarket
8.3.5.2 Convenience stores
8.3.5.3 Specialty Stores
8.3.5.4 Online Retails
8.3.5.5 Others
8.3.6 Historic and Forecasted Market Size by Price Point
8.3.6.1 Standard
8.3.6.2 Premium
8.3.6.3 Luxury
8.3.7 Historic and Forecast Market Size by Country
8.3.7.1 Russia
8.3.7.2 Bulgaria
8.3.7.3 The Czech Republic
8.3.7.4 Hungary
8.3.7.5 Poland
8.3.7.6 Romania
8.3.7.7 Rest of Eastern Europe
8.4. Western Europe Non-alcoholic Drinks Market
8.4.1 Key Market Trends, Growth Factors and Opportunities
8.4.2 Top Key Companies
8.4.3 Historic and Forecasted Market Size by Segments
8.4.4 Historic and Forecasted Market Size by Product Type
8.4.4.1 Soft Drinks
8.4.4.2 Bottled Water
8.4.4.3 Tea and Coffee
8.4.4.4 Juice
8.4.4.5 Dairy Drinks
8.4.4.6 Others
8.4.5 Historic and Forecasted Market Size by Distribution Channel
8.4.5.1 Supermarket/Hypermarket
8.4.5.2 Convenience stores
8.4.5.3 Specialty Stores
8.4.5.4 Online Retails
8.4.5.5 Others
8.4.6 Historic and Forecasted Market Size by Price Point
8.4.6.1 Standard
8.4.6.2 Premium
8.4.6.3 Luxury
8.4.7 Historic and Forecast Market Size by Country
8.4.7.1 Germany
8.4.7.2 UK
8.4.7.3 France
8.4.7.4 The Netherlands
8.4.7.5 Italy
8.4.7.6 Spain
8.4.7.7 Rest of Western Europe
8.5. Asia Pacific Non-alcoholic Drinks Market
8.5.1 Key Market Trends, Growth Factors and Opportunities
8.5.2 Top Key Companies
8.5.3 Historic and Forecasted Market Size by Segments
8.5.4 Historic and Forecasted Market Size by Product Type
8.5.4.1 Soft Drinks
8.5.4.2 Bottled Water
8.5.4.3 Tea and Coffee
8.5.4.4 Juice
8.5.4.5 Dairy Drinks
8.5.4.6 Others
8.5.5 Historic and Forecasted Market Size by Distribution Channel
8.5.5.1 Supermarket/Hypermarket
8.5.5.2 Convenience stores
8.5.5.3 Specialty Stores
8.5.5.4 Online Retails
8.5.5.5 Others
8.5.6 Historic and Forecasted Market Size by Price Point
8.5.6.1 Standard
8.5.6.2 Premium
8.5.6.3 Luxury
8.5.7 Historic and Forecast Market Size by Country
8.5.7.1 China
8.5.7.2 India
8.5.7.3 Japan
8.5.7.4 South Korea
8.5.7.5 Malaysia
8.5.7.6 Thailand
8.5.7.7 Vietnam
8.5.7.8 The Philippines
8.5.7.9 Australia
8.5.7.10 New Zealand
8.5.7.11 Rest of APAC
8.6. Middle East & Africa Non-alcoholic Drinks Market
8.6.1 Key Market Trends, Growth Factors and Opportunities
8.6.2 Top Key Companies
8.6.3 Historic and Forecasted Market Size by Segments
8.6.4 Historic and Forecasted Market Size by Product Type
8.6.4.1 Soft Drinks
8.6.4.2 Bottled Water
8.6.4.3 Tea and Coffee
8.6.4.4 Juice
8.6.4.5 Dairy Drinks
8.6.4.6 Others
8.6.5 Historic and Forecasted Market Size by Distribution Channel
8.6.5.1 Supermarket/Hypermarket
8.6.5.2 Convenience stores
8.6.5.3 Specialty Stores
8.6.5.4 Online Retails
8.6.5.5 Others
8.6.6 Historic and Forecasted Market Size by Price Point
8.6.6.1 Standard
8.6.6.2 Premium
8.6.6.3 Luxury
8.6.7 Historic and Forecast Market Size by Country
8.6.7.1 Turkiye
8.6.7.2 Bahrain
8.6.7.3 Kuwait
8.6.7.4 Saudi Arabia
8.6.7.5 Qatar
8.6.7.6 UAE
8.6.7.7 Israel
8.6.7.8 South Africa
8.7. South America Non-alcoholic Drinks Market
8.7.1 Key Market Trends, Growth Factors and Opportunities
8.7.2 Top Key Companies
8.7.3 Historic and Forecasted Market Size by Segments
8.7.4 Historic and Forecasted Market Size by Product Type
8.7.4.1 Soft Drinks
8.7.4.2 Bottled Water
8.7.4.3 Tea and Coffee
8.7.4.4 Juice
8.7.4.5 Dairy Drinks
8.7.4.6 Others
8.7.5 Historic and Forecasted Market Size by Distribution Channel
8.7.5.1 Supermarket/Hypermarket
8.7.5.2 Convenience stores
8.7.5.3 Specialty Stores
8.7.5.4 Online Retails
8.7.5.5 Others
8.7.6 Historic and Forecasted Market Size by Price Point
8.7.6.1 Standard
8.7.6.2 Premium
8.7.6.3 Luxury
8.7.7 Historic and Forecast Market Size by Country
8.7.7.1 Brazil
8.7.7.2 Argentina
8.7.7.3 Rest of SA
Chapter 9 Analyst Viewpoint and Conclusion
9.1 Recommendations and Concluding Analysis
9.2 Potential Market Strategies
Chapter 10 Research Methodology
10.1 Research Process
10.2 Primary Research
10.3 Secondary Research
|
Global Non-alcoholic Drinks Market |
|||
|
Base Year: |
2023 |
Forecast Period: |
2024-2032 |
|
Historical Data: |
2017 to 2023 |
Market Size in 2024: |
USD 1.89 Tn. |
|
Forecast Period 2024-32 CAGR: |
7.90% |
Market Size in 2032: |
USD 3.75 Tn. |
|
Segments Covered: |
By Product Type |
|
|
|
By Distribution Channel |
|
||
|
By Price Point |
|
||
|
By Region |
|
||
|
Key Market Drivers: |
|
||
|
Key Market Restraints: |
|
||
|
Key Opportunities: |
|
||
|
Companies Covered in the report: |
|
||


