


Neuroendocrine Tumor Treatment Market Synopsis:
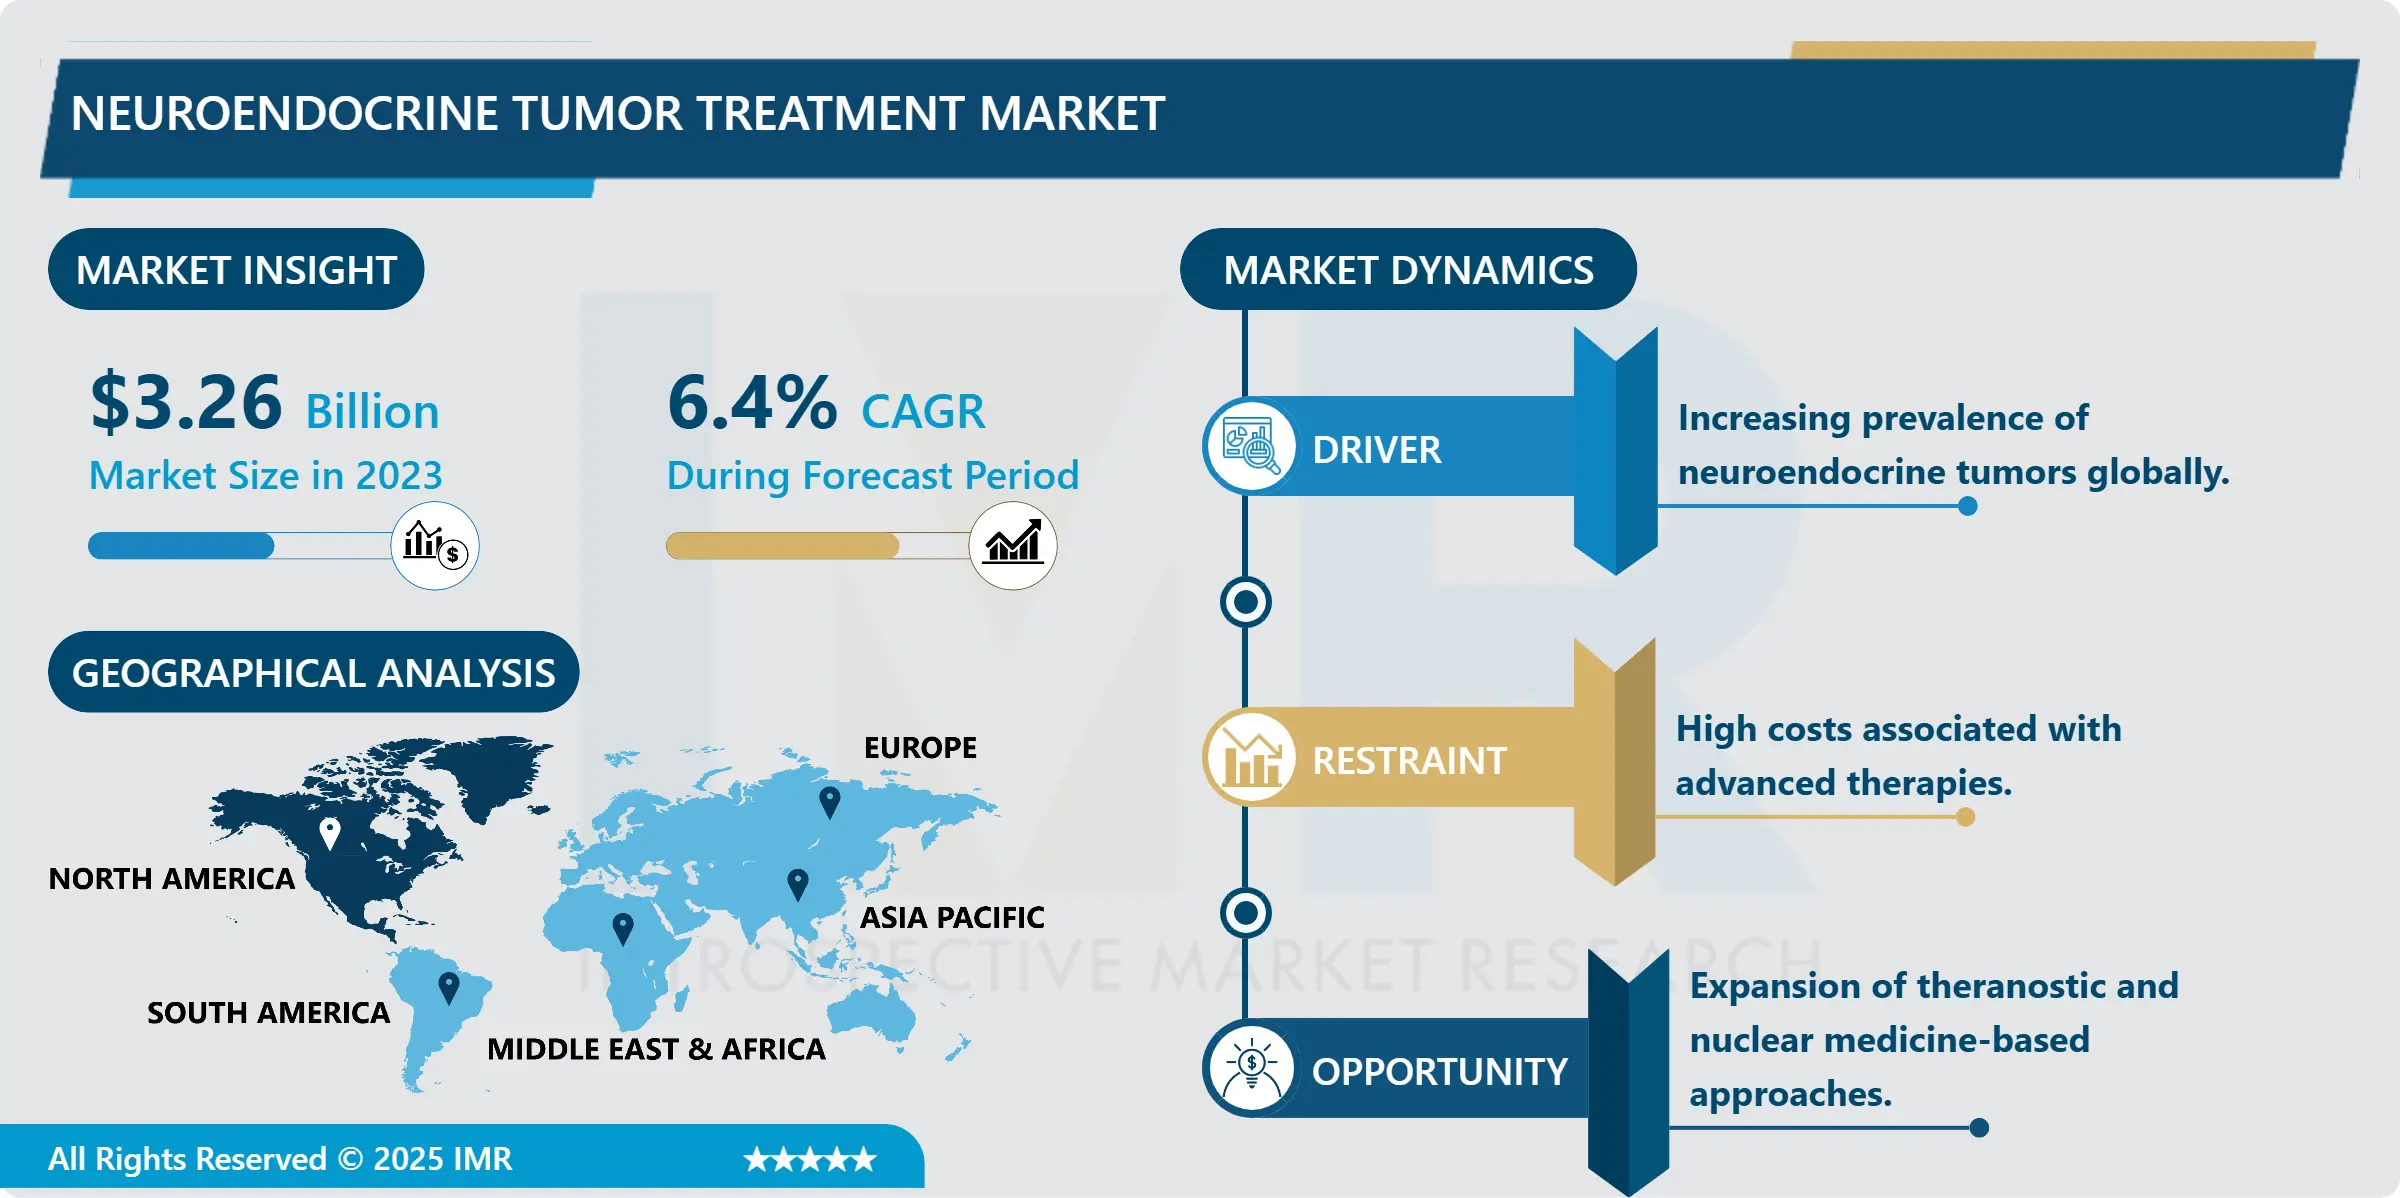
Neuroendocrine Tumor Treatment Market Size Was Valued at USD 3.26 Billion in 2023, and is Projected to Reach USD 5.70 Billion by 2032, Growing at a CAGR of 6.4 % From 2024-2032.
Neuroendocrine tumor lenitive market has been growing rapidly in the recent past due to rising incidence of NET in the world. New diagnostic technologies and molecular markers detect diseases before the onset of symptoms, increasing the need for therap Author ‘s note The development of highly sensitive imaging and biomarker detection technologies contributes to the early diagnosis of diseases which have been never manifested, and thus, increases the need for adequate treatment. However, pharmacological treatment has emerged significantly in NETs over the last years, thanks to targeted drugs and somatostatin analogs, thus improving the severity of such symptoms and the patient’s quality of life.
Development is important as NETs are gradually being acknowledged by healthcare systems worldwide and continued to be addressed by multidisciplinary tumor boards as well as institution of dedicated NET treatment centers. Increased expenditure by pharmaceutical companies in research and development and favourable government policies are other factors additionally driving the market. Nonetheless, the following issues are constraints to the market; high cost to treat the condition and low health literacy among the population in some parts of the world adoption.
Neuroendocrine Tumor Treatment Market Trend Analysis
Growth in Targeted Therapies
-
Targeted therapies have emerged as a significant breakthrough in the treatment of neuroendocrine tumors (NETs), offering new hope through precision medicine. Unlike conventional chemotherapy, which affects both healthy and cancerous cells, targeted therapies work by honing in on specific molecular pathways responsible for tumor growth and progression. Drugs such as everolimus and sunitinib have gained prominence due to their ability to inhibit key mechanisms like mTOR signaling and tumor angiogenesis. These therapies have demonstrated improved efficacy and tolerability, reducing systemic toxicity and enhancing patient quality of life.
- Continued exploration into novel molecular targets and pathways could broaden therapeutic options and tailor treatments to individual tumor profiles. This personalized approach not only increases treatment success rates but also fosters innovation in drug development, ultimately expanding the arsenal available for managing NETs and improving long-term patient outcomes.
Expansion of Theranostic Approaches
-
One of the most significant drivers of growth in the neuroendocrine tumor (NET) treatment market is the increasing implementation of theranostic strategies, which integrate diagnostic imaging with targeted therapy. This approach allows for greater treatment precision by enabling clinicians to visualize tumors using specific imaging agents and then apply the same or similar agents labeled with therapeutic isotopes.
- A prime example is the use of radiolabeled somatostatin analogs such as lutetium Lu 177-dotatate, which detect NETs via positron emission tomography (PET) or single-photon emission computed tomography (SPECT), and also deliver targeted radiation therapy. This dual functionality minimizes off-target effects and enhances therapeutic efficacy. As nuclear medicine continues to evolve and embrace personalized treatment protocols, theranostics is poised to play a pivotal role in transforming NET management and expanding the treatment market.
Neuroendocrine Tumor Treatment Market Segment Analysis:
Neuroendocrine Tumor Treatment Market is Segmented on the basis of Drug Class, Indication, Distribution Channel, and Region.
By Drug Class, Somatostatin segment is expected to dominate the market during the forecast period
-
The somatostatin analogs segment, particularly comprising octreotide and lanreotide, is anticipated to lead the neuroendocrine tumor (NET) treatment market during the forecast period. This dominance is attributed to their dual role in both controlling clinical symptoms and suppressing tumor growth, especially in functioning NETs. These drugs work by mimicking the natural hormone somatostatin, effectively inhibiting the secretion of various peptides and hormones that fuel tumor proliferation.
- As a result, they significantly enhance quality of life (QoL) for patients. Octreotide and lanreotide are widely regarded as first-line therapies due to their established efficacy and safety profiles. Ongoing research and innovation aimed at improving drug delivery mechanisms and enhancing bioavailability continue to strengthen the potential and market share of this segment. Pharmaceutical advancements suggest no impending slowdown, solidifying its forecasted dominance.
By Indication, the Gastrointestinal NET segment is expected to hold the largest share
-
The Gastrointestinal Neuroendocrine Tumor (NET) segment is poised to dominate the neuroendocrine tumor treatment market due to the high incidence of NETs in the gastrointestinal (GI) tract. These tumors account for approximately one-third of all NET cases, highlighting the need for targeted interventions. Their complex nature often necessitates multimodal treatment approaches, including surgical resection, pharmacological therapies such as somatostatin analogs, and advanced radiotherapy.
- The widespread use of endoscopic procedures and nuclear imaging has significantly improved diagnostic accuracy and early detection, further supporting favorable treatment outcomes. Moreover, the continuous development of organ-specific treatment protocols, such as peptide receptor radionuclide therapy (PRRT) and targeted molecular therapies, is contributing to the strong market growth of this segment. These advancements underscore the critical importance of GI NETs within the broader neuroendocrine oncology landscape.
Neuroendocrine Tumor Treatment Market Regional Insights:
North America is Expected to Dominate the Market Over the Forecast period
-
North America shall continue to lead the growth in the neuroendocrine tumor treatment market within the forecast period contributing the largest revenue share. Advanced diagnostics and treatments together with a well-developed healthcare system and infrastructure generate high market growth in the region. The United States enjoys a high incidence rate of NETs and government-endorsed programs in cancer research and development. Both incumbent major pharma players as well as current clinical research adds to the region’s market advantage.
- Canada also manages to be a relatively generous contributor although most of the projects undertaken target enhancing the basic infrastructure of cancer care and raising NETs awareness. Latest technologies and compatible treatment methodologies have improved and refined patient care and prognosis. Also, good reimbursement policies as well as well-coordinated cooperation between public and private sectors are important factors contributing to the market growth.
Active Key Players in the Neuroendocrine Tumor Treatment Market:
- Advanced Accelerator Applications (France)
- Bristol-Myers Squibb Company (USA)
- Eli Lilly and Company (USA)
- F. Hoffmann-La Roche AG (Switzerland)
- Ipsen S.A. (France)
- Merck & Co., Inc. (USA)
- Novartis AG (Switzerland)
- Pfizer Inc. (USA)
- Progenics Pharmaceuticals, Inc. (USA)
- Sanofi S.A. (France)
- Sotio Biotech (Czech Republic)
- Sun Pharmaceutical Industries Ltd. (India)
- Teva Pharmaceutical Industries Ltd. (Israel)
- Theragnostics Ltd. (UK)
- Y-mAbs Therapeutics, Inc. (USA)
- Other Active Players
|
Global Neuroendocrine Tumor Treatment Market |
|||
|
Base Year: |
2023 |
Forecast Period: |
2024-2032 |
|
Historical Data: |
2017 to 2023 |
Market Size in 2023: |
USD 3.26 Billion |
|
Forecast Period 2024-32 CAGR: |
6.4 % |
Market Size in 2032: |
USD 5.70 Billion |
|
Segments Covered: |
By Drug Class |
|
|
|
By Indication |
|
||
|
By Distribution Channel |
|
||
|
By Region |
|
||
|
Key Market Drivers: |
|
||
|
Key Market Restraints: |
|
||
|
Key Opportunities: |
|
||
|
Companies Covered in the report: |
|
||
Chapter 1: Introduction
1.1 Scope and Coverage
Chapter 2:Executive Summary
Chapter 3: Market Landscape
3.1 Market Dynamics
3.1.1 Drivers
3.1.2 Restraints
3.1.3 Opportunities
3.1.4 Challenges
3.2 Market Trend Analysis
3.3 PESTLE Analysis
3.4 Porter's Five Forces Analysis
3.5 Industry Value Chain Analysis
3.6 Ecosystem
3.7 Regulatory Landscape
3.8 Price Trend Analysis
3.9 Patent Analysis
3.10 Technology Evolution
3.11 Investment Pockets
3.12 Import-Export Analysis
Chapter 4: Neuroendocrine Tumor Treatment Market by Drug Class
4.1 Neuroendocrine Tumor Treatment Market Snapshot and Growth Engine
4.2 Neuroendocrine Tumor Treatment Market Overview
4.3 Somatostatin Analogs Chemotherapy Targeted Therapy Immunotherapy Others
4.3.1 Introduction and Market Overview
4.3.2 Historic and Forecasted Market Size in Value USD and Volume Units (2017-2032F)
4.3.3 Key Market Trends, Growth Factors and Opportunities
4.3.4 Somatostatin Analogs Chemotherapy Targeted Therapy Immunotherapy Others: Geographic Segmentation Analysis
Chapter 5: Neuroendocrine Tumor Treatment Market by Indication
5.1 Neuroendocrine Tumor Treatment Market Snapshot and Growth Engine
5.2 Neuroendocrine Tumor Treatment Market Overview
5.3 Gastrointestinal NET Lung NET Pancreatic NET Others
5.3.1 Introduction and Market Overview
5.3.2 Historic and Forecasted Market Size in Value USD and Volume Units (2017-2032F)
5.3.3 Key Market Trends, Growth Factors and Opportunities
5.3.4 Gastrointestinal NET Lung NET Pancreatic NET Others: Geographic Segmentation Analysis
Chapter 6: Neuroendocrine Tumor Treatment Market by Distribution Channel
6.1 Neuroendocrine Tumor Treatment Market Snapshot and Growth Engine
6.2 Neuroendocrine Tumor Treatment Market Overview
6.3 Hospital Pharmacies Online Pharmacies Retail Pharmacies
6.3.1 Introduction and Market Overview
6.3.2 Historic and Forecasted Market Size in Value USD and Volume Units (2017-2032F)
6.3.3 Key Market Trends, Growth Factors and Opportunities
6.3.4 Hospital Pharmacies Online Pharmacies Retail Pharmacies: Geographic Segmentation Analysis
Chapter 7: Company Profiles and Competitive Analysis
7.1 Competitive Landscape
7.1.1 Competitive Benchmarking
7.1.2 Neuroendocrine Tumor Treatment Market Share by Manufacturer (2023)
7.1.3 Industry BCG Matrix
7.1.4 Heat Map Analysis
7.1.5 Mergers and Acquisitions
7.2 ADVANCED ACCELERATOR APPLICATIONS (FRANCE)
7.2.1 Company Overview
7.2.2 Key Executives
7.2.3 Company Snapshot
7.2.4 Role of the Company in the Market
7.2.5 Sustainability and Social Responsibility
7.2.6 Operating Business Segments
7.2.7 Product Portfolio
7.2.8 Business Performance
7.2.9 Key Strategic Moves and Recent Developments
7.2.10 SWOT Analysis
7.3 BRISTOL-MYERS SQUIBB COMPANY (USA)
7.4 ELI LILLY AND COMPANY (USA)
7.5 F. HOFFMANN-LA ROCHE AG (SWITZERLAND)
7.6 IPSEN S.A. (FRANCE)
7.7 MERCK & CO. INC. (USA)
7.8 NOVARTIS AG (SWITZERLAND)
7.9 PFIZER INC. (USA)
7.10 PROGENICS PHARMACEUTICALS INC. (USA)
7.11 SANOFI S.A. (FRANCE)
7.12 SOTIO BIOTECH (CZECH REPUBLIC)
7.13 SUN PHARMACEUTICAL INDUSTRIES LTD. (INDIA)
7.14 TEVA PHARMACEUTICAL INDUSTRIES LTD. (ISRAEL)
7.15 THERANOSTICS LTD. (UK)
7.16 Y-MABS THERAPEUTICS INC. (USA)
7.17 OTHER ACTIVE PLAYERS
Chapter 8: Global Neuroendocrine Tumor Treatment Market By Region
8.1 Overview
8.2. North America Neuroendocrine Tumor Treatment Market
8.2.1 Key Market Trends, Growth Factors and Opportunities
8.2.2 Top Key Companies
8.2.3 Historic and Forecasted Market Size by Segments
8.2.4 Historic and Forecasted Market Size By Drug Class
8.2.4.1 Somatostatin Analogs Chemotherapy Targeted Therapy Immunotherapy Others
8.2.5 Historic and Forecasted Market Size By Indication
8.2.5.1 Gastrointestinal NET Lung NET Pancreatic NET Others
8.2.6 Historic and Forecasted Market Size By Distribution Channel
8.2.6.1 Hospital Pharmacies Online Pharmacies Retail Pharmacies
8.2.7 Historic and Forecast Market Size by Country
8.2.7.1 US
8.2.7.2 Canada
8.2.7.3 Mexico
8.3. Eastern Europe Neuroendocrine Tumor Treatment Market
8.3.1 Key Market Trends, Growth Factors and Opportunities
8.3.2 Top Key Companies
8.3.3 Historic and Forecasted Market Size by Segments
8.3.4 Historic and Forecasted Market Size By Drug Class
8.3.4.1 Somatostatin Analogs Chemotherapy Targeted Therapy Immunotherapy Others
8.3.5 Historic and Forecasted Market Size By Indication
8.3.5.1 Gastrointestinal NET Lung NET Pancreatic NET Others
8.3.6 Historic and Forecasted Market Size By Distribution Channel
8.3.6.1 Hospital Pharmacies Online Pharmacies Retail Pharmacies
8.3.7 Historic and Forecast Market Size by Country
8.3.7.1 Russia
8.3.7.2 Bulgaria
8.3.7.3 The Czech Republic
8.3.7.4 Hungary
8.3.7.5 Poland
8.3.7.6 Romania
8.3.7.7 Rest of Eastern Europe
8.4. Western Europe Neuroendocrine Tumor Treatment Market
8.4.1 Key Market Trends, Growth Factors and Opportunities
8.4.2 Top Key Companies
8.4.3 Historic and Forecasted Market Size by Segments
8.4.4 Historic and Forecasted Market Size By Drug Class
8.4.4.1 Somatostatin Analogs Chemotherapy Targeted Therapy Immunotherapy Others
8.4.5 Historic and Forecasted Market Size By Indication
8.4.5.1 Gastrointestinal NET Lung NET Pancreatic NET Others
8.4.6 Historic and Forecasted Market Size By Distribution Channel
8.4.6.1 Hospital Pharmacies Online Pharmacies Retail Pharmacies
8.4.7 Historic and Forecast Market Size by Country
8.4.7.1 Germany
8.4.7.2 UK
8.4.7.3 France
8.4.7.4 The Netherlands
8.4.7.5 Italy
8.4.7.6 Spain
8.4.7.7 Rest of Western Europe
8.5. Asia Pacific Neuroendocrine Tumor Treatment Market
8.5.1 Key Market Trends, Growth Factors and Opportunities
8.5.2 Top Key Companies
8.5.3 Historic and Forecasted Market Size by Segments
8.5.4 Historic and Forecasted Market Size By Drug Class
8.5.4.1 Somatostatin Analogs Chemotherapy Targeted Therapy Immunotherapy Others
8.5.5 Historic and Forecasted Market Size By Indication
8.5.5.1 Gastrointestinal NET Lung NET Pancreatic NET Others
8.5.6 Historic and Forecasted Market Size By Distribution Channel
8.5.6.1 Hospital Pharmacies Online Pharmacies Retail Pharmacies
8.5.7 Historic and Forecast Market Size by Country
8.5.7.1 China
8.5.7.2 India
8.5.7.3 Japan
8.5.7.4 South Korea
8.5.7.5 Malaysia
8.5.7.6 Thailand
8.5.7.7 Vietnam
8.5.7.8 The Philippines
8.5.7.9 Australia
8.5.7.10 New Zealand
8.5.7.11 Rest of APAC
8.6. Middle East & Africa Neuroendocrine Tumor Treatment Market
8.6.1 Key Market Trends, Growth Factors and Opportunities
8.6.2 Top Key Companies
8.6.3 Historic and Forecasted Market Size by Segments
8.6.4 Historic and Forecasted Market Size By Drug Class
8.6.4.1 Somatostatin Analogs Chemotherapy Targeted Therapy Immunotherapy Others
8.6.5 Historic and Forecasted Market Size By Indication
8.6.5.1 Gastrointestinal NET Lung NET Pancreatic NET Others
8.6.6 Historic and Forecasted Market Size By Distribution Channel
8.6.6.1 Hospital Pharmacies Online Pharmacies Retail Pharmacies
8.6.7 Historic and Forecast Market Size by Country
8.6.7.1 Turkiye
8.6.7.2 Bahrain
8.6.7.3 Kuwait
8.6.7.4 Saudi Arabia
8.6.7.5 Qatar
8.6.7.6 UAE
8.6.7.7 Israel
8.6.7.8 South Africa
8.7. South America Neuroendocrine Tumor Treatment Market
8.7.1 Key Market Trends, Growth Factors and Opportunities
8.7.2 Top Key Companies
8.7.3 Historic and Forecasted Market Size by Segments
8.7.4 Historic and Forecasted Market Size By Drug Class
8.7.4.1 Somatostatin Analogs Chemotherapy Targeted Therapy Immunotherapy Others
8.7.5 Historic and Forecasted Market Size By Indication
8.7.5.1 Gastrointestinal NET Lung NET Pancreatic NET Others
8.7.6 Historic and Forecasted Market Size By Distribution Channel
8.7.6.1 Hospital Pharmacies Online Pharmacies Retail Pharmacies
8.7.7 Historic and Forecast Market Size by Country
8.7.7.1 Brazil
8.7.7.2 Argentina
8.7.7.3 Rest of SA
Chapter 9 Analyst Viewpoint and Conclusion
9.1 Recommendations and Concluding Analysis
9.2 Potential Market Strategies
Chapter 10 Research Methodology
10.1 Research Process
10.2 Primary Research
10.3 Secondary Research
|
Global Neuroendocrine Tumor Treatment Market |
|||
|
Base Year: |
2023 |
Forecast Period: |
2024-2032 |
|
Historical Data: |
2017 to 2023 |
Market Size in 2023: |
USD 3.26 Billion |
|
Forecast Period 2024-32 CAGR: |
6.4 % |
Market Size in 2032: |
USD 5.70 Billion |
|
Segments Covered: |
By Drug Class |
|
|
|
By Indication |
|
||
|
By Distribution Channel |
|
||
|
By Region |
|
||
|
Key Market Drivers: |
|
||
|
Key Market Restraints: |
|
||
|
Key Opportunities: |
|
||
|
Companies Covered in the report: |
|
||


