


Lighting as a Service Market Synopsis
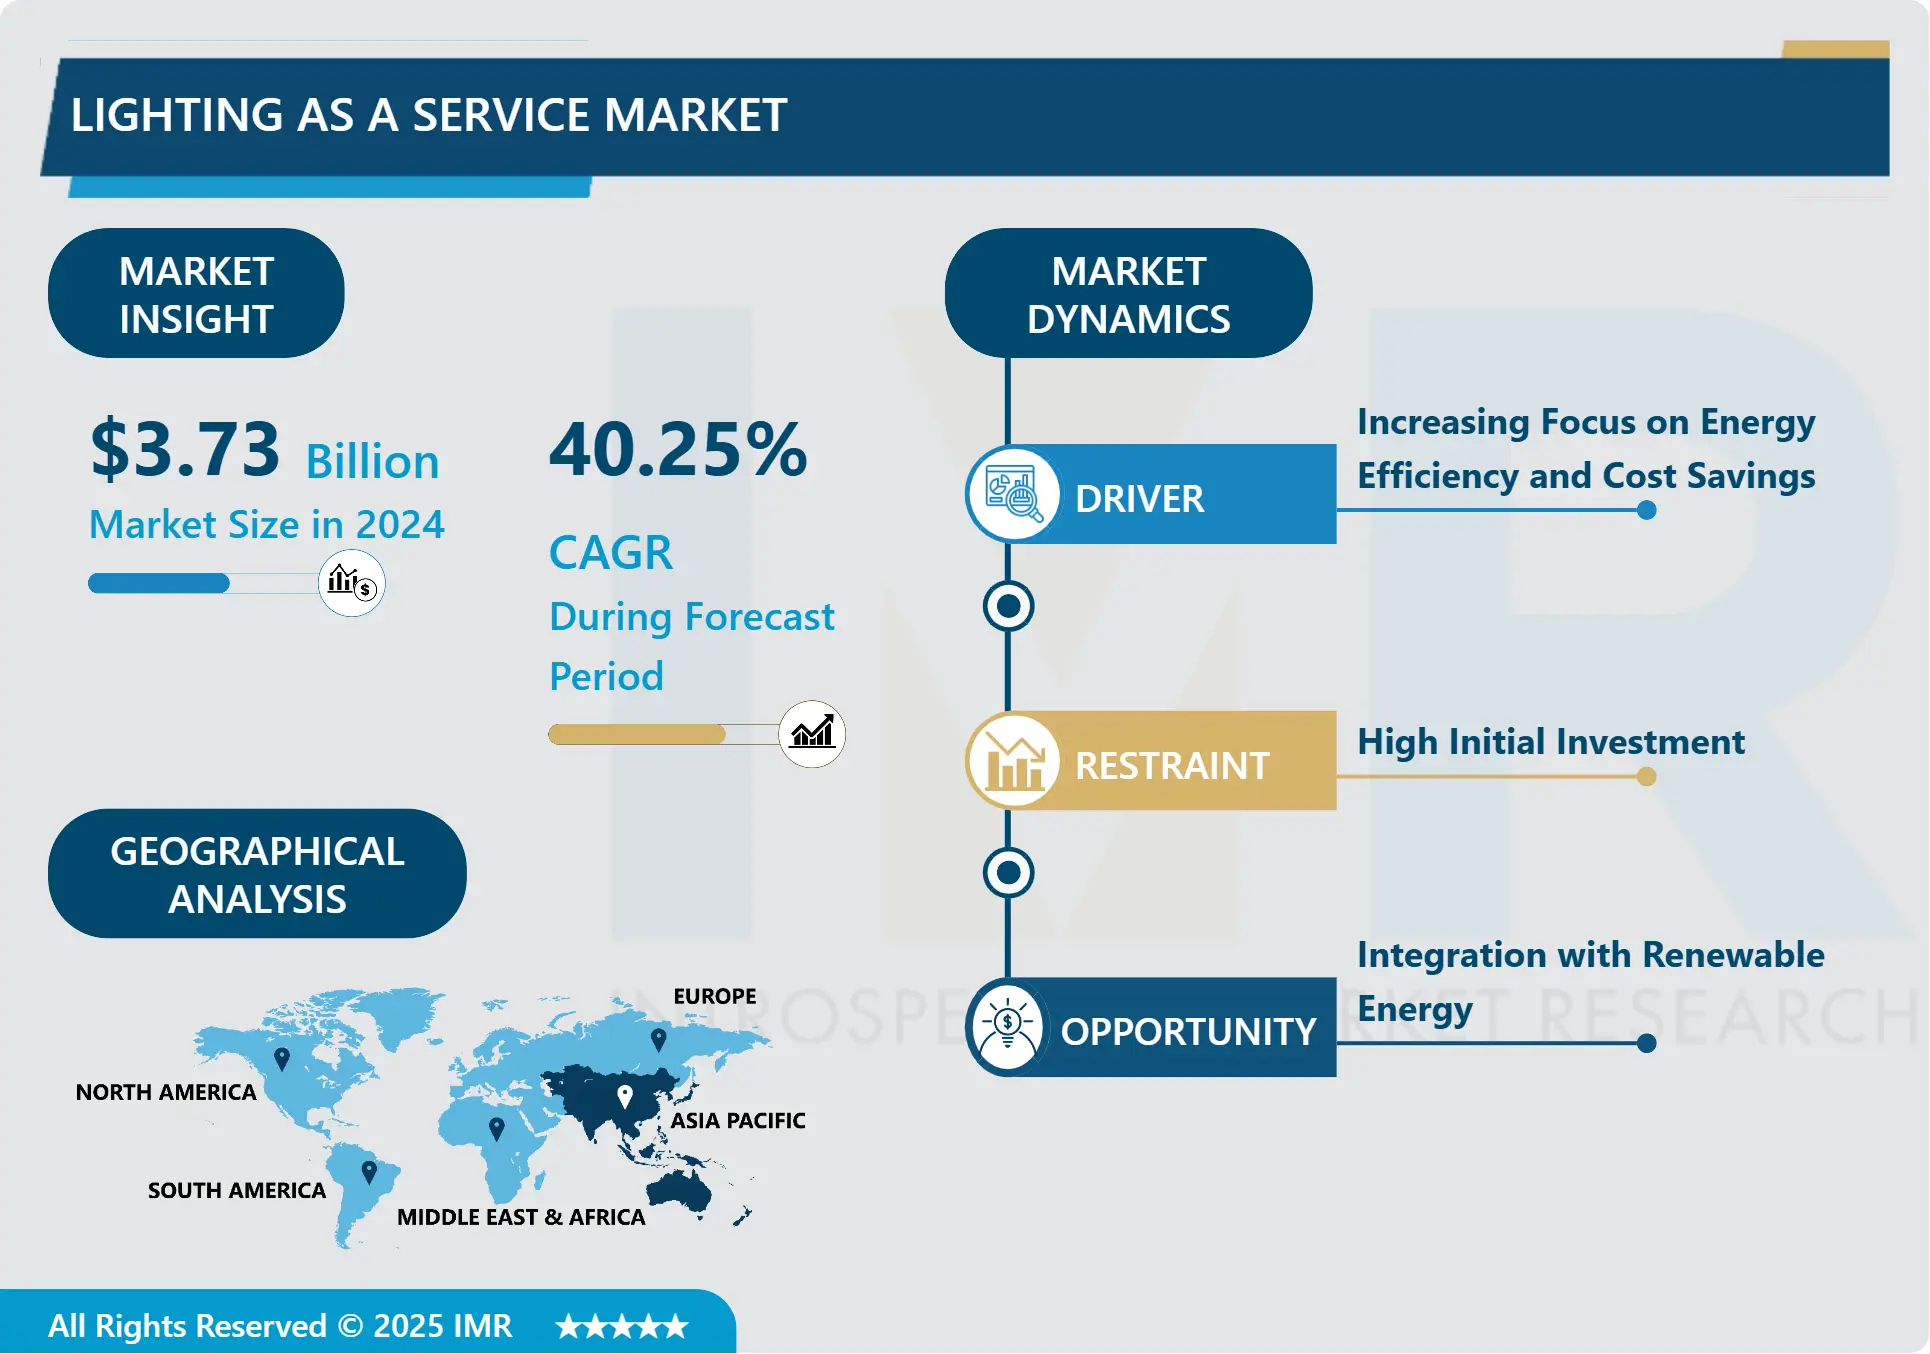
Lighting as a Service Market Size Was Valued at USD 3.73 Billion in 2024, and is Projected to Reach USD 55.85 Billion by 2032, Growing at a CAGR of 40.25% From 2025-2032.
Light as a service, or lighting as a service (LaaS), is a service-based business model in which light services are paid for via subscriptions rather than one-time payments. It is overseen by third parties, or more specifically, experts in the field, and may include lighting design, funding, installation, maintenance, and other services. Customers can use the model to outsource specific lighting tasks for a set period.
Lighting as a service provides businesses with cost-effective solutions to free up capital for other uses. The service accomplishes this while also saving money on energy by eliminating the need for routine maintenance on fixtures and lamps. The subscription-based service addresses all of a business's lighting needs. The entire building will have new, energy-efficient lighting installed at no upfront cost to the company.
The global lighting as a service market is rapidly expanding, attracting an increasing number of lighting companies, IT integrators, and facility management service providers seeking to capture the new market by refining their business models to "as a service" offerings, as well as through mergers, collaborations, and partnerships.
There is a growing global demand for energy efficiency, which creates market opportunities. LED lights consume less energy and produce brighter, clearer light without the flicker that frequently irritates the optic nerve, resulting in employee complaints of headaches and fatigue. Furthermore, LED lights contain no hazardous materials, do not flicker or strobe, and are fully recyclable.

Lighting as a Service Market Trend Analysis
Increasing Focus on Energy Efficiency and Cost Savings
- Rising energy costs affect households, businesses, and governments equally, regardless of the source (electricity, fossil fuels, or other energy sources). This encourages the search for more cost-effective alternatives to current energy sources, as well as ways to reduce consumption. People and organizations are under increasing pressure to implement energy-efficient practices as environmental awareness of the effects of energy consumption grows.
- LaaS providers provide lighting solutions that use energy-efficient LED (Light Emitting Diode) technology, which uses significantly less electricity than traditional lighting systems like incandescent or fluorescent bulbs. LEDs are known for their high efficiency, long lifespan, and superior light quality, making them a popular choice for businesses looking to reduce energy consumption and operational costs.
- Renewable energy, smart grids, and energy-efficient appliances are all examples of innovations that offer new ways to reduce energy consumption while increasing output. These advancements enable both large-scale infrastructure changes and individual consumer choices. Aside from environmental concerns, energy efficiency can often result in direct cost savings. Businesses can increase profitability by lowering operational costs, whereas individuals can lower their utility bills and free up funds for other purposes.
Integration with Renewable Energy
- The process of integrating renewable energy sources into the electrical grid is known as renewable integration. Renewable energy sources have the potential to produce enough energy to power a clean future by utilizing self-replenishing resources like sunshine, wind, and water. Baseload power requirements, or the least amount of power the grid needs at any given time, can be met by renewable energy sources like geothermal and water.
- These renewable energy sources operate similarly to fossil fuel plants, delivering consistent electricity in response to changing consumer demands. They support distributed energy systems that reduce grid power demand, lower costs, and improve the reliability and security of critical infrastructure like hospitals. Carbon emissions drive climate change—predicted to increase global temperatures by up to 2 degrees Celsius. The use of more renewable energy sources is critical to achieving a zero-carbon future.
- Integrating renewable energy sources into lightning as a service (LaaS) has several advantages, including cost savings, environmental sustainability, and resilience to power outages. Businesses and communities that incorporate renewable energy sources into LaaS can reduce their carbon footprint while also benefiting from long-term cost savings and resilience to energy disruptions. This approach is consistent with the broader trend toward sustainable and smart infrastructure solutions.
Lighting as a Service Market Segment Analysis:
Lighting as a Service Market Segmented on the basis of Component, Technology, Installation, and end-users.
By Technology, LED LaaS segment is expected to dominate the market during the forecast period
- LED (Light Emitting Diode) technology has a significant energy efficiency advantage over traditional lighting sources like incandescent and fluorescent bulbs. LEDs require significantly less energy to produce the same amount of light, resulting in lower electricity bills for LaaS customers. This cost-saving benefit is especially appealing to businesses that want to cut operating costs and improve their bottom line.
- LED lighting is more durable and long-lasting than traditional lighting options. LEDs have a much longer lifespan, often lasting tens of thousands of hours before requiring replacement, whereas incandescent and fluorescent bulbs are frequently replaced due to filament or gas tube failures. This reduced need for maintenance translates into lower maintenance costs and less downtime for businesses, adding to the appeal of LED lighting in LaaS applications.
- Advances in LED chip design, optics, and thermal management have resulted in brighter, more efficient, and customisable lighting options. LEDs can now provide a wide range of colour temperatures, dimming capabilities, and smart control options, allowing businesses to customize their lighting environments to meet specific needs and preferences.
By End-User, the Commercial segment held the largest share
- Commercial establishments, such as office buildings, retail stores, and hotels, require extensive lighting to ensure customer and employee visibility, safety, and ambiance. These businesses frequently operate during extended hours, necessitating dependable and efficient lighting solutions to maintain productivity and attract customers. LaaS provides commercial entities with a cost-effective and hassle-free alternative to traditional lighting ownership, enabling them to focus on their core operations while outsourcing lighting management to service providers.
- To reduce operating costs and comply with regulatory requirements, the commercial sector is increasingly prioritizing sustainability and energy efficiency. LaaS providers provide energy-efficient lighting solutions, such as LED fixtures and smart controls, that can significantly reduce energy consumption and carbon emissions when compared to traditional lighting systems. This aligns with many commercial enterprises' sustainability goals and enables them to demonstrate their environmental stewardship to customers, investors, and stakeholders.
- According to the graph, annual investment in energy efficiency in the building sector has been consistently increasing. Europe has consistently dominated the market, with a steady increase from 91.3 units in 2020 to 151 units in 2022. The United States and China have relatively stable shares, whereas the "Other" category fluctuates, indicating a dynamic market landscape across regions during this period.
Lighting as a Service Market Regional Insights:
Asia Pacific is Expected to Dominate the Market Over the Forecast Period
- The Asia Pacific region produces and exports fluorescent and LED lighting products. As a major producer and exporter of LED and fluorescent lighting, phasing out fluorescents would not only provide a safer and more affordable lighting option in Asia but also contribute to the global shift towards clean lighting. The region is rapidly urbanizing and industrializing, resulting in increased demand for lighting solutions in a variety of sectors, including commercial, residential, and industrial.
- This creates a strong demand for environmentally friendly and energy-efficient lighting solutions, making LaaS an attractive option. Numerous Asian governments are enacting laws and incentives to encourage the development of smart cities and energy efficiency. This includes stricter energy regulations, as well as incentives for implementing LaaS solutions and LED lighting. The climate created by these initiatives promotes the growth of the LaaS market.
- The Asia-Pacific region has a large and diverse market for lighting services, covering a wide range of industries and applications. With rising awareness of the benefits of LaaS, combined with favorable market conditions and supportive government policies, the Asia-Pacific region is expected to remain the fastest-growing market for lighting as a service for the foreseeable future.
Lighting as a Service Market Top Key Players:
- Future Energy Solutions (US)
- GE Lighting (US)
- FSG Electric & Lighting (US)
- Lunera Lighting (US)
- Wolfspeed (US)
- Mysupplier (US)
- SIB Lighting (US)
- Cree Inc. (US)
- Osram (Germany)
- TRILUX (Germany)
- Designing Buildings (UK)
- Airis Energy (UK)
- EGG Lighting (UK)
- Signify (Netherlands)
- Eaton (Ireland)
- ESB Corporate (Ireland)
- Zumtobel Group (Austria)
- Arquiled (Portugal)
- TellCo Europe (Switzerland)
- Arc Renewables (India)
- Energized Solutions (India)
- Centropi (Singapore)
- Itelecom (Chile), and other Active players
Key Industry Developments in the Lighting as a Service Market:
- In October 2023, Facility Solutions Group, Inc. (FSG) acquired Lighting Management, Inc. (LMI), which is based in Valley Cottage, New York. With offices in North Carolina, South Carolina, and Florida, this acquisition enables FSG to broaden its lighting service offerings nationwide.
- In January 2023, signify partners with FINISH Society to illuminate 20 primary health centers in Rajasthan. Under this project, which was carried out in collaboration with FINISH Society, the company installed 2.5 KW solar power plants in each health center to ensure continuous and uninterrupted access to lighting, thereby improving the healthcare services available to residents.
|
Global Lighting as a Service Market |
|||
|
Base Year: |
2024 |
Forecast Period: |
2025-2032 |
|
Historical Data: |
2018 to 2023 |
Market Size in 2024: |
USD 3.73 Bn. |
|
Forecast Period 2025-32 CAGR: |
40.25 % |
Market Size in 2030: |
USD 55.85 Bn. |
|
Segments Covered: |
By Component |
|
|
|
By Technology |
|
||
|
By Installation |
|
||
|
By End-User |
|
||
|
By Region |
|
||
|
Key Market Drivers: |
|
||
|
Key Market Restraints: |
|
||
|
Key Opportunities: |
|
||
|
Companies Covered in the report: |
|
||
Chapter 1: Introduction
1.1 Scope and Coverage
Chapter 2:Executive Summary
Chapter 3: Market Landscape
3.1 Market Dynamics
3.1.1 Drivers
3.1.2 Restraints
3.1.3 Opportunities
3.1.4 Challenges
3.2 Market Trend Analysis
3.3 PESTLE Analysis
3.4 Porter's Five Forces Analysis
3.5 Industry Value Chain Analysis
3.6 Ecosystem
3.7 Regulatory Landscape
3.8 Price Trend Analysis
3.9 Patent Analysis
3.10 Technology Evolution
3.11 Investment Pockets
3.12 Import-Export Analysis
Chapter 4: Lighting as a Service Market by Component (2018-2032)
4.1 Lighting as a Service Market Snapshot and Growth Engine
4.2 Market Overview
4.3 Luminaries and Controls
4.3.1 Introduction and Market Overview
4.3.2 Historic and Forecasted Market Size in Value USD and Volume Units
4.3.3 Key Market Trends, Growth Factors, and Opportunities
4.3.4 Geographic Segmentation Analysis
4.4 Software and communication systems
4.5 Service
Chapter 5: Lighting as a Service Market by Technology (2018-2032)
5.1 Lighting as a Service Market Snapshot and Growth Engine
5.2 Market Overview
5.3 LED LaaS
5.3.1 Introduction and Market Overview
5.3.2 Historic and Forecasted Market Size in Value USD and Volume Units
5.3.3 Key Market Trends, Growth Factors, and Opportunities
5.3.4 Geographic Segmentation Analysis
5.4 Connected LaaS
5.5 Solar-powered LaaS
Chapter 6: Lighting as a Service Market by Installation (2018-2032)
6.1 Lighting as a Service Market Snapshot and Growth Engine
6.2 Market Overview
6.3 Indoor LaaS
6.3.1 Introduction and Market Overview
6.3.2 Historic and Forecasted Market Size in Value USD and Volume Units
6.3.3 Key Market Trends, Growth Factors, and Opportunities
6.3.4 Geographic Segmentation Analysis
6.4 Outdoor LaaS
Chapter 7: Lighting as a Service Market by End-User (2018-2032)
7.1 Lighting as a Service Market Snapshot and Growth Engine
7.2 Market Overview
7.3 Commercial LaaS
7.3.1 Introduction and Market Overview
7.3.2 Historic and Forecasted Market Size in Value USD and Volume Units
7.3.3 Key Market Trends, Growth Factors, and Opportunities
7.3.4 Geographic Segmentation Analysis
7.4 Industrial LaaS
7.5 Municipal LaaS
7.6 Residential LaaS
Chapter 8: Company Profiles and Competitive Analysis
8.1 Competitive Landscape
8.1.1 Competitive Benchmarking
8.1.2 Lighting as a Service Market Share by Manufacturer (2024)
8.1.3 Industry BCG Matrix
8.1.4 Heat Map Analysis
8.1.5 Mergers and Acquisitions
8.2 APPLE (US)
8.2.1 Company Overview
8.2.2 Key Executives
8.2.3 Company Snapshot
8.2.4 Role of the Company in the Market
8.2.5 Sustainability and Social Responsibility
8.2.6 Operating Business Segments
8.2.7 Product Portfolio
8.2.8 Business Performance
8.2.9 Key Strategic Moves and Recent Developments
8.2.10 SWOT Analysis
8.3 HEWLETT PACKARD (US)
8.4 LENOVO (CHINA)
8.5 DELL TECHNOLOGIES (US)
8.6 COMPUTACENTER (UK)
8.7 MICROSOFT (US)
8.8 CISCO (US)
8.9 COMPUCOM (US)
8.10 3STEPIT (FINLAND)
8.11 TELIA COMPANY (SWEDEN)
8.12 CHG MERIDIAN (GERMANY)
8.13 ATEA GLOBAL SERVICES (LATVIA)
8.14 CSI LEASING (US)
8.15 ECONOCOM (FRANCE)
8.16 GREENFLEX (FRANCE)
8.17 GRENKE (GERMANY)
8.18 EXCELLENCE IT (UK)
8.19 FOXWAY (SWEDEN)
8.20 OTHER KEY PLAYERS
8.21
Chapter 9: Global Lighting as a Service Market By Region
9.1 Overview
9.2. North America Lighting as a Service Market
9.2.1 Key Market Trends, Growth Factors and Opportunities
9.2.2 Top Key Companies
9.2.3 Historic and Forecasted Market Size by Segments
9.2.4 Historic and Forecasted Market Size by Component
9.2.4.1 Luminaries and Controls
9.2.4.2 Software and communication systems
9.2.4.3 Service
9.2.5 Historic and Forecasted Market Size by Technology
9.2.5.1 LED LaaS
9.2.5.2 Connected LaaS
9.2.5.3 Solar-powered LaaS
9.2.6 Historic and Forecasted Market Size by Installation
9.2.6.1 Indoor LaaS
9.2.6.2 Outdoor LaaS
9.2.7 Historic and Forecasted Market Size by End-User
9.2.7.1 Commercial LaaS
9.2.7.2 Industrial LaaS
9.2.7.3 Municipal LaaS
9.2.7.4 Residential LaaS
9.2.8 Historic and Forecast Market Size by Country
9.2.8.1 US
9.2.8.2 Canada
9.2.8.3 Mexico
9.3. Eastern Europe Lighting as a Service Market
9.3.1 Key Market Trends, Growth Factors and Opportunities
9.3.2 Top Key Companies
9.3.3 Historic and Forecasted Market Size by Segments
9.3.4 Historic and Forecasted Market Size by Component
9.3.4.1 Luminaries and Controls
9.3.4.2 Software and communication systems
9.3.4.3 Service
9.3.5 Historic and Forecasted Market Size by Technology
9.3.5.1 LED LaaS
9.3.5.2 Connected LaaS
9.3.5.3 Solar-powered LaaS
9.3.6 Historic and Forecasted Market Size by Installation
9.3.6.1 Indoor LaaS
9.3.6.2 Outdoor LaaS
9.3.7 Historic and Forecasted Market Size by End-User
9.3.7.1 Commercial LaaS
9.3.7.2 Industrial LaaS
9.3.7.3 Municipal LaaS
9.3.7.4 Residential LaaS
9.3.8 Historic and Forecast Market Size by Country
9.3.8.1 Russia
9.3.8.2 Bulgaria
9.3.8.3 The Czech Republic
9.3.8.4 Hungary
9.3.8.5 Poland
9.3.8.6 Romania
9.3.8.7 Rest of Eastern Europe
9.4. Western Europe Lighting as a Service Market
9.4.1 Key Market Trends, Growth Factors and Opportunities
9.4.2 Top Key Companies
9.4.3 Historic and Forecasted Market Size by Segments
9.4.4 Historic and Forecasted Market Size by Component
9.4.4.1 Luminaries and Controls
9.4.4.2 Software and communication systems
9.4.4.3 Service
9.4.5 Historic and Forecasted Market Size by Technology
9.4.5.1 LED LaaS
9.4.5.2 Connected LaaS
9.4.5.3 Solar-powered LaaS
9.4.6 Historic and Forecasted Market Size by Installation
9.4.6.1 Indoor LaaS
9.4.6.2 Outdoor LaaS
9.4.7 Historic and Forecasted Market Size by End-User
9.4.7.1 Commercial LaaS
9.4.7.2 Industrial LaaS
9.4.7.3 Municipal LaaS
9.4.7.4 Residential LaaS
9.4.8 Historic and Forecast Market Size by Country
9.4.8.1 Germany
9.4.8.2 UK
9.4.8.3 France
9.4.8.4 The Netherlands
9.4.8.5 Italy
9.4.8.6 Spain
9.4.8.7 Rest of Western Europe
9.5. Asia Pacific Lighting as a Service Market
9.5.1 Key Market Trends, Growth Factors and Opportunities
9.5.2 Top Key Companies
9.5.3 Historic and Forecasted Market Size by Segments
9.5.4 Historic and Forecasted Market Size by Component
9.5.4.1 Luminaries and Controls
9.5.4.2 Software and communication systems
9.5.4.3 Service
9.5.5 Historic and Forecasted Market Size by Technology
9.5.5.1 LED LaaS
9.5.5.2 Connected LaaS
9.5.5.3 Solar-powered LaaS
9.5.6 Historic and Forecasted Market Size by Installation
9.5.6.1 Indoor LaaS
9.5.6.2 Outdoor LaaS
9.5.7 Historic and Forecasted Market Size by End-User
9.5.7.1 Commercial LaaS
9.5.7.2 Industrial LaaS
9.5.7.3 Municipal LaaS
9.5.7.4 Residential LaaS
9.5.8 Historic and Forecast Market Size by Country
9.5.8.1 China
9.5.8.2 India
9.5.8.3 Japan
9.5.8.4 South Korea
9.5.8.5 Malaysia
9.5.8.6 Thailand
9.5.8.7 Vietnam
9.5.8.8 The Philippines
9.5.8.9 Australia
9.5.8.10 New Zealand
9.5.8.11 Rest of APAC
9.6. Middle East & Africa Lighting as a Service Market
9.6.1 Key Market Trends, Growth Factors and Opportunities
9.6.2 Top Key Companies
9.6.3 Historic and Forecasted Market Size by Segments
9.6.4 Historic and Forecasted Market Size by Component
9.6.4.1 Luminaries and Controls
9.6.4.2 Software and communication systems
9.6.4.3 Service
9.6.5 Historic and Forecasted Market Size by Technology
9.6.5.1 LED LaaS
9.6.5.2 Connected LaaS
9.6.5.3 Solar-powered LaaS
9.6.6 Historic and Forecasted Market Size by Installation
9.6.6.1 Indoor LaaS
9.6.6.2 Outdoor LaaS
9.6.7 Historic and Forecasted Market Size by End-User
9.6.7.1 Commercial LaaS
9.6.7.2 Industrial LaaS
9.6.7.3 Municipal LaaS
9.6.7.4 Residential LaaS
9.6.8 Historic and Forecast Market Size by Country
9.6.8.1 Turkiye
9.6.8.2 Bahrain
9.6.8.3 Kuwait
9.6.8.4 Saudi Arabia
9.6.8.5 Qatar
9.6.8.6 UAE
9.6.8.7 Israel
9.6.8.8 South Africa
9.7. South America Lighting as a Service Market
9.7.1 Key Market Trends, Growth Factors and Opportunities
9.7.2 Top Key Companies
9.7.3 Historic and Forecasted Market Size by Segments
9.7.4 Historic and Forecasted Market Size by Component
9.7.4.1 Luminaries and Controls
9.7.4.2 Software and communication systems
9.7.4.3 Service
9.7.5 Historic and Forecasted Market Size by Technology
9.7.5.1 LED LaaS
9.7.5.2 Connected LaaS
9.7.5.3 Solar-powered LaaS
9.7.6 Historic and Forecasted Market Size by Installation
9.7.6.1 Indoor LaaS
9.7.6.2 Outdoor LaaS
9.7.7 Historic and Forecasted Market Size by End-User
9.7.7.1 Commercial LaaS
9.7.7.2 Industrial LaaS
9.7.7.3 Municipal LaaS
9.7.7.4 Residential LaaS
9.7.8 Historic and Forecast Market Size by Country
9.7.8.1 Brazil
9.7.8.2 Argentina
9.7.8.3 Rest of SA
Chapter 10 Analyst Viewpoint and Conclusion
10.1 Recommendations and Concluding Analysis
10.2 Potential Market Strategies
Chapter 11 Research Methodology
11.1 Research Process
11.2 Primary Research
11.3 Secondary Research
|
Global Lighting as a Service Market |
|||
|
Base Year: |
2024 |
Forecast Period: |
2025-2032 |
|
Historical Data: |
2018 to 2023 |
Market Size in 2024: |
USD 3.73 Bn. |
|
Forecast Period 2025-32 CAGR: |
40.25 % |
Market Size in 2030: |
USD 55.85 Bn. |
|
Segments Covered: |
By Component |
|
|
|
By Technology |
|
||
|
By Installation |
|
||
|
By End-User |
|
||
|
By Region |
|
||
|
Key Market Drivers: |
|
||
|
Key Market Restraints: |
|
||
|
Key Opportunities: |
|
||
|
Companies Covered in the report: |
|
||


