


Global Food Leavening Agent Market Overview
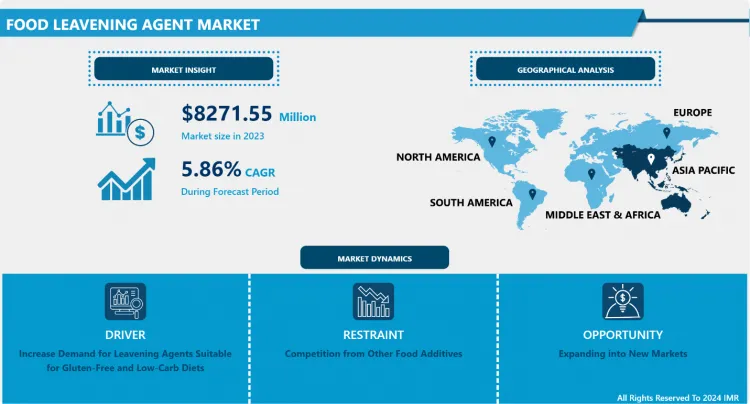
Global Food Leavening Agent Market size is expected to grow from USD 8271.55 Million in 2023 to USD 13809.37 Million by 2032, at a CAGR of 5.86% during the forecast period (2024-2032).
A leavening agent is a substance that produces carbon dioxide gas in food, causing it to rise and become light and fluffy. They are essential ingredients in baked goods such as bread, cakes, cookies, and pastries. Leavening agents produce carbon dioxide gas, which gets trapped in the dough or batter and causes it to rise. The gas is produced through a chemical reaction, either between an acid and a base or through yeast fermentation.
Food leavening agents, like baking powder, baking soda, and yeast, are essential in the culinary world for transforming raw ingredients into delicious dishes. They contribute to the leavening process, achieving the desired texture, volume, and flavour in various food products. They are primarily used in baking, facilitating dough rise for soft, fluffy bread, cakes, and pastries. They also play a role in pancakes, pizza dough, and batter-based dishes, ensuring a light and airy composition. Their influence extends to both household and industrial-scale food production, showcasing their versatility and significance in the culinary world.
Leavening agents are essential in food recipes for creating a pleasing texture and enhancing the taste profile and physical characteristics of food items. They also enable the fermentation process, imparting unique flavours and aiding in digestion, potentially improving the nutritional quality of the final product. In the dynamic food industry, leavening agents are not just functional components but also essential contributors to the sensory experience, making them indispensable for chefs, bakers, and food manufacturers.
Leavening agents are increasingly used in contemporary culinary practices, ranging from gluten-free baking to molecular gastronomy. These agents cater to evolving consumer preferences and dietary trends, offering healthier alternatives. The exploration of organic leavening sources and the development of organic options have led to the development of organic options. As consumer expectations and tastes evolve, leavening agents remain essential in gastronomy, shaping the texture and taste of various dishes.

Food Leavening Agent Market Trend Analysis:
Increase Demand for Leavening Agents Suitable for Gluten-Free and Low-Carb Diets
-
The food leavening agent market is growing due to the growing demand for leavening agents suitable for gluten-free and low-carb diets. Consumers are seeking alternatives that align with their dietary preferences, as traditional leavening agents may contain gluten or have a higher carbohydrate content, making them less suitable for these diets.
-
Consumer behaviour has led to a market demand for specialized leavening agents that cater to dietary needs. Manufacturers have developed innovative leavening agents that are gluten-free and low-carb, allowing individuals with dietary restrictions to enjoy a wider range of baked goods without compromising on taste, texture, or dietary goals.
-
The demand for gluten-free and low-carb leavening agents is on the rise due to health-conscious consumers' preference for healthier eating habits. This has created opportunities for companies in the food-leaving agent market to cater to specific dietary needs. The adaptation of leavening agents to meet the needs of gluten-free and low-carb diets reflects a strategic response to changing consumer dynamics, contributing significantly to the market's expansion.
Expanding into New Markets
-
The Food leavening Agent market is experiencing growth due to globalization connecting diverse culinary traditions and preferences. The demand for leavening agents in regions using alternative methods of food preparation is increasing, providing an opportunity for market players to tap into new and emerging markets and offer their products to a broader consumer base.
-
The increasing urbanization and preference for convenience foods in developing economies, coupled with rising disposable income, presents an ideal environment for the introduction of leavening agents. As consumers become more experimental and adopt international food trends, there is a growing demand for leavening agents commonly used in Western-style baking.
-
Expanding into new markets allows companies to diversify their consumer base and reduce dependency on specific regions. Strategic entry requires understanding local preferences, cultural gradations, and regulatory landscapes. Companies can tailor marketing strategies and product formulations to align with unique tastes and dietary habits. Global expansion contributes to growth and fosters culinary tradition exchange, creating a dynamic food industry. The prospect of introducing established or innovative leavening agents to new markets highlights the adaptability and versatility of these products in meeting diverse consumer needs.
Food Leavening Agent Market Segment Analysis:
Food Leavening Agent Market Segmented on the basis of Type, Form, Application, and Distribution Channel
By Type, Baking powder segment is expected to dominate the market during the forecast period
-
Baking powder is a crucial chemical leavening agent in the food industry, facilitating dough rise and expansion for baked goods. Its composition consists of an acid and a base, releasing carbon dioxide, resulting in a leavening effect. Baking powder's popularity across diverse cuisines and consumer preferences makes it a staple in both household kitchens and industrial food production. The consistent demand for this essential leavening agent highlights its significance in the global food market, making it a vital component in the culinary world.
Food Leavening Agent Market Regional Insights:
Asia-Pacific is Expected to Dominate the Market Over the Forecast Period
-
The Asia-Pacific region is experiencing a surge in demand for convenient and processed food products, including baked goods, due to factors such as urbanization, changing lifestyles, and the rising middle-class population. This has led to increased spending on premium and convenience food items, often incorporating leavening agents. The globalization of food preferences and Western culinary trends have also increased the consumption of bakery products, driving the demand for leavening agents. The Asia-Pacific region's population size, particularly in countries like China and India, makes it a significant market for various food products. However, the dominance of any region in the Food Leavening Agent market is subject to change due to factors such as economic conditions, cultural preferences, and consumer behaviour.
Key Players Covered in the Food Leavening Agent Market:
- Angel (China)
- Forise Yeast (China)
- Sunkeen (China)
- Vitality King (China)
- Hongxing (China)
- Xiaguang (China)
- Rongda (China)
- Haiweili (China)
- Noah Technologies (China)
- Berun (China)
- Yuhua Chemical (China)
- Asahi (Japan)
- Tosoh (Japan)
- Tata Chemicals (India)
- Blue Bird Foods India Pvt. Ltd. (India)
- Weikfield Products Private Limited (India)
- Kudos Blends Limited (India)
- Tronox (South Africa)
- Hansells Food Group Limited (New Zealand)
- Ward Mckenzie Pty Ltd. (Australia)
- Eagle International (U.S.)
- Clabber Girl Corporation (U.S.)
- Kraft Foods Group Inc. (U.S.)
- Church & Dwight (U.S.)
- Natural Soda (U.S.)
- Lallemand (Canada)
- DSM (Netherlands)
- AB Mauri (UK)
- Lesaffre (France)
- Solvay (Belgium), and Other Major Players
Key Industry Developments in Food Leavening Agent Market:
-
In September 2023, Lesaffre and Yeap were pleased to announce that Lesaffre has made a 10% investment in Yeap to help it finalize the development of a promising new protein ingredient made from upcycled yeast. Through this investment, Yeap becomes one of Lesaffre’s partners in bringing new ground-breaking, functional, alternative proteins to the market.
|
Global Food Leavening Agent Market |
|||
|
Base Year: |
2023 |
Forecast Period: |
2024-2032 |
|
Historical Data: |
2017 to 2023 |
Market Size in 2023: |
USD 8271.55 Mn. |
|
Forecast Period 2024-32 CAGR: |
5.86% |
Market Size in 2032: |
USD 13809.37 Mn. |
|
Segments Covered: |
By Type |
|
|
|
By Form |
|
||
|
By Application |
|
||
|
By Distribution Channel |
|
||
|
By Region |
|
||
|
Key Market Drivers: |
|
||
|
Key Market Restraints: |
|
||
|
Key Opportunities: |
|
||
|
Companies Covered in the report: |
|
||
Chapter 1: Introduction
1.1 Scope and Coverage
Chapter 2:Executive Summary
Chapter 3: Market Landscape
3.1 Market Dynamics
3.1.1 Drivers
3.1.2 Restraints
3.1.3 Opportunities
3.1.4 Challenges
3.2 Market Trend Analysis
3.3 PESTLE Analysis
3.4 Porter's Five Forces Analysis
3.5 Industry Value Chain Analysis
3.6 Ecosystem
3.7 Regulatory Landscape
3.8 Price Trend Analysis
3.9 Patent Analysis
3.10 Technology Evolution
3.11 Investment Pockets
3.12 Import-Export Analysis
Chapter 4: Food Leavening Agent Market by Type (2018-2032)
4.1 Food Leavening Agent Market Snapshot and Growth Engine
4.2 Market Overview
4.3 Yeast
4.3.1 Introduction and Market Overview
4.3.2 Historic and Forecasted Market Size in Value USD and Volume Units
4.3.3 Key Market Trends, Growth Factors, and Opportunities
4.3.4 Geographic Segmentation Analysis
4.4 Baking powder
4.5 Baking soda
Chapter 5: Food Leavening Agent Market by Form (2018-2032)
5.1 Food Leavening Agent Market Snapshot and Growth Engine
5.2 Market Overview
5.3 Dry
5.3.1 Introduction and Market Overview
5.3.2 Historic and Forecasted Market Size in Value USD and Volume Units
5.3.3 Key Market Trends, Growth Factors, and Opportunities
5.3.4 Geographic Segmentation Analysis
5.4 Wet
Chapter 6: Food Leavening Agent Market by Application (2018-2032)
6.1 Food Leavening Agent Market Snapshot and Growth Engine
6.2 Market Overview
6.3 Bread
6.3.1 Introduction and Market Overview
6.3.2 Historic and Forecasted Market Size in Value USD and Volume Units
6.3.3 Key Market Trends, Growth Factors, and Opportunities
6.3.4 Geographic Segmentation Analysis
6.4 Cake
6.5 Biscuit
6.6 Steamed bread
Chapter 7: Food Leavening Agent Market by Distribution Channel (2018-2032)
7.1 Food Leavening Agent Market Snapshot and Growth Engine
7.2 Market Overview
7.3 Supermarkets/hypermarket
7.3.1 Introduction and Market Overview
7.3.2 Historic and Forecasted Market Size in Value USD and Volume Units
7.3.3 Key Market Trends, Growth Factors, and Opportunities
7.3.4 Geographic Segmentation Analysis
7.4 Convenience stores
7.5 Specialty food stores
7.6 E-commerce
Chapter 8: Company Profiles and Competitive Analysis
8.1 Competitive Landscape
8.1.1 Competitive Benchmarking
8.1.2 Food Leavening Agent Market Share by Manufacturer (2024)
8.1.3 Industry BCG Matrix
8.1.4 Heat Map Analysis
8.1.5 Mergers and Acquisitions
8.2 CAPSOVISION (U.S)
8.2.1 Company Overview
8.2.2 Key Executives
8.2.3 Company Snapshot
8.2.4 Role of the Company in the Market
8.2.5 Sustainability and Social Responsibility
8.2.6 Operating Business Segments
8.2.7 Product Portfolio
8.2.8 Business Performance
8.2.9 Key Strategic Moves and Recent Developments
8.2.10 SWOT Analysis
8.3 BOSTON SCIENTIFIC CORPORATION (U.S)
8.4 NORTHSIDE GASTROENTEROLOGY ENDOSCOPY CENTER
8.5 LLC (U.S.)
8.6 INTERSCOPE INC. (U.S.)
8.7 ANX ROBOTICA (U.S.)
8.8 MEDTRONIC PLC (IRELAND)
8.9 INTROMEDIC COLTD. (SOUTH KOREA)
8.10 CHONGQING JINSHAN SCIENCE & TECHNOLOGY (GROUP) COLTD. (CHINA)
8.11 SHANGXIAN MINIMAL INVASIVE INC. (CHINA)
8.12 FUJIFILM HOLDINGS CORPORATION (JAPAN)
8.13 OLYMPUS CORPORATION (JAPAN)
8.14 RF SYSTEM LAB COLTD. (JAPAN)
8.15 CHECK CAP (ISRAEL)
Chapter 9: Global Food Leavening Agent Market By Region
9.1 Overview
9.2. North America Food Leavening Agent Market
9.2.1 Key Market Trends, Growth Factors and Opportunities
9.2.2 Top Key Companies
9.2.3 Historic and Forecasted Market Size by Segments
9.2.4 Historic and Forecasted Market Size by Type
9.2.4.1 Yeast
9.2.4.2 Baking powder
9.2.4.3 Baking soda
9.2.5 Historic and Forecasted Market Size by Form
9.2.5.1 Dry
9.2.5.2 Wet
9.2.6 Historic and Forecasted Market Size by Application
9.2.6.1 Bread
9.2.6.2 Cake
9.2.6.3 Biscuit
9.2.6.4 Steamed bread
9.2.7 Historic and Forecasted Market Size by Distribution Channel
9.2.7.1 Supermarkets/hypermarket
9.2.7.2 Convenience stores
9.2.7.3 Specialty food stores
9.2.7.4 E-commerce
9.2.8 Historic and Forecast Market Size by Country
9.2.8.1 US
9.2.8.2 Canada
9.2.8.3 Mexico
9.3. Eastern Europe Food Leavening Agent Market
9.3.1 Key Market Trends, Growth Factors and Opportunities
9.3.2 Top Key Companies
9.3.3 Historic and Forecasted Market Size by Segments
9.3.4 Historic and Forecasted Market Size by Type
9.3.4.1 Yeast
9.3.4.2 Baking powder
9.3.4.3 Baking soda
9.3.5 Historic and Forecasted Market Size by Form
9.3.5.1 Dry
9.3.5.2 Wet
9.3.6 Historic and Forecasted Market Size by Application
9.3.6.1 Bread
9.3.6.2 Cake
9.3.6.3 Biscuit
9.3.6.4 Steamed bread
9.3.7 Historic and Forecasted Market Size by Distribution Channel
9.3.7.1 Supermarkets/hypermarket
9.3.7.2 Convenience stores
9.3.7.3 Specialty food stores
9.3.7.4 E-commerce
9.3.8 Historic and Forecast Market Size by Country
9.3.8.1 Russia
9.3.8.2 Bulgaria
9.3.8.3 The Czech Republic
9.3.8.4 Hungary
9.3.8.5 Poland
9.3.8.6 Romania
9.3.8.7 Rest of Eastern Europe
9.4. Western Europe Food Leavening Agent Market
9.4.1 Key Market Trends, Growth Factors and Opportunities
9.4.2 Top Key Companies
9.4.3 Historic and Forecasted Market Size by Segments
9.4.4 Historic and Forecasted Market Size by Type
9.4.4.1 Yeast
9.4.4.2 Baking powder
9.4.4.3 Baking soda
9.4.5 Historic and Forecasted Market Size by Form
9.4.5.1 Dry
9.4.5.2 Wet
9.4.6 Historic and Forecasted Market Size by Application
9.4.6.1 Bread
9.4.6.2 Cake
9.4.6.3 Biscuit
9.4.6.4 Steamed bread
9.4.7 Historic and Forecasted Market Size by Distribution Channel
9.4.7.1 Supermarkets/hypermarket
9.4.7.2 Convenience stores
9.4.7.3 Specialty food stores
9.4.7.4 E-commerce
9.4.8 Historic and Forecast Market Size by Country
9.4.8.1 Germany
9.4.8.2 UK
9.4.8.3 France
9.4.8.4 The Netherlands
9.4.8.5 Italy
9.4.8.6 Spain
9.4.8.7 Rest of Western Europe
9.5. Asia Pacific Food Leavening Agent Market
9.5.1 Key Market Trends, Growth Factors and Opportunities
9.5.2 Top Key Companies
9.5.3 Historic and Forecasted Market Size by Segments
9.5.4 Historic and Forecasted Market Size by Type
9.5.4.1 Yeast
9.5.4.2 Baking powder
9.5.4.3 Baking soda
9.5.5 Historic and Forecasted Market Size by Form
9.5.5.1 Dry
9.5.5.2 Wet
9.5.6 Historic and Forecasted Market Size by Application
9.5.6.1 Bread
9.5.6.2 Cake
9.5.6.3 Biscuit
9.5.6.4 Steamed bread
9.5.7 Historic and Forecasted Market Size by Distribution Channel
9.5.7.1 Supermarkets/hypermarket
9.5.7.2 Convenience stores
9.5.7.3 Specialty food stores
9.5.7.4 E-commerce
9.5.8 Historic and Forecast Market Size by Country
9.5.8.1 China
9.5.8.2 India
9.5.8.3 Japan
9.5.8.4 South Korea
9.5.8.5 Malaysia
9.5.8.6 Thailand
9.5.8.7 Vietnam
9.5.8.8 The Philippines
9.5.8.9 Australia
9.5.8.10 New Zealand
9.5.8.11 Rest of APAC
9.6. Middle East & Africa Food Leavening Agent Market
9.6.1 Key Market Trends, Growth Factors and Opportunities
9.6.2 Top Key Companies
9.6.3 Historic and Forecasted Market Size by Segments
9.6.4 Historic and Forecasted Market Size by Type
9.6.4.1 Yeast
9.6.4.2 Baking powder
9.6.4.3 Baking soda
9.6.5 Historic and Forecasted Market Size by Form
9.6.5.1 Dry
9.6.5.2 Wet
9.6.6 Historic and Forecasted Market Size by Application
9.6.6.1 Bread
9.6.6.2 Cake
9.6.6.3 Biscuit
9.6.6.4 Steamed bread
9.6.7 Historic and Forecasted Market Size by Distribution Channel
9.6.7.1 Supermarkets/hypermarket
9.6.7.2 Convenience stores
9.6.7.3 Specialty food stores
9.6.7.4 E-commerce
9.6.8 Historic and Forecast Market Size by Country
9.6.8.1 Turkiye
9.6.8.2 Bahrain
9.6.8.3 Kuwait
9.6.8.4 Saudi Arabia
9.6.8.5 Qatar
9.6.8.6 UAE
9.6.8.7 Israel
9.6.8.8 South Africa
9.7. South America Food Leavening Agent Market
9.7.1 Key Market Trends, Growth Factors and Opportunities
9.7.2 Top Key Companies
9.7.3 Historic and Forecasted Market Size by Segments
9.7.4 Historic and Forecasted Market Size by Type
9.7.4.1 Yeast
9.7.4.2 Baking powder
9.7.4.3 Baking soda
9.7.5 Historic and Forecasted Market Size by Form
9.7.5.1 Dry
9.7.5.2 Wet
9.7.6 Historic and Forecasted Market Size by Application
9.7.6.1 Bread
9.7.6.2 Cake
9.7.6.3 Biscuit
9.7.6.4 Steamed bread
9.7.7 Historic and Forecasted Market Size by Distribution Channel
9.7.7.1 Supermarkets/hypermarket
9.7.7.2 Convenience stores
9.7.7.3 Specialty food stores
9.7.7.4 E-commerce
9.7.8 Historic and Forecast Market Size by Country
9.7.8.1 Brazil
9.7.8.2 Argentina
9.7.8.3 Rest of SA
Chapter 10 Analyst Viewpoint and Conclusion
10.1 Recommendations and Concluding Analysis
10.2 Potential Market Strategies
Chapter 11 Research Methodology
11.1 Research Process
11.2 Primary Research
11.3 Secondary Research
|
Global Food Leavening Agent Market |
|||
|
Base Year: |
2023 |
Forecast Period: |
2024-2032 |
|
Historical Data: |
2017 to 2023 |
Market Size in 2023: |
USD 8271.55 Mn. |
|
Forecast Period 2024-32 CAGR: |
5.86% |
Market Size in 2032: |
USD 13809.37 Mn. |
|
Segments Covered: |
By Type |
|
|
|
By Form |
|
||
|
By Application |
|
||
|
By Distribution Channel |
|
||
|
By Region |
|
||
|
Key Market Drivers: |
|
||
|
Key Market Restraints: |
|
||
|
Key Opportunities: |
|
||
|
Companies Covered in the report: |
|
||
Frequently Asked Questions :
The forecast period in the Food Leavening Agent market research report is 2024–2032.


