


DC Charging for Plug-in Electric Vehicles Market Synopsis
DC Charging for Plug-in Electric Vehicles Market Size valued at USD 23.02 Billion in 2024 and is Projected to Reach USD 62.95 Billion by 2032, Growing at a CAGR of 13.4% From 2025 to 2032
DC charging, as it pertains to plug-in electric vehicles (EVs), is a rapid charging technique that recharges EV batteries using direct current (DC). DC charging can deliver a substantial quantity of power to the vehicle's battery, enabling faster charging times compared to the comparatively sluggish AC charging process. Located in public charging facilities, DC fast chargers can restore electric vehicles (EVs) to 80% or higher in under an hour, rendering them an optimal solution for drivers who require a rapid recharge while in motion. To accommodate the rising popularity of electric vehicles, governments, businesses, and organizations are investing in the expansion of DC fast charger networks to facilitate EV charging. As a result, the market for DC charging infrastructure is expanding at a rapid rate.
The escalating worldwide adoption of electric vehicles (PEVs) is propelling the exponential expansion of the global market for DC charging solutions for PEVs. DC charging, alternatively referred to as rapid charging, presents numerous benefits in comparison to conventional AC charging. These include expedited charging durations and enhanced convenience for auto proprietors.
The increasing market demand for electric vehicles, which is propelled by the imperative to mitigate greenhouse gas emissions and diminish reliance on fossil fuels, stands as a significant catalyst. In addition to implementing subsidies and incentives to encourage the use of electric vehicles, governments worldwide are implementing a variety of measures that increase the demand for DC charging infrastructure.
The market is additionally propelled by technological advancements in the electric vehicle charging industry. Businesses are making substantial investments in R&D to enhance the dependability and efficacy of DC charging solutions, thereby increasing their appeal to consumers.
Nonetheless, the market encounters obstacles, including the requirement for standardization of charging protocols to ensure compatibility between charging stations and vehicle models, as well as the substantial upfront expenses associated with installing DC charging stations.
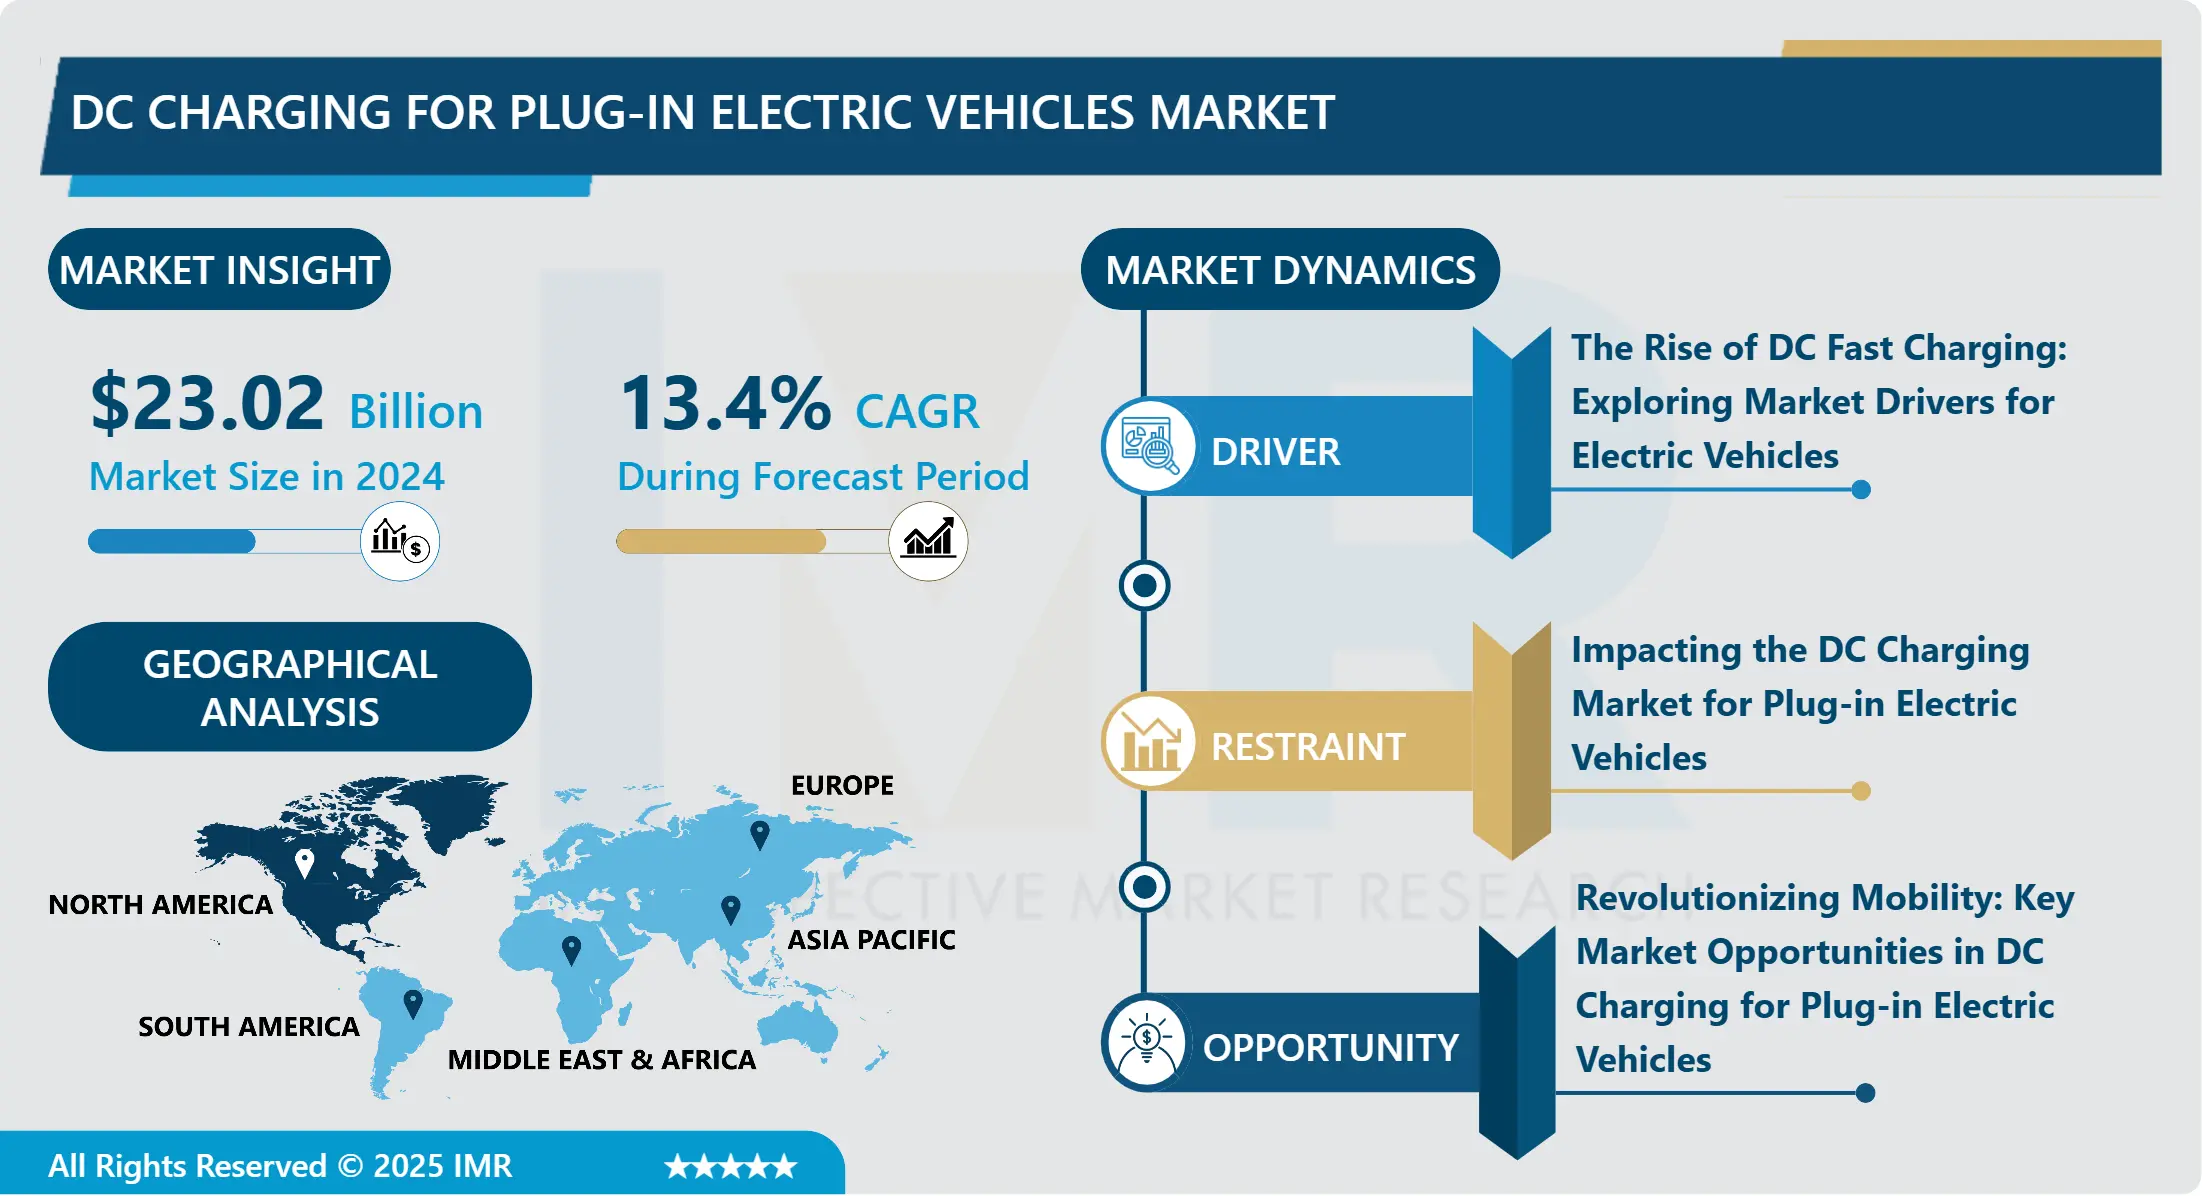

DC Charging for Plug-in Electric Vehicles Market Trend Analysis
Increasing Applications in the Automotive Industry
- The market for direct current (DC) charging of plug-in electric vehicles (PEVs) is undergoing substantial expansion and change. The increasing prevalence of electric vehicle usage has generated a corresponding demand for charging solutions that are both rapid and efficient. The rapid charging capabilities of direct current (DC) fast chargers are gaining traction owing to their suitability for installation in public charging stations and along highways.
- An important factor propelling the market is the proliferation of charging infrastructure. Governments and private enterprises are making substantial investments in the expansion of DC rapid charger networks in order to accommodate the increasing market demand for electric vehicles. This expansion entails the deployment of charging stations in high-traffic locations, including shopping centers and office structures, as well as in urban regions and along major thoroughfares.
- An additional significant development is the progression of sophisticated charging technologies. DC fast chargers are continually undergoing technological advancements that enhance their performance and efficacy. This encompasses advancements in cooling systems, adapters featuring increased power outputs, and seamless integration with smart grid technologies.
- Enhanced collaboration among energy companies, manufacturers, and charging infrastructure providers is another development observed in the market. The objective of this partnership is to build integrated solutions that streamline the charging process for electric vehicles for consumers. Partnerships to develop mobile applications for charging infrastructure integration with renewable energy sources, charging infrastructure location and payment management are two examples.
Sustainable Solutions, DC Charging Infrastructure and the Path to Greener Transportation
- The market for DC Charging for Plug-in Electric Vehicles is currently experiencing substantial expansion, propelled by the global surge in the adoption of electric vehicles (EVs). In contrast to Alternating Current (AC) charging, Direct Current (DC) charging stations provide expedited charging durations, rendering them an indispensable element within the electric vehicle (EV) infrastructure domain.
- A significant factor propelling the expansion of DC charging infrastructure is the exponential growth of electric vehicle (EV) fleets, encompassing both private and commercial usage. The promotion of electric vehicle (EV) adoption by governments and organizations worldwide has resulted in an unprecedented surge in demand for DC charging infrastructure. Moreover, progress in battery technology is facilitating electric vehicle (EV) travel over extended distances on a single charge, thereby intensifying the demand for rapid and efficient charging solutions
- An additional element contributing to the expansion of the DC charging industry is the mounting emphasis on mitigating climate change and reducing greenhouse gas emissions. Conventional gasoline-powered vehicles are regarded as less environmentally favorable than electric vehicles (EVs), and the development of DC charging infrastructure is regarded as an essential measure in the pursuit of sustainable transportation.
- The DC Charging for Plug-in Electric Vehicles Market can be classified according to power output, connector type, end-user, and region for the purpose of market segmentation. Critically important is the power output, as higher-power chargers can substantially reduce charging periods. Additionally, connector type is crucial, as various EV models demand distinct types of connectors.
- Residential, commercial, and public charging stations are all examples of end-users of DC charging stations. For overnight charging, residential users commonly install low-power DC chargers. However, in order to accommodate multiple vehicles, commercial and public charging stations necessitate higher-power chargers.
- The market for DC charging stations is experiencing substantial expansion in regions including Asia Pacific, Europe, and North America. Significant government support for EV adoption has resulted in the development of a robust infrastructure development ecosystem in these regions.
DC Charging for Plug-in Electric Vehicles Market Segment Analysis:
The market for DC charging for plug-in electric vehicles is segmented on the basis of Connector type, Power supply, Vehicle type and Region.
By Connector Type, the Charging System segment is expected to dominate the market during the forecast period
- Diverse connector types are available on the DC Charging for Plug-in Electric Vehicles Market, with each type designed to accommodate a unique set of EV models and manufacturers. Popularized by Japanese automakers such as Nissan and Mitsubishi, the CHAdeMO connector is well-known for its compatibility with a large number of electric vehicle models. An additional prevalent connector type, the Combined Charging System (CCS), is favored by American and European manufacturers due to its capacity to manage both AC and DC charging.
- Tesla, a market leader in electric vehicles, employs its own connector to connect to its Supercharger network; however, for compatibility with third-party charging stations, more recent Tesla models also support CCS. The aforementioned connector types are representative of the heterogeneous nature of the DC charging market, as they cater to distinct sectors within the electric vehicle industry.
By Vehicle Type, Light Commercial Vehicles segment held the largest share in 2024
- The market for DC Charging for Plug-in Electric Vehicles serves an extensive variety of vehicle classes, such as passenger automobiles, light commercial vehicles, and heavy trucks. Passenger cars constitute a substantial segment of the market, propelled by the growing consumer preference for electric vehicles.
- The increasing adoption of electric powertrains in light commercial vehicles (e.g., delivery vans and compact trucks) contributes to the demand for DC charging infrastructure. Furthermore, the industry caters to heavy vehicles that are undergoing a conversion to electric propulsion in an effort to decrease emissions and operational expenses. The category labeled "others" comprises a wide range of vehicle types, such as buses, motorcycles, and specialty vehicles, which serves as an illustration of the multifaceted uses of DC charging technology within the electric vehicle ecosystem.
DC Charging for Plug-in Electric Vehicles Market Regional Insights:
Electrifying Progress: The Evolution of North America's DC Charging Station Market for PEVs
- The DC charging station market for plug-in electric vehicles (PEVs) in North America is a dynamic and swiftly developing sector. The increasing focus on mitigating greenhouse gas emissions and shifting towards electric mobility has led to a heightened need for efficient and pervasive charging infrastructure.
- A wide variety of entities are present in the market, such as charging station providers, utilities, automotive manufacturers, and government agencies. Each of these factors significantly influences the market environment.
- As more automobile manufacturers introduce PEV models, the demand for charging infrastructure that is compatible with these vehicles increases. Government incentives and regulations designed to encourage the adoption of electric vehicles bolster this trend.
- In response to this demand, providers of charging stations are installing an assortment of charging solutions, such as DC fast chargers and Level 2 AC chargers. Particularly gaining popularity are DC fast chargers on long-distance travel routes and public charging stations, owing to their capacity to swiftly recharge PEVs.
- Utilities are actively participating in the market by engaging in partnerships with charging station providers to enhance grid integration and guarantee a dependable supply of electricity to charging stations. The establishment of this collaboration is critical in order to effectively mitigate the grid effects of charging infrastructure and facilitate the shift towards renewable energy sources.
- Policies and incentives are being implemented by government agencies with the aim of expediting the installation of charging infrastructure. These encompass regulatory mandates, funding programs, and tax incentives that require the implementation of charging stations in public spaces and newly constructed buildings.
Active Key Players in the DC Charging for Plug-in Electric Vehicles Market
- ABB(Switzerland)
- AVX(United States)
- Blink(United States)
- BTC Power (United States)
- Chargepoint(United States)
- EVBOX(Netherlands)
- EVgo(United States)
- Greenlots(United States)
- Hitachi(Japan)
- Huber+Suhner(Switzerland)
- Ionity(Germany)
- Murata(Japan)
- Nichicon(Japan)
- Other Active Players
Key Industry Developments in the DC Charging for Plug-in Electric Vehicles Market:
- In April 2024, Delta, a global leader in power management and provider of IoT-based smart green solutions, announced the launch of its 500kW DC Ultra-fast EV Charger UFC 500 in the EMEA market. The UFC 500 emerged as an ideal solution amidst rising high-power charging needs and challenges in land acquisition for EV charging operators. Offering unparalleled convenience, the UFC 500 could charge one heavy-duty electric vehicle (e-truck/e-Bus) with large battery capacity at 460 kW power within 2 hours, resulting in an average full-day driving range for operations.
- In January 2024, Siemens completed its acquisition of Netherlands-based DC fast charger manufacturer Heliox, enhancing its eMobility charging portfolio. The acquisition has expanded Siemens's market presence in Europe and North America with Heliox's range of charging solutions, which span from 40 kW to over a megawatt for commercial EV depots. This move bolsters Siemens's capabilities in power electronics, leveraging Heliox's mobile, scalable, and parallel charging solutions to better serve these markets. The integration of Heliox's technologies is expected to strengthen Siemens's position in the rapidly growing electric vehicle charging sector, offering robust solutions across a broad spectrum of power levels.
|
Global DC Charging for Plug-in Electric Vehicles Market |
|||
|
Base Year: |
2024 |
Forecast Period: |
2025-2032 |
|
Historical Data: |
2018 to 2023 |
Market Size in 2024: |
USD 23.02 Bn. |
|
Forecast Period 2025–32 CAGR: |
13.4% |
Market Size in 2032: |
USD 62.95 Bn. |
|
Segments Covered: |
By Connector Type |
|
|
|
By Power Supply |
|
||
|
By Vehicle Type |
|
||
|
By Region |
|
||
|
Key Market Drivers: |
|
||
|
Key Market Restraints: |
|
||
|
Key Opportunities: |
|
||
|
Companies Covered in the report: |
|
||
Chapter 1: Introduction
1.1 Scope and Coverage
Chapter 2:Executive Summary
Chapter 3: Market Landscape
3.1 Market Dynamics
3.1.1 Drivers
3.1.2 Restraints
3.1.3 Opportunities
3.1.4 Challenges
3.2 Market Trend Analysis
3.3 PESTLE Analysis
3.4 Porter's Five Forces Analysis
3.5 Industry Value Chain Analysis
3.6 Ecosystem
3.7 Regulatory Landscape
3.8 Price Trend Analysis
3.9 Patent Analysis
3.10 Technology Evolution
3.11 Investment Pockets
3.12 Import-Export Analysis
Chapter 4: DC Charging For Plug-In Electric Vehicles Market by Connector Type (2018-2032)
4.1 DC Charging For Plug-In Electric Vehicles Market Snapshot and Growth Engine
4.2 Market Overview
4.3 CHAdeMO
4.3.1 Introduction and Market Overview
4.3.2 Historic and Forecasted Market Size in Value USD and Volume Units
4.3.3 Key Market Trends, Growth Factors, and Opportunities
4.3.4 Geographic Segmentation Analysis
4.4 Combined Charging System (CCS)
4.5 Tesla
Chapter 5: DC Charging For Plug-In Electric Vehicles Market by Power Supply (2018-2032)
5.1 DC Charging For Plug-In Electric Vehicles Market Snapshot and Growth Engine
5.2 Market Overview
5.3 0-50 kW
5.3.1 Introduction and Market Overview
5.3.2 Historic and Forecasted Market Size in Value USD and Volume Units
5.3.3 Key Market Trends, Growth Factors, and Opportunities
5.3.4 Geographic Segmentation Analysis
5.4 50-150 kW
5.5 150-350kW
Chapter 6: DC Charging For Plug-In Electric Vehicles Market by Vehicle Type (2018-2032)
6.1 DC Charging For Plug-In Electric Vehicles Market Snapshot and Growth Engine
6.2 Market Overview
6.3 Passenger Car
6.3.1 Introduction and Market Overview
6.3.2 Historic and Forecasted Market Size in Value USD and Volume Units
6.3.3 Key Market Trends, Growth Factors, and Opportunities
6.3.4 Geographic Segmentation Analysis
6.4 Light Commercial Vehicles
6.5 Heavy Trucks
6.6 Others
Chapter 7: Company Profiles and Competitive Analysis
7.1 Competitive Landscape
7.1.1 Competitive Benchmarking
7.1.2 DC Charging For Plug-In Electric Vehicles Market Share by Manufacturer (2024)
7.1.3 Industry BCG Matrix
7.1.4 Heat Map Analysis
7.1.5 Mergers and Acquisitions
7.2 J.C. BAMFORD EXCAVATORS LTD. (JCB)
7.2.1 Company Overview
7.2.2 Key Executives
7.2.3 Company Snapshot
7.2.4 Role of the Company in the Market
7.2.5 Sustainability and Social Responsibility
7.2.6 Operating Business Segments
7.2.7 Product Portfolio
7.2.8 Business Performance
7.2.9 Key Strategic Moves and Recent Developments
7.2.10 SWOT Analysis
7.3 SOLECTRAC
7.4 DONGFEND
7.5 YANMAR CO. LTD.
7.6 ESCORTS LIMITED
7.7 KUBOTA CORPORATION
7.8 CLAAS KGAA MBH
7.9 CATERPILLAR INC.
7.10 DEERE AND COMPANY
7.11 AGCO CORPORATION
7.12 MAHINDRA AND MAHINADRA
7.13 CNH INDUSTRIAL N.V.
7.14 VALTRA INC.
7.15 FENDT (AGCO CORPORATION)
7.16 NEW HOLLAND AGRICULTURE (CNH INDUSTRIAL)
7.17 ZETOR TRACTORS A.S.
7.18 TAFE - TRACTORS AND FARM EQUIPMENT LIMITED
7.19 SONALIKA GROUP (INTERNATIONAL TRACTORS LTD.)
7.20 ARBOS GROUP
7.21 LOVOL HEAVY INDUSTRY CO. LTD.
7.22 SAME DEUTZ-FAHR GROUP (SDF GROUP)
7.23 OTHER KEY PLAYERS
Chapter 8: Global DC Charging For Plug-In Electric Vehicles Market By Region
8.1 Overview
8.2. North America DC Charging For Plug-In Electric Vehicles Market
8.2.1 Key Market Trends, Growth Factors and Opportunities
8.2.2 Top Key Companies
8.2.3 Historic and Forecasted Market Size by Segments
8.2.4 Historic and Forecasted Market Size by Connector Type
8.2.4.1 CHAdeMO
8.2.4.2 Combined Charging System (CCS)
8.2.4.3 Tesla
8.2.5 Historic and Forecasted Market Size by Power Supply
8.2.5.1 0-50 kW
8.2.5.2 50-150 kW
8.2.5.3 150-350kW
8.2.6 Historic and Forecasted Market Size by Vehicle Type
8.2.6.1 Passenger Car
8.2.6.2 Light Commercial Vehicles
8.2.6.3 Heavy Trucks
8.2.6.4 Others
8.2.7 Historic and Forecast Market Size by Country
8.2.7.1 US
8.2.7.2 Canada
8.2.7.3 Mexico
8.3. Eastern Europe DC Charging For Plug-In Electric Vehicles Market
8.3.1 Key Market Trends, Growth Factors and Opportunities
8.3.2 Top Key Companies
8.3.3 Historic and Forecasted Market Size by Segments
8.3.4 Historic and Forecasted Market Size by Connector Type
8.3.4.1 CHAdeMO
8.3.4.2 Combined Charging System (CCS)
8.3.4.3 Tesla
8.3.5 Historic and Forecasted Market Size by Power Supply
8.3.5.1 0-50 kW
8.3.5.2 50-150 kW
8.3.5.3 150-350kW
8.3.6 Historic and Forecasted Market Size by Vehicle Type
8.3.6.1 Passenger Car
8.3.6.2 Light Commercial Vehicles
8.3.6.3 Heavy Trucks
8.3.6.4 Others
8.3.7 Historic and Forecast Market Size by Country
8.3.7.1 Russia
8.3.7.2 Bulgaria
8.3.7.3 The Czech Republic
8.3.7.4 Hungary
8.3.7.5 Poland
8.3.7.6 Romania
8.3.7.7 Rest of Eastern Europe
8.4. Western Europe DC Charging For Plug-In Electric Vehicles Market
8.4.1 Key Market Trends, Growth Factors and Opportunities
8.4.2 Top Key Companies
8.4.3 Historic and Forecasted Market Size by Segments
8.4.4 Historic and Forecasted Market Size by Connector Type
8.4.4.1 CHAdeMO
8.4.4.2 Combined Charging System (CCS)
8.4.4.3 Tesla
8.4.5 Historic and Forecasted Market Size by Power Supply
8.4.5.1 0-50 kW
8.4.5.2 50-150 kW
8.4.5.3 150-350kW
8.4.6 Historic and Forecasted Market Size by Vehicle Type
8.4.6.1 Passenger Car
8.4.6.2 Light Commercial Vehicles
8.4.6.3 Heavy Trucks
8.4.6.4 Others
8.4.7 Historic and Forecast Market Size by Country
8.4.7.1 Germany
8.4.7.2 UK
8.4.7.3 France
8.4.7.4 The Netherlands
8.4.7.5 Italy
8.4.7.6 Spain
8.4.7.7 Rest of Western Europe
8.5. Asia Pacific DC Charging For Plug-In Electric Vehicles Market
8.5.1 Key Market Trends, Growth Factors and Opportunities
8.5.2 Top Key Companies
8.5.3 Historic and Forecasted Market Size by Segments
8.5.4 Historic and Forecasted Market Size by Connector Type
8.5.4.1 CHAdeMO
8.5.4.2 Combined Charging System (CCS)
8.5.4.3 Tesla
8.5.5 Historic and Forecasted Market Size by Power Supply
8.5.5.1 0-50 kW
8.5.5.2 50-150 kW
8.5.5.3 150-350kW
8.5.6 Historic and Forecasted Market Size by Vehicle Type
8.5.6.1 Passenger Car
8.5.6.2 Light Commercial Vehicles
8.5.6.3 Heavy Trucks
8.5.6.4 Others
8.5.7 Historic and Forecast Market Size by Country
8.5.7.1 China
8.5.7.2 India
8.5.7.3 Japan
8.5.7.4 South Korea
8.5.7.5 Malaysia
8.5.7.6 Thailand
8.5.7.7 Vietnam
8.5.7.8 The Philippines
8.5.7.9 Australia
8.5.7.10 New Zealand
8.5.7.11 Rest of APAC
8.6. Middle East & Africa DC Charging For Plug-In Electric Vehicles Market
8.6.1 Key Market Trends, Growth Factors and Opportunities
8.6.2 Top Key Companies
8.6.3 Historic and Forecasted Market Size by Segments
8.6.4 Historic and Forecasted Market Size by Connector Type
8.6.4.1 CHAdeMO
8.6.4.2 Combined Charging System (CCS)
8.6.4.3 Tesla
8.6.5 Historic and Forecasted Market Size by Power Supply
8.6.5.1 0-50 kW
8.6.5.2 50-150 kW
8.6.5.3 150-350kW
8.6.6 Historic and Forecasted Market Size by Vehicle Type
8.6.6.1 Passenger Car
8.6.6.2 Light Commercial Vehicles
8.6.6.3 Heavy Trucks
8.6.6.4 Others
8.6.7 Historic and Forecast Market Size by Country
8.6.7.1 Turkiye
8.6.7.2 Bahrain
8.6.7.3 Kuwait
8.6.7.4 Saudi Arabia
8.6.7.5 Qatar
8.6.7.6 UAE
8.6.7.7 Israel
8.6.7.8 South Africa
8.7. South America DC Charging For Plug-In Electric Vehicles Market
8.7.1 Key Market Trends, Growth Factors and Opportunities
8.7.2 Top Key Companies
8.7.3 Historic and Forecasted Market Size by Segments
8.7.4 Historic and Forecasted Market Size by Connector Type
8.7.4.1 CHAdeMO
8.7.4.2 Combined Charging System (CCS)
8.7.4.3 Tesla
8.7.5 Historic and Forecasted Market Size by Power Supply
8.7.5.1 0-50 kW
8.7.5.2 50-150 kW
8.7.5.3 150-350kW
8.7.6 Historic and Forecasted Market Size by Vehicle Type
8.7.6.1 Passenger Car
8.7.6.2 Light Commercial Vehicles
8.7.6.3 Heavy Trucks
8.7.6.4 Others
8.7.7 Historic and Forecast Market Size by Country
8.7.7.1 Brazil
8.7.7.2 Argentina
8.7.7.3 Rest of SA
Chapter 9 Analyst Viewpoint and Conclusion
9.1 Recommendations and Concluding Analysis
9.2 Potential Market Strategies
Chapter 10 Research Methodology
10.1 Research Process
10.2 Primary Research
10.3 Secondary Research
|
Global DC Charging for Plug-in Electric Vehicles Market |
|||
|
Base Year: |
2024 |
Forecast Period: |
2025-2032 |
|
Historical Data: |
2018 to 2023 |
Market Size in 2024: |
USD 23.02 Bn. |
|
Forecast Period 2025–32 CAGR: |
13.4% |
Market Size in 2032: |
USD 62.95 Bn. |
|
Segments Covered: |
By Connector Type |
|
|
|
By Power Supply |
|
||
|
By Vehicle Type |
|
||
|
By Region |
|
||
|
Key Market Drivers: |
|
||
|
Key Market Restraints: |
|
||
|
Key Opportunities: |
|
||
|
Companies Covered in the report: |
|
||


