


Confocal Raman Spectroscopy Market Synopsis:
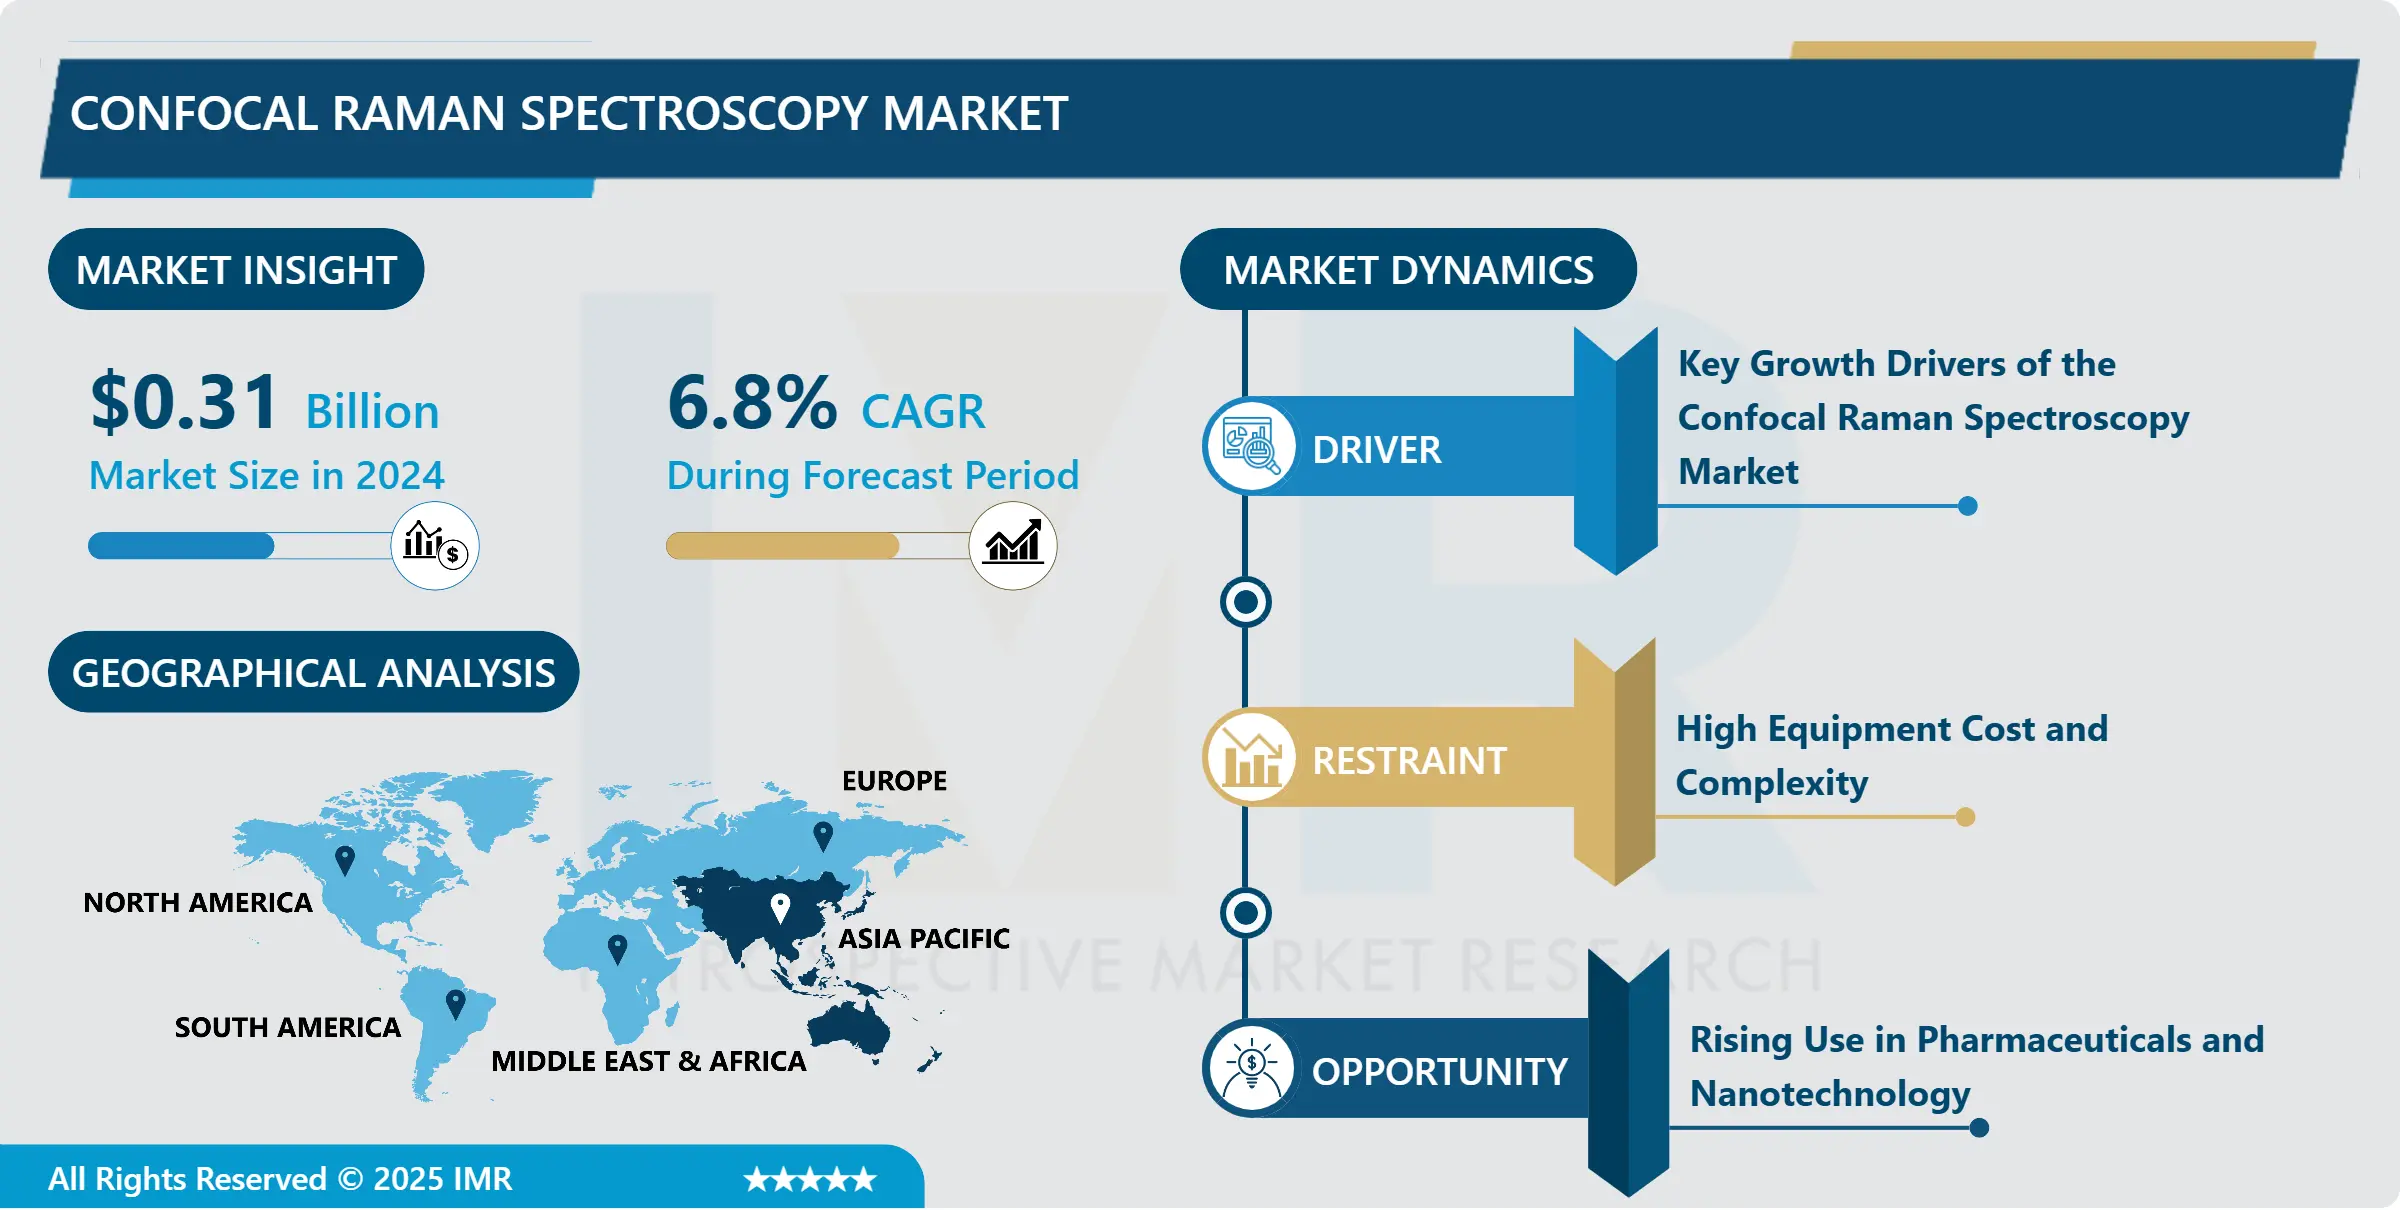
Confocal Raman Spectroscopy Market Size Was Valued at USD 0.31 Billion in 2024, and is Projected to Reach USD 0.64 Billion by 2035, Growing at a CAGR of 6.8% from 2025-2035.
The Confocal Raman Spectroscopy market focuses on advanced tools that help scientists and engineers analyse materials at a microscopic level. This technology combines Raman spectroscopy with confocal microscopy, allowing users to get highly detailed, 3D images of a material’s chemical structure without damaging the sample. It is widely used in industries such as pharmaceuticals, biotechnology, materials science, semiconductors, and environmental testing. In pharma and biotech, it helps with drug formulation, quality control, and studying cells. In electronics and materials science, it’s used to analyse microchips, polymers, and nanomaterials.
One of the key reasons for its growing demand is the ability to provide fast, accurate, and non-invasive testing. It’s especially useful in research and development where detailed molecular-level insights are needed. There’s also a growing trend toward portable and easy-to-use Raman systems, which allow testing in the field, such as in forensics or art conservation. Technological improvements like AI-driven data analysis and integration with other tools (such as AFM or SEM) are making the systems even more powerful.
However, high costs and the need for skilled operators can limit adoption in smaller labs. Despite this, the market is expected to continue growing as more industries adopt precise, non-destructive testing methods. Overall, Confocal Raman Spectroscopy is becoming a vital tool in both research and industrial settings, offering detailed chemical insights that are not possible with other technologies.
Confocal Raman Spectroscopy Market Growth and Trend Analysis:
Confocal Raman Spectroscopy Market Growth Driver - Key Growth Drivers of the Confocal Raman Spectroscopy Market
- Confocal Raman Spectroscopy is becoming more popular across industries due to its ability to give detailed information about the chemical makeup of materials without damaging them. Several important factors are driving the growth of this market. One major driver is the rising demand in the pharmaceutical and biotechnology industries. These sectors use Confocal Raman systems to improve drug development, ensure product quality, and better understand how cells behave. As healthcare research increases, so does the need for advanced testing tools like these.
- Another key factor is the growing interest in nanotechnology and materials science. Confocal Raman Spectroscopy helps scientists study tiny structures like nanoparticles, polymers, and semiconductors in great detail, which is crucial for developing new materials and electronics. Non-destructive testing is also becoming more important in industries such as electronics, forensics, and art restoration. Confocal Raman systems allow experts to examine objects deeply without altering or damaging them.
- In addition, technological improvements such as portable devices, AI-assisted data analysis, and integration with other tools are making these systems more powerful and easier to use. While high cost and required expertise remain challenges, the benefits of accurate, real-time, and detailed analysis are leading more industries to adopt Confocal Raman Spectroscopy, driving consistent market growth.
Confocal Raman Spectroscopy Market Limiting Factor - High Equipment Cost and Complexity
- One of the biggest factors slowing down the growth of the Confocal Raman Spectroscopy market is the high cost of the equipment. These machines are advanced and designed to perform very precise chemical analysis, which makes them expensive to manufacture and purchase. For many smaller research labs, universities, or companies with limited funding, the high upfront cost can be too much.
- In addition to the purchase price, there are also ongoing maintenance costs. These systems are sensitive and need regular calibration, updates, and sometimes repairs, which adds to the total cost of ownership over time.
- Another challenge is that Confocal Raman Spectroscopy systems often require trained professionals to operate. The technology is not always easy to use for someone without experience. Understanding the data it produces called Raman spectra can be complicated. It usually takes someone with a background in chemistry, physics, or material science to properly analyse and interpret the results.
- Because of this, many organizations may avoid using the technology altogether, or limit its use to only certain advanced tasks. The learning curve and cost combined can discourage widespread adoption, especially in areas where simpler or cheaper tools may be good enough. This cost and complexity challenge continues to be one of the biggest hurdles for the broader adoption of Confocal Raman Spectroscopy.
Confocal Raman Spectroscopy Market Expansion Opportunity - Rising Use in Pharmaceuticals and Nanotechnology
- One of the biggest opportunities for the Confocal Raman Spectroscopy market is its growing use in pharmaceutical research and nanotechnology. These fields need advanced tools that can study tiny materials and complex chemical structures without damaging the sample and Confocal Raman technology does exactly that.
- In the pharmaceutical industry, this technology is used to study how drugs are made, how they behave in the body, and whether they meet quality standards. It helps researchers understand drug ingredients and how they interact, which supports safer and more effective treatments.
- In nanotechnology, scientists use Confocal Raman Spectroscopy to analyse materials that are too small to see with a regular microscope. This includes nanoparticles, thin films, and other cutting-edge materials used in electronics, batteries, and medical devices.
- As industries continue to focus on innovation, there’s a growing demand for tools that provide accurate, fast, and non-destructive testing. Confocal Raman Spectroscopy fits these needs, making it more attractive to labs and companies around the world. This creates a strong opportunity for the market to expand especially as technology becomes easier to use and more affordable over time. With rising investment in healthcare, electronics, and advanced materials, the future looks bright for Confocal Raman Spectroscopy.
Confocal Raman Spectroscopy Market Challenge and Risk - Limited Standardization and Regulatory Hurdles
- While Confocal Raman Spectroscopy offers many benefits, one of the major challenges it faces is the lack of standardized procedures and clear regulations. In industries like pharmaceuticals and healthcare, strict rules are in place to make sure testing methods are accurate and consistent. However, Raman spectroscopy doesn't yet have widely accepted guidelines, which makes it harder for companies to use it confidently in regulated environments. Without clear standards, results can vary between labs or instruments, raising concerns about data reliability. This can slow down adoption, especially in industries where compliance and repeatability are critical.
- Another challenge is competition from other well-established technologies, such as FTIR (Fourier-transform infrared spectroscopy), mass spectrometry, and electron microscopy. These alternatives already have strong industry support and regulatory backing, which makes them easier to adopt especially in large organizations.
- In addition, Confocal Raman systems often require specialized knowledge to operate and interpret results. If users aren’t properly trained, they may not trust the results, further limiting usage. Together, these risks lack of standardization, regulatory uncertainty, and tough competition can slow the market’s growth. For Confocal Raman Spectroscopy to reach its full potential, the industry must work toward developing clear protocols, user-friendly systems, and greater awareness of its unique advantages.
Confocal Raman Spectroscopy Market Segment Analysis:
Confocal Raman Spectroscopy Market is segmented based on Type, Application, End-Users, and Region
By Type, Confocal Raman Spectroscopy Segment is Expected to Dominate the Market During the Forecast Period
- Standalone systems are full, ready-to-use Confocal Raman Spectroscopy instruments that include all the necessary parts in a single setup. This means they come with the laser, microscope, detector, software, and control systems already built into one complete unit. Users don’t need to add extra components or connect the system to other devices to start using it. Everything is already integrated.
- Because of their convenience and ease of use, standalone systems are very popular in research laboratories, academic institutions, and industrial quality control labs. They are designed to deliver high-quality results with minimal setup. This is especially helpful for labs that need to analyse a wide range of samples quickly and accurately without spending extra time assembling or calibrating parts.
- Standalone Confocal Raman systems are used in many fields, such as pharmaceuticals, materials science, life sciences, and electronics. Scientists and engineers use them to study the chemical structure of materials, detect impurities, check product quality, or perform advanced research.
- These systems also come with user-friendly software that makes it easier to collect, process, and analyse data. Some advanced models offer features like 3D imaging, automated mapping, and fast scanning speeds. Although they are more expensive than modular systems, their all-in-one design, reliability, and advanced capabilities make them a top choice for labs that need dependable, high-performance equipment. Overall, standalone systems play a key role in driving the adoption of Confocal Raman Spectroscopy across different industries and research areas.
By Application, Confocal Raman Spectroscopy Segment Held the Largest Share in 2024
- In the pharmaceutical industry, Confocal Raman Spectroscopy is becoming an important tool for improving how medicines are developed, tested, and studied. It is a non-destructive and precise technique that allows scientists to analyse the chemical structure of drugs and biological samples without damaging them.
- One of the main uses is in drug development. Researchers use Confocal Raman Spectroscopy to study how drug ingredients are mixed, how they interact, and how they behave under different conditions. This helps in creating better, safer, and more effective medicines. It also helps scientists understand how the drug will react inside the human body.
- Another key use is in quality control. After a drug is made, companies must ensure that each batch meets strict standards. Confocal Raman systems can quickly check if the ingredients are correct, evenly distributed, and properly formed. This helps prevent problems with safety, effectiveness, and shelf life.
- The technology is also used for studying biological samples, like cells and tissues. Since Confocal Raman can provide detailed, 3D chemical images, it allows scientists to observe how a drug interacts with cells or how diseases affect tissues without using dyes or destroying the sample.
- Overall, Confocal Raman Spectroscopy helps pharmaceutical companies save time, reduce waste, and improve product quality. Its ability to provide fast, accurate, and detailed chemical information makes it a valuable tool in every stage of the pharmaceutical process from early research to final quality checks.
Confocal Raman Spectroscopy Market Regional Insights:
Asia Pacific is Expected to Dominate the Market Over the Forecast Period
- The Asia-Pacific region is experiencing the fastest growth in the Confocal Raman Spectroscopy market. This is mainly because countries like China, Japan, South Korea, and India are heavily investing in science, technology, and advanced research.
- In recent years, these countries have focused on improving their research facilities, opening new laboratories, and upgrading universities with modern equipment. Confocal Raman Spectroscopy is being adopted in these places because it helps scientists study materials closely without damaging them.
- Another big reason for this growth is the rapid development of the pharmaceutical and electronics industries in the region. Companies in China and India, for example, are using this technology to help develop new medicines and test the quality of their products. In Japan and South Korea, it’s used to inspect microchips and advanced materials used in phones, computers, and other electronic devices.
- Universities and research institutes are also playing a major role. As more students and researchers are trained to use Confocal Raman systems, the technology is becoming more common and easier to access. Government support, growing investment in science, and the need for high-quality testing are all helping Asia-Pacific become a key player in the global market for Confocal Raman Spectroscopy.
Confocal Raman Spectroscopy Market Active Players:
- Agilent Technologies, Inc. (United States)
- Andor Technology Ltd. (United Kingdom)
- Avantes BV (Netherlands)
- B&W Tek, Inc. (United States)
- BaySpec, Inc. (United States)
- Bruker Corporation (United States)
- Cobalt Light Systems (United Kingdom)
- Craic Technologies (United States)
- Dongwoo Optron Co., Ltd. (South Korea)
- EDAX (AMETEK Inc.) (United States)
- EnSpectr (Laser Systems) (Russia)
- Horiba Ltd. (Japan)
- JASCO Corporation (Japan)
- Kaiser Optical Systems, Inc. (United States)
- LabRAM HR Evolution (Horiba Scientific) (Japan)
- Nanobase Inc. (South Korea)
- NT-MDT Spectrum Instruments (Russia)
- Ocean Insight (United States)
- PerkinElmer, Inc. (United States)
- Photon etc. (Canada)
- Raman Systems, Inc. (United States)
- Renishaw plc (United Kingdom)
- Snowy Range Instruments (United States)
- TechnoSPEX Pte Ltd (Singapore)
- Thermo Fisher Scientific Inc. (United States)
- Tokyo Instruments, Inc. (Japan)
- Toptica Photonics AG (Germany)
- Wasatch Photonics, Inc. (United States)
- WITec GmbH (Germany)
- Zolix Instruments Co., Ltd. (China)
- Other Active Players
Key Industry Developments in the Confocal Raman Spectroscopy Market:
- In October 2023, Thermo Fisher Scientific introduced a new confocal Raman system featuring enhanced resolution and sensitivity for complex material analysis. This advancement strengthens its position in pharmaceuticals, materials science, and nanotech
- In September 2023, Renishaw PLC formed a partnership with a leading academic institution to develop customized Raman spectroscopy solutions for biomedical research, marking a move toward applications in diagnostics and personalized medicine
| Confocal Raman Spectroscopy Market | |||
|
Base Year: |
2024 |
Forecast Period: |
2025-2035 |
|
Historical Data: |
2018 to 2023 |
Market Size in 2024: |
USD 0.31 Billion |
|
Forecast Period 2025-35 CAGR: |
6.8 % |
Market Size in 2035: |
USD 0.64 Billion |
|
|
By Type |
|
|
|
|
By Application |
|
|
|
By Technique |
|
||
|
By End User |
|
||
|
By Region |
|
||
|
Growth Driver: |
|
||
|
Limiting Factor |
|
||
|
Expansion Opportunity |
|
||
|
Challenge and Risk |
|
||
|
Companies Covered in the Report: |
|
||
Chapter 1: Introduction
1.1 Scope and Coverage
Chapter 2:Executive Summary
Chapter 3: Market Landscape
3.1 Market Dynamics and Opportunity Analysis
3.1.1 Growth Drivers
3.1.2 Limiting Factors
3.1.3 Growth Opportunities
3.1.4 Challenges and Risks
3.2 Market Trend Analysis
3.3 Industry Ecosystem
3.4 Industry Value Chain Mapping
3.5 Strategic PESTLE Overview
3.6 Porter's Five Forces Framework
3.7 Regulatory Framework
3.8 Pricing Trend Analysis
3.9 Intellectual Property Review
3.10 Technology Evolution
3.11 Import-Export Analysis
3.12 Consumer Behavior Analysis
3.13 Investment Pocket Analysis
3.14 Go-To Market Strategy
Chapter 4: Confocal Raman Spectroscopy Market by Product Type (2018-2035)
4.1 Confocal Raman Spectroscopy Market Snapshot and Growth Engine
4.2 Market Overview
4.3 Standalone Systems
4.3.1 Introduction and Market Overview
4.3.2 Historic and Forecasted Market Size in Value USD and Volume Units
4.3.3 Key Market Trends, Growth Factors, and Opportunities
4.3.4 Geographic Segmentation Analysis
4.4 Modules
4.5 Accessories
Chapter 5: Confocal Raman Spectroscopy Market by Application (2018-2035)
5.1 Confocal Raman Spectroscopy Market Snapshot and Growth Engine
5.2 Market Overview
5.3 Pharmaceuticals
5.3.1 Introduction and Market Overview
5.3.2 Historic and Forecasted Market Size in Value USD and Volume Units
5.3.3 Key Market Trends, Growth Factors, and Opportunities
5.3.4 Geographic Segmentation Analysis
5.4 Material Science
5.5 Nanotechnology
5.6 Life Sciences
5.7 Semiconductors
Chapter 6: Confocal Raman Spectroscopy Market by Technique (2018-2035)
6.1 Confocal Raman Spectroscopy Market Snapshot and Growth Engine
6.2 Market Overview
6.3 Surface Enhanced Raman Scattering
6.3.1 Introduction and Market Overview
6.3.2 Historic and Forecasted Market Size in Value USD and Volume Units
6.3.3 Key Market Trends, Growth Factors, and Opportunities
6.3.4 Geographic Segmentation Analysis
6.4 Resonance Raman Spectroscopy
6.5 Tip-Enhanced Raman Spectroscopy
6.6 Spatially Offset Raman Spectroscopy
Chapter 7: Confocal Raman Spectroscopy Market by End-user (2018-2035)
7.1 Confocal Raman Spectroscopy Market Snapshot and Growth Engine
7.2 Market Overview
7.3 Research Institutions
7.3.1 Introduction and Market Overview
7.3.2 Historic and Forecasted Market Size in Value USD and Volume Units
7.3.3 Key Market Trends, Growth Factors, and Opportunities
7.3.4 Geographic Segmentation Analysis
7.4 Industrial Laboratories
7.5 Academic Institutions
7.6 Healthcare Facilities
Chapter 8: Company Profiles and Competitive Analysis
8.1 Competitive Landscape
8.1.1 Competitive Benchmarking
8.1.2 Confocal Raman Spectroscopy Market Share by Manufacturer/Service Provider(2024)
8.1.3 Industry BCG Matrix
8.1.4 PArtnerships, Mergers & Acquisitions
8.2 AGILENT TECHNOLOGIES
8.2.1 Company Overview
8.2.2 Key Executives
8.2.3 Company Snapshot
8.2.4 Role of the Company in the Market
8.2.5 Sustainability and Social Responsibility
8.2.6 Operating Business Segments
8.2.7 Product Portfolio
8.2.8 Business Performance
8.2.9 Recent News & Developments
8.2.10 SWOT Analysis
8.3 INC. (UNITED STATES)
8.4 ANDOR TECHNOLOGY LTD. (UNITED KINGDOM)
8.5 AVANTES BV (NETHERLANDS)
8.6 B&W TEK
8.7 INC. (UNITED STATES)
8.8 BAYSPEC
8.9 INC. (UNITED STATES)
8.10 BRUKER CORPORATION (UNITED STATES)
8.11 COBALT LIGHT SYSTEMS (UNITED KINGDOM)
8.12 CRAIC TECHNOLOGIES (UNITED STATES)
8.13 DONGWOO OPTRON CO.
8.14 LTD. (SOUTH KOREA)
8.15 EDAX (AMETEK INC.) (UNITED STATES)
8.16 ENSPECTR (LASER SYSTEMS) (RUSSIA)
8.17 HORIBA LTD. (JAPAN)
8.18 JASCO CORPORATION (JAPAN)
8.19 KAISER OPTICAL SYSTEMS
8.20 INC. (UNITED STATES)
8.21 LABRAM HR EVOLUTION (HORIBA SCIENTIFIC) (JAPAN)
8.22 NANOBASE INC. (SOUTH KOREA)
8.23 NT-MDT SPECTRUM INSTRUMENTS (RUSSIA)
8.24 OCEAN INSIGHT (UNITED STATES)
8.25 PERKINELMER
8.26 INC. (UNITED STATES)
8.27 PHOTON ETC. (CANADA)
8.28 RAMAN SYSTEMS
8.29 INC. (UNITED STATES)
8.30 RENISHAW PLC (UNITED KINGDOM)
8.31 SNOWY RANGE INSTRUMENTS (UNITED STATES)
8.32 TECHNOSPEX PTE LTD (SINGAPORE)
8.33 THERMO FISHER SCIENTIFIC INC. (UNITED STATES)
8.34 TOKYO INSTRUMENTS
8.35 INC. (JAPAN)
8.36 TOPTICA PHOTONICS AG (GERMANY)
8.37 WASATCH PHOTONICS
8.38 INC. (UNITED STATES)
8.39 WITEC GMBH (GERMANY)
8.40 ZOLIX INSTRUMENTS CO.
8.41 LTD. (CHINA)
8.42 AND OTHER ACTIVE PLAYERS.
Chapter 9: Global Confocal Raman Spectroscopy Market By Region
9.1 Overview
9.2. North America Confocal Raman Spectroscopy Market
9.2.1 Key Market Trends, Growth Factors and Opportunities
9.2.2 Top Key Companies
9.2.3 Historic and Forecasted Market Size by Segments
9.2.4 Historic and Forecast Market Size by Country
9.2.4.1 US
9.2.4.2 Canada
9.2.4.3 Mexico
9.3. Eastern Europe Confocal Raman Spectroscopy Market
9.3.1 Key Market Trends, Growth Factors and Opportunities
9.3.2 Top Key Companies
9.3.3 Historic and Forecasted Market Size by Segments
9.3.4 Historic and Forecast Market Size by Country
9.3.4.1 Russia
9.3.4.2 Bulgaria
9.3.4.3 The Czech Republic
9.3.4.4 Hungary
9.3.4.5 Poland
9.3.4.6 Romania
9.3.4.7 Rest of Eastern Europe
9.4. Western Europe Confocal Raman Spectroscopy Market
9.4.1 Key Market Trends, Growth Factors and Opportunities
9.4.2 Top Key Companies
9.4.3 Historic and Forecasted Market Size by Segments
9.4.4 Historic and Forecast Market Size by Country
9.4.4.1 Germany
9.4.4.2 UK
9.4.4.3 France
9.4.4.4 The Netherlands
9.4.4.5 Italy
9.4.4.6 Spain
9.4.4.7 Rest of Western Europe
9.5. Asia Pacific Confocal Raman Spectroscopy Market
9.5.1 Key Market Trends, Growth Factors and Opportunities
9.5.2 Top Key Companies
9.5.3 Historic and Forecasted Market Size by Segments
9.5.4 Historic and Forecast Market Size by Country
9.5.4.1 China
9.5.4.2 India
9.5.4.3 Japan
9.5.4.4 South Korea
9.5.4.5 Malaysia
9.5.4.6 Thailand
9.5.4.7 Vietnam
9.5.4.8 The Philippines
9.5.4.9 Australia
9.5.4.10 New Zealand
9.5.4.11 Rest of APAC
9.6. Middle East & Africa Confocal Raman Spectroscopy Market
9.6.1 Key Market Trends, Growth Factors and Opportunities
9.6.2 Top Key Companies
9.6.3 Historic and Forecasted Market Size by Segments
9.6.4 Historic and Forecast Market Size by Country
9.6.4.1 Turkiye
9.6.4.2 Bahrain
9.6.4.3 Kuwait
9.6.4.4 Saudi Arabia
9.6.4.5 Qatar
9.6.4.6 UAE
9.6.4.7 Israel
9.6.4.8 South Africa
9.7. South America Confocal Raman Spectroscopy Market
9.7.1 Key Market Trends, Growth Factors and Opportunities
9.7.2 Top Key Companies
9.7.3 Historic and Forecasted Market Size by Segments
9.7.4 Historic and Forecast Market Size by Country
9.7.4.1 Brazil
9.7.4.2 Argentina
9.7.4.3 Rest of SA
Chapter 10 Analyst Viewpoint and Conclusion
Chapter 11 Our Thematic Research Methodology
11.1 Research Process
11.2 Primary Research
11.3 Secondary Research
Chapter 12 Case Study
Chapter 13 Appendix
13.1 Sources
13.2 List of Tables and figures
13.3 Short Forms and Citations
13.4 Assumption and Conversion
13.5 Disclaimer
| Confocal Raman Spectroscopy Market | |||
|
Base Year: |
2024 |
Forecast Period: |
2025-2035 |
|
Historical Data: |
2018 to 2023 |
Market Size in 2024: |
USD 0.31 Billion |
|
Forecast Period 2025-35 CAGR: |
6.8 % |
Market Size in 2035: |
USD 0.64 Billion |
|
|
By Type |
|
|
|
|
By Application |
|
|
|
By Technique |
|
||
|
By End User |
|
||
|
By Region |
|
||
|
Growth Driver: |
|
||
|
Limiting Factor |
|
||
|
Expansion Opportunity |
|
||
|
Challenge and Risk |
|
||
|
Companies Covered in the Report: |
|
||


