


Biological Augmentation Services Market Overview
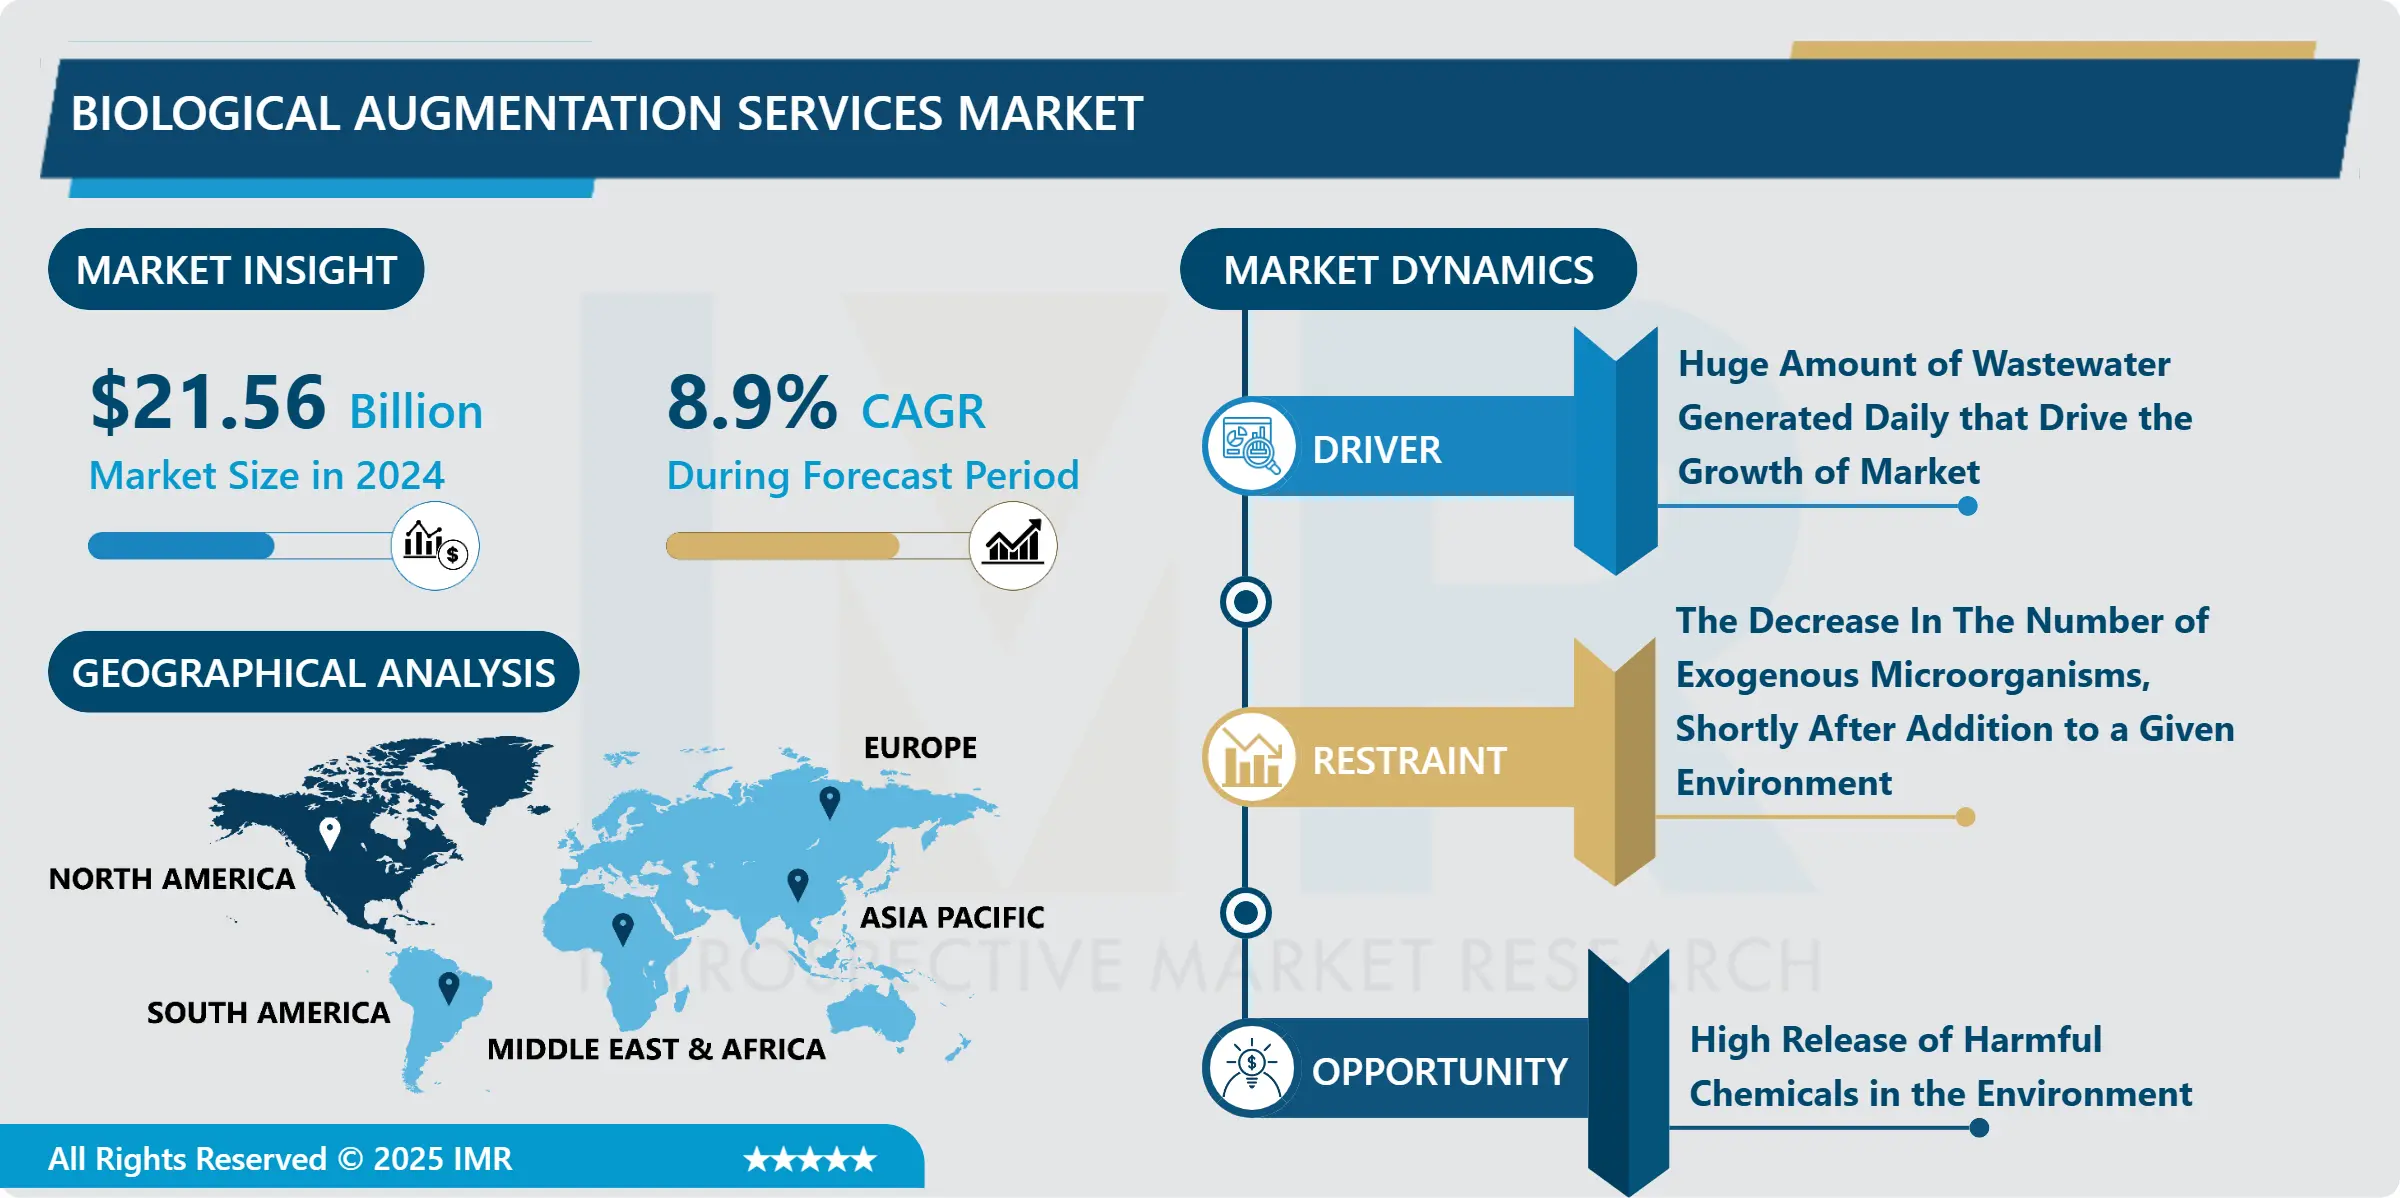
The Global Biological Augmentation Services Market size is expected to grow from USD 21.56 Billion in 2024 to USD 55.08 Billion by 2035, at a CAGR of 8.9% during the forecast period 2025-2035
Biological augmentation is the integration of modern technology and living microorganisms for the degradation of pollutants in contaminated sites. Biological augmentation is the utilization of specific micro-organisms which have unique characteristics that are employed in contaminated locations to eliminate the target pollutants. Moreover, Bioaugmentation technology has various applications and can be administered in all the wastewater treatment plants that are utilizing the activated sludge treatment process, irrespectively of their layout and configuration. Furthermore, Bioaugmentation is an eco-friendly and economically favorable method for improved degradation of pollutants and pathogens by the addition of pre-grown microbe or microbial cocultures in the medium. Biological augmentation services are a promising alternative procedure to remediate chlorinated ethene-contaminated groundwater as compared to physicochemical methods. Among the available biological methods to treat polluted soil and water, bioaugmentation is the most widely preferred technology for the decomposition of inorganic or organic pollutants and their residues from the environment. In addition, biological augmentation services are the green technologies that have shown promising results in decomposing contaminants from soil and water. With the growing industrial usage of water and the rising demand for eco-friendly technologies to disinfect contaminated locations, governments are incorporating biological augmentation services to disinfect water and make it reusable for industries and other purposes.

Market Dynamics and Factors in Biological Augmentation Services Market:
Drivers:
- A promising durable and sustainable solution to the rising scarcity of water worldwide is to recycle and reuse wastewater. In wastewater treatment plants, the biodegradation of contaminants or pollutants by exploiting microorganisms present in activated sludge is the most important technique to eliminate organic contaminants found in wastewater. The traditional Physico-chemical treatment methods include several processes and the overall cost involved is not feasible. In addition, the byproducts generated by this process are toxic to the environment thus, treatment of wastewater through biological augmentation services is economically favorable and environmentally friendlier. Moreover, naturally occurring microorganisms are present in activated sludge that can decompose a wide range of pollutants, but some pollutants are resistant to this degradation process. Bioaugmentation services can tackle these challenges, as one of its main benefits is that treatment of contaminated sites can be tailored to a specific pollutant that is predominant in the environment. Thus, this method is attractive for tackling both the rising number of emerging pollutants as well as pollutants that are present at high concentrations in a given location.
- Furthermore, the pulp and paper industry generates a huge amount of wastewater which is high in lignin concentration, known as black liquor. In addition, the selection and addition of lignin decomposing microorganisms into wastewater aids in removing specific pollutants originating from black liquor. Moreover, bioaugmentation of polluted water increases the clarity of the water. In addition, it reduces the concentration of ammonia, nitrite, and phosphate. Bioaugmentation of polluted water also removes the excess nutrients and noxious odors. Bioaugmentation technology can effectively remove target pollutants, accelerate system startup, improve the system's ability to resist hydraulic and organic loads, and enhance the stability of system flora structure and function.
Restraints:
- The decrease in the number of exogenous microorganisms, shortly after addition to a given environment is a vital concern while employing bioaugmentation services. In addition, the gradual decrease in the number of microorganisms can be attributed to both biotic and abiotic stress. Moreover, the stresses occur due to insufficient substrates, temperature changes, competition between introduced and indigenous microorganisms, pH, nutrient limitations, phase infections, the shock of pollutant load, grazing by protozoa, and factors associated with quorum sensing (QS), thus, hampering the growth of biological augmentation services market during the forecast period.
- The inoculum size is an essential factor for successful bioaugmentation. If the density of inoculum is low then there is a higher possibility of protozoan grazing. Protozoan grazing or growth of protozoan destroys the inoculated bacteria thus, affecting the functioning of the microorganism responsible for the degradation of pollutants. Moreover, the most successful cases of bioaugmentation are demonstrated in confined systems, such as bioreactors in which the environmental factors can be controlled to favor survival and prolonged activity of the exogenous microbial population, this limitation of biological augmentation services restricts the expansion of the market in the forecast period.
Opportunities:
- The growing wastewater production and the release of harmful chemicals in the environment are the concerning factors that restrict the development of several industrial verticals. Moreover, the ever-growing requirement of freshwater for public and industrial usage is compelling governments to find alternative methods to treat wastewater. Immobilization (entrapment or encapsulation) of microorganisms in the process that consists of entrapping live microorganisms within a semi-permeable gel or carrier materials, which offers several benefits over the free cell bioaugmentation. Additionally, it can also protect inoculated microorganisms against protozoa grazing and bacteriophage infections. Recent studies have shown that immobilization of microorganisms improves biological and physical stabilities, by decreasing challenges such as sudden and brief variations of temperature or pH and protecting from abiotic stresses such as the inhibitory effect of toxic compounds or heavy metals thus, market players can develop novel techniques to enhance immobilization process. Moreover, the growing investment by governments in research activities of biotechnological processes to develop novel technologies to tackle wastewater generated by several industries is offering lucrative opportunities for the market players. The modulation of quorum sensing to increase the formation of biofilms could also contribute to the improvement of bioaugmentation for wastewater treatment. The administration of genetically modified microorganisms (GMM) is another novel technique to improve bioaugmentation, thus stimulating market players to collaborate with research institutes to develop novel strains of bacteria that can be utilized in bioaugmentation services.
Market Segmentation
Segmentation of Biological Augmentation Services Market:
- Depending on the type of microorganism, the bacteria segment is forecasted to have the highest share of the biological augmentation services market. The presence of a wide range of bacterial strains and their capability to thrive in harsh environmental conditions make them the most preferred option for the wastewater treatment process. Moreover, bacteria are the predominant biological composition present in activated sludge and play a vital role in the structural and functional performance of flocs. Furthermore, genetically modified bacteria can decompose heavy metals from cosmetics, pharmaceutical, and detergents industries. Acknowledging the wide usage of bacteria in the treatment of pollutants the demand for genetically modified bacterial species is going to rise in the forecast period.
- Depending on usage, the water segment is anticipated to dominate the biological augmentation services market during the forecast period. Water plays an important role in several industrial processes. Moreover, the rise in wastewater production from industrial verticals and the presence of toxic pollutants are driving the need to decompose the contaminants. The accumulation of pollutants in groundwater and the growing scarcity of water has forced governments to make wastewater potable for drinking through bioaugmentation services thus, supporting the development of this segment.
- Depending on applications, the municipal segment is expected to lead the biological augmentation services market in the forecast period. Municipal corporations play an important role in supplying fresh water for both public and industrial purposes. Moreover, the growing number of governments regulated sewage water treatment plants, and the rising fundings to enhance the functionality of these plants is consolidating the growth of this segment.
Regional Analysis of Biological Augmentation Services Market:
- The North American region is anticipated to dominate the bioaugmentation services market during the forecast period. The USA and Canada are the major economies contributing to the expansion of the market in this region. Moreover, in the USA, drinking water and wastewater systems account for 3-4% of energy usage and emit more than 45 million tons of Greenhouse gases a year. In addition, the most common pollutant of groundwater in the USA is gasoline. There are thousands of steel tanks discharging gas into the soil beneath old gas stations attributed to the corrosion of drums. Additionally, the government is employing bioaugmentation services to clean up the contaminated soil rather than implementing the expensive, labor-intensive process of manual cleanup. Furthermore, the U.S. Department of Energy is even investigating the advantages of utilizing microbes, or genetically modified strains of known microbes, to clean up radiation from sites leftover from the production of nuclear weapons thus, strengthening the expansion of the market in this region.
- Asia-Pacific region is forecasted to grow at the highest growth rate, attributed to the rise in the production of sewage water. Moreover, the growing technological advancements in the field of biotechnology have stimulated the government to adopt ecofriendly methods to decompose the harmful toxins present in sewage water. China, India, Japan, Singapore, and Australia are the major countries that have adopted the usage of biological augmentation services at a large scale. Singapore is the prominent country in this region, which has adapted to the 'toilet to tap' concept. The country filters toilet water through bioaugmentation technology and makes it reusable for industrial and drinking purposes. The depleting groundwater sources in India has forced the government to utilize the potential of bioaugmentation services, thus accelerating the development of the market in this region.
- The European region is expected to have a significant growth rate in the forecasted timespan. The countries in this region are striving to eliminate toxins found in the wastewater. Moreover, the supportive government policies and the rise in the fundings for the implementation of bioaugmentation services to treat contaminated water and soil are the main factors fueling the expansion of the market in this region.
- The Middle-East and Africa region is predicted to have a positive growth rate over the projection period. The scarcity of water in this region has forced the governments to invest in research activities to make wastewater potable for drinking. Moreover, the funding by philanthropists to provide drinkable water for the population residing in this region is boosting the development of the market in this region.
Players Covered in Biological Augmentation Services market are :
- Black Lagoon (US)
- SOLitude Lake Management (US)
- LakePro Inc. (US)
- OMEX (UK)
- RF WasteWater (US)
- SUEZ (France)
- Aquatic Biologists Inc. (the US)
- Parklink Limited (New Zealand)
- WET USA (US)
- Barber's Chemicals (US)
- Skyhawk Global (UK)
- Kurita Water Industries Ltd. (Japan)
- Acti-Zyme Products Ltd. (Canada)
- Aquatic Plus Pond Management LLC (US)
- Oxybeesolutions (India)
- Enva (Ireland)
Key Industry Developments in Biological Augmentation Services Market:
- In May 2024, Sabrina Soussan, Chairman and CEO of SUEZ, and Rémy Rioux, CEO of AFD, signed a new partnership agreement aimed at intensifying the collaboration between their organizations. This three-year partnership provided SUEZ and AFD the opportunity to take tangible and joint action in support of the UN's Sustainable Development Goals.
|
Biological Augmentation Services Market |
|||
|
Base Year: |
2024 |
Forecast Period: |
2025-2035 |
|
Historical Data: |
2018 to 2023 |
Market Size in 2024 |
USD 21.56 Bn. |
|
Forecast Period 2025-35 CAGR: |
8.9% |
Market Size in 2035: |
USD 55.08 Bn. |
|
Segments Covered: |
By Type |
|
|
|
By Application |
|
||
|
By Usage |
|
||
|
By Region |
|
||
|
Key Market Drivers: |
|
||
|
Key Market Restraints: |
|
||
|
Key Opportunities: |
|
||
|
Companies Covered in the report: |
|
||
Chapter 1: Introduction
1.1 Scope and Coverage
Chapter 2:Executive Summary
Chapter 3: Market Landscape
3.1 Market Dynamics
3.1.1 Drivers
3.1.2 Restraints
3.1.3 Opportunities
3.1.4 Challenges
3.2 Market Trend Analysis
3.3 PESTLE Analysis
3.4 Porter's Five Forces Analysis
3.5 Industry Value Chain Analysis
3.6 Ecosystem
3.7 Regulatory Landscape
3.8 Price Trend Analysis
3.9 Patent Analysis
3.10 Technology Evolution
3.11 Investment Pockets
3.12 Import-Export Analysis
Chapter 4: Biological Augmentation Services Market by Type (2018-2035)
4.1 Biological Augmentation Services Market Snapshot and Growth Engine
4.2 Market Overview
4.3 Archaea
4.3.1 Introduction and Market Overview
4.3.2 Historic and Forecasted Market Size in Value USD and Volume Units
4.3.3 Key Market Trends, Growth Factors, and Opportunities
4.3.4 Geographic Segmentation Analysis
4.4 Bacterial
4.5 Fungi
Chapter 5: Biological Augmentation Services Market by Application (2018-2035)
5.1 Biological Augmentation Services Market Snapshot and Growth Engine
5.2 Market Overview
5.3 Industrial
5.3.1 Introduction and Market Overview
5.3.2 Historic and Forecasted Market Size in Value USD and Volume Units
5.3.3 Key Market Trends, Growth Factors, and Opportunities
5.3.4 Geographic Segmentation Analysis
5.4 Agriculture
5.5 Municipal
Chapter 6: Biological Augmentation Services Market by Usage (2018-2035)
6.1 Biological Augmentation Services Market Snapshot and Growth Engine
6.2 Market Overview
6.3 Automotive
6.3.1 Introduction and Market Overview
6.3.2 Historic and Forecasted Market Size in Value USD and Volume Units
6.3.3 Key Market Trends, Growth Factors, and Opportunities
6.3.4 Geographic Segmentation Analysis
6.4 Aerospace
6.5 Electronics
6.6 Medical
6.7 Mining & Drilling
6.8 Others
Chapter 7: Company Profiles and Competitive Analysis
7.1 Competitive Landscape
7.1.1 Competitive Benchmarking
7.1.2 Biological Augmentation Services Market Share by Manufacturer (2024)
7.1.3 Industry BCG Matrix
7.1.4 Heat Map Analysis
7.1.5 Mergers and Acquisitions
7.2 AT&T (DALLAS
7.2.1 Company Overview
7.2.2 Key Executives
7.2.3 Company Snapshot
7.2.4 Role of the Company in the Market
7.2.5 Sustainability and Social Responsibility
7.2.6 Operating Business Segments
7.2.7 Product Portfolio
7.2.8 Business Performance
7.2.9 Key Strategic Moves and Recent Developments
7.2.10 SWOT Analysis
7.3 TEXAS
7.4 USA)
7.5 VERIZON COMMUNICATIONS (NEW YORK CITY
7.6 NEW YORK
7.7 USA)
7.8 ERICSSON (HEADQUARTERS STOCKHOLM
7.9 SWEDEN)
7.10 HUAWEI TECHNOLOGIES CO. (SHENZHEN
7.11 GUANGDONG
7.12 CHINA)
7.13 SPRINT CORPORATION (OVERLAND PARK
7.14 KANSAS
7.15 USA)
7.16 DEUTSCHE TELEKOM AG (BONN
7.17 GERMANY)
7.18 VODAFONE (LONDON
7.19 UNITED KINGDOM)
7.20 AERIS (SAN JOSE
7.21 CALIFORNIA
7.22 USA)
7.23 T-MOBILE (BELLEVUE
7.24 WASHINGTON
7.25 USA)
7.26 OTHER MAJOR PLAYERS
Chapter 8: Global Biological Augmentation Services Market By Region
8.1 Overview
8.2. North America Biological Augmentation Services Market
8.2.1 Key Market Trends, Growth Factors and Opportunities
8.2.2 Top Key Companies
8.2.3 Historic and Forecasted Market Size by Segments
8.2.4 Historic and Forecasted Market Size by Type
8.2.4.1 Archaea
8.2.4.2 Bacterial
8.2.4.3 Fungi
8.2.5 Historic and Forecasted Market Size by Application
8.2.5.1 Industrial
8.2.5.2 Agriculture
8.2.5.3 Municipal
8.2.6 Historic and Forecasted Market Size by Usage
8.2.6.1 Automotive
8.2.6.2 Aerospace
8.2.6.3 Electronics
8.2.6.4 Medical
8.2.6.5 Mining & Drilling
8.2.6.6 Others
8.2.7 Historic and Forecast Market Size by Country
8.2.7.1 US
8.2.7.2 Canada
8.2.7.3 Mexico
8.3. Eastern Europe Biological Augmentation Services Market
8.3.1 Key Market Trends, Growth Factors and Opportunities
8.3.2 Top Key Companies
8.3.3 Historic and Forecasted Market Size by Segments
8.3.4 Historic and Forecasted Market Size by Type
8.3.4.1 Archaea
8.3.4.2 Bacterial
8.3.4.3 Fungi
8.3.5 Historic and Forecasted Market Size by Application
8.3.5.1 Industrial
8.3.5.2 Agriculture
8.3.5.3 Municipal
8.3.6 Historic and Forecasted Market Size by Usage
8.3.6.1 Automotive
8.3.6.2 Aerospace
8.3.6.3 Electronics
8.3.6.4 Medical
8.3.6.5 Mining & Drilling
8.3.6.6 Others
8.3.7 Historic and Forecast Market Size by Country
8.3.7.1 Russia
8.3.7.2 Bulgaria
8.3.7.3 The Czech Republic
8.3.7.4 Hungary
8.3.7.5 Poland
8.3.7.6 Romania
8.3.7.7 Rest of Eastern Europe
8.4. Western Europe Biological Augmentation Services Market
8.4.1 Key Market Trends, Growth Factors and Opportunities
8.4.2 Top Key Companies
8.4.3 Historic and Forecasted Market Size by Segments
8.4.4 Historic and Forecasted Market Size by Type
8.4.4.1 Archaea
8.4.4.2 Bacterial
8.4.4.3 Fungi
8.4.5 Historic and Forecasted Market Size by Application
8.4.5.1 Industrial
8.4.5.2 Agriculture
8.4.5.3 Municipal
8.4.6 Historic and Forecasted Market Size by Usage
8.4.6.1 Automotive
8.4.6.2 Aerospace
8.4.6.3 Electronics
8.4.6.4 Medical
8.4.6.5 Mining & Drilling
8.4.6.6 Others
8.4.7 Historic and Forecast Market Size by Country
8.4.7.1 Germany
8.4.7.2 UK
8.4.7.3 France
8.4.7.4 The Netherlands
8.4.7.5 Italy
8.4.7.6 Spain
8.4.7.7 Rest of Western Europe
8.5. Asia Pacific Biological Augmentation Services Market
8.5.1 Key Market Trends, Growth Factors and Opportunities
8.5.2 Top Key Companies
8.5.3 Historic and Forecasted Market Size by Segments
8.5.4 Historic and Forecasted Market Size by Type
8.5.4.1 Archaea
8.5.4.2 Bacterial
8.5.4.3 Fungi
8.5.5 Historic and Forecasted Market Size by Application
8.5.5.1 Industrial
8.5.5.2 Agriculture
8.5.5.3 Municipal
8.5.6 Historic and Forecasted Market Size by Usage
8.5.6.1 Automotive
8.5.6.2 Aerospace
8.5.6.3 Electronics
8.5.6.4 Medical
8.5.6.5 Mining & Drilling
8.5.6.6 Others
8.5.7 Historic and Forecast Market Size by Country
8.5.7.1 China
8.5.7.2 India
8.5.7.3 Japan
8.5.7.4 South Korea
8.5.7.5 Malaysia
8.5.7.6 Thailand
8.5.7.7 Vietnam
8.5.7.8 The Philippines
8.5.7.9 Australia
8.5.7.10 New Zealand
8.5.7.11 Rest of APAC
8.6. Middle East & Africa Biological Augmentation Services Market
8.6.1 Key Market Trends, Growth Factors and Opportunities
8.6.2 Top Key Companies
8.6.3 Historic and Forecasted Market Size by Segments
8.6.4 Historic and Forecasted Market Size by Type
8.6.4.1 Archaea
8.6.4.2 Bacterial
8.6.4.3 Fungi
8.6.5 Historic and Forecasted Market Size by Application
8.6.5.1 Industrial
8.6.5.2 Agriculture
8.6.5.3 Municipal
8.6.6 Historic and Forecasted Market Size by Usage
8.6.6.1 Automotive
8.6.6.2 Aerospace
8.6.6.3 Electronics
8.6.6.4 Medical
8.6.6.5 Mining & Drilling
8.6.6.6 Others
8.6.7 Historic and Forecast Market Size by Country
8.6.7.1 Turkiye
8.6.7.2 Bahrain
8.6.7.3 Kuwait
8.6.7.4 Saudi Arabia
8.6.7.5 Qatar
8.6.7.6 UAE
8.6.7.7 Israel
8.6.7.8 South Africa
8.7. South America Biological Augmentation Services Market
8.7.1 Key Market Trends, Growth Factors and Opportunities
8.7.2 Top Key Companies
8.7.3 Historic and Forecasted Market Size by Segments
8.7.4 Historic and Forecasted Market Size by Type
8.7.4.1 Archaea
8.7.4.2 Bacterial
8.7.4.3 Fungi
8.7.5 Historic and Forecasted Market Size by Application
8.7.5.1 Industrial
8.7.5.2 Agriculture
8.7.5.3 Municipal
8.7.6 Historic and Forecasted Market Size by Usage
8.7.6.1 Automotive
8.7.6.2 Aerospace
8.7.6.3 Electronics
8.7.6.4 Medical
8.7.6.5 Mining & Drilling
8.7.6.6 Others
8.7.7 Historic and Forecast Market Size by Country
8.7.7.1 Brazil
8.7.7.2 Argentina
8.7.7.3 Rest of SA
Chapter 9 Analyst Viewpoint and Conclusion
9.1 Recommendations and Concluding Analysis
9.2 Potential Market Strategies
Chapter 10 Research Methodology
10.1 Research Process
10.2 Primary Research
10.3 Secondary Research
|
Biological Augmentation Services Market |
|||
|
Base Year: |
2024 |
Forecast Period: |
2025-2035 |
|
Historical Data: |
2018 to 2023 |
Market Size in 2024 |
USD 21.56 Bn. |
|
Forecast Period 2025-35 CAGR: |
8.9% |
Market Size in 2035: |
USD 55.08 Bn. |
|
Segments Covered: |
By Type |
|
|
|
By Application |
|
||
|
By Usage |
|
||
|
By Region |
|
||
|
Key Market Drivers: |
|
||
|
Key Market Restraints: |
|
||
|
Key Opportunities: |
|
||
|
Companies Covered in the report: |
|
||


