


Auto SCR System Market Synopsis
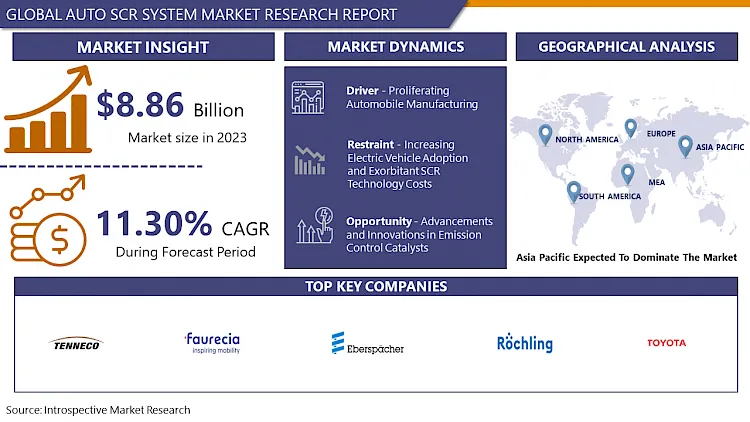
Auto SCR System Market Size Was Valued at USD 8.86 Billion in 2023 and is Projected to Reach USD 20.87 Billion by 2032, Growing at a CAGR of 11.30% From 2024-2032.
Diesel engines have the Auto SCR (Selective Catalytic Reduction) as its emissions control technology to lessen the nitrogen oxide (NOx) emissions. It works by injecting DEF, the urea-based solution into the exhaust stream. DEF reacts with NOx in the presence of a catalyst and this changes NOx to water and nitrogen which both have reduced environmental pollution. To meet tough emission standards modern diesel vehicles and machine equipment of today are equipped with SCR systems as a rule.
In specific, the Driver Auto Selective Catalytic Reduction (SCR) System in the automotive industry is an integral part of modern diesel engine technology. By changing the nitrogen oxides (NOx) into water vapor, nitrogen, and very small amounts of carbon dioxide, which pollute the environment to a much lesser extent, the system contributes to a decrease in harmful emissions.
The global market for Driver Auto SCR Systems has been growing steadily because more and more stringent emission regulations have been established. With environmental agencies and governments imposing tighter emission limitations on vehicles, automakers are adopting SCR systems to comply with these regulations.
Fuel economy automobiles also boost the growing market penetration of auto SCR systems. By improving engine performance, reducing fuel consumption, and lengthening the life of the engine and other components, SCR systems add up to better fuel efficiency.
The market is also driven by the astoundingly growing awareness of environmental issues and the urgency in air pollution mitigation. Subsequently, automakers are increasingly implementing SCR systems to fulfill customer demands for environmentally sound products and stick to emission standards.
As well as the fact that the market for Driver Auto SCR Systems is influenced by technological developments such as more effective catalysts and improved control systems. The spread of SCR systems in the automotive sector has also been facilitated by the enhanced efficiency and reliability of those innovations.

Auto SCR System Market Trend Analysis
Greening the Road, How SCR Systems Are Transforming the Automotive Industry
- A remarkable movement in the automotive selective catalytic reduction (SCR) systems market is the advent of new techniques and expansions. To meet the stricter emission regulations, the automotive industry is more and more using SCR systems, mostly diesel vehicles. Environmental problems and the regulations relating to them are lighting the path in the market to vehicles that are healthier and more efficient.
- Raising the adoption rate of SCR systems in commercial automobiles (e. g. , emission standard Euro VI and others work as a driving force behind this scenario. To meet these regulatory requirements, vehicles need to significantly reduce nitrogen oxide (NOx) emissions. SCR technology can appropriately carry out this purpose.
- Demand for auto SCR systems is being boosted by the additional factor that there is more need for cars that save gas. SCR technologies serve the purpose of engine fine-tuning for the reduction of emissions, hence the enhancement of the fuel economy. This is especially useful for heavy-duty vehicles which need large amounts of gasoline.
- The ongoing improvements in SCR technology incorporating the development of compact and efficient SCR catalysts are increasingly the focus of the automotive sector. DPFs and other emission control technologies are being added to SCR systems to optimize their efficiency.
Going Green Auto SCR Systems' Role in Sustainable Automotive Solutions
- The global market for Auto SCR (Selective Catalytic Reduction) systems has been experiencing exponential growth due to a series of factors. An important point here is that manufacturers can take advantage of increased emission mitigation focus and stringent environmental regulations. In particular, nitrogen oxides (NOx) which are a major contributor to air pollution and respiratory diseases are the focus of more stringent emission regulations in various countries.
- The boost in the utilization of cleaner technologies within the automotive industry means additional benefits. The SCR systems in automobiles not only convert NOx emissions into nitrogen and water vapor but also allow the vehicles to be in line with emission standards. Along with the efforts of nations to reduce their carbon emissions and uphold sustainable practices, it becomes apparent that the demand for Auto SCR systems will escalate.
- Second, the industry of commercial vehicles has a promising area for the producers of the SCR systems of autos. Commercial vehicles including buses and trucks are also a major source of NOx emissions because they consume large amounts of petroleum. Increased commercial vehicles, mainly in developing nations will most likely lead to more extensive implementation and popularization of Auto SCR systems.
Auto SCR System Market Segment Analysis:
Auto SCR System Market Segmented on the basis of Vehicle Type, Component, and Fuel type.
By Type, Passenger car segment is expected to dominate the market during the forecast period
- The market for Auto SCR systems is divided into two types of vehicles: passenger cars and commercial vehicles. Vehicles that are equipped with Auto SCR devices comply with these environmental standards because they produce reduced emissions. A rise in awareness about environmental concerns and the necessity of eco-friendly ways of travel becomes a driving force for this sector.
- Nevertheless, commercial vehicles, like buses and trucks have a large market for manufacture of the Auto SCR systems. These vehicles produce huge amounts of nitrogen oxides (NOx) due to the improved fuel consumption level. Stricter emission standards brought by governments all around the globe are predicted to boost the demand for Auto SCR systems in commercial vehicles.
By Component, the segment held the largest share in 2023
- Several essential elements compose the Auto SCR (Selective Catalytic Reduction) system: a pump, urea tank, injector, and electronic control unit (ECU).
- The urea solution (commonly called AdBlue or DEF) is delivered from the canister to the injector by the pump. The solution is stored in the urea tank until it comes to the exhaust system injection.
- The solution of urea is introduced into the exhaust stream through the injector where it undergoes a reaction with nitrogen oxides producing a harmless conversion of NOx to water vapor.
- Monitoring the engine and the exhaust system conditions is essential to inject urea solution appropriately for efficient NOx abatement. This is the responsibility of the ECU. It means that the right amount of urea is injected at the right time by the emission regulations.
- Auto SCR system, a proven technology, effectively controls the NOx emitted from vehicles, by coordinating these components, to ensure compliance with stringent emission regulations.
Auto SCR System Market Regional Insights:
Asia Pacific is Expected to Dominate the Market Over the Forecast period
- The use of Auto SCR systems is on the rise in the Asia-Pacific region, due to the heightened regulations on emissions in the countries like China and India. As an outcome of these regulations, which are intended to reduce the emission of harmful pollutants from vehicles, SCR systems have found more popularity in this region.
- As one of the biggest automotive markets in the world, China has played a very important role in this growth. Realized in stages beginning in 2018, the National VI emission standard stipulates that the SCR systems must be used in diesel vehicles to control NOx emissions. Consequently, a market has formed in China for SCR systems that are filled by both Chinese and international technology suppliers.
- India's BS-VI (Bharat Stage VI) emission standards, equivalent to Euro VI emission standards, are majorly responsible for its position as a big market for Auto SCR systems. Like China, India has put in place stringent emission regulations that require SCR technology in diesel vehicles; this has increased the desire for SCR systems in India as well.
- Asian countries like South Korea, Japan, and ASEAN states are to some extent also experiencing an influx of stricter regulations. Growing awareness of environment protection and increasing fuel efficiency in automobiles is likely to boost SCR systems demand in these regions.
Active Key Players in the Auto SCR System Market.
- Eberspacher Group (Germany)
- Toyota Motor Corporation (Japan)
- Röchling-Group (Germany)
- Faurecia SA (France)
- Sango Industrial (Japan)
- Futaba Industrial (Japan)
- Tenneco (United States)
- Amminex Emissions Technology (Denmark)
- SDC Materials (United States)
- Magneti Marelli S.p.A. (Italy)
- BorgWarner Inc. (United States)
- Johnson Matthey PLC (United Kingdom)
- Bosch Mobility Solutions (Germany)
- Continental AG (Germany)
- Delphi Technologies (United Kingdom)
- Eaton Corporation (United States)
- Denso Corporation (Japan)
- Honeywell International Inc. (United States)
- Schaeffler AG (Germany)
- Valeo SA (France) and Other Active Players
Key Industry Developments in the Auto SCR System Market
- In February 2024, LIQUI MOLY introduces DEF Anti Crystal Additive Concentrate, a new additive for AdBlue® to protect SCR systems in diesel engines from damage. Essential for meeting nitrogen oxide emission standards, AdBlue® can cause residue buildup without proper care. The additive, developed by LIQUI MOLY's Head of Research and Development, David Kaiser, leverages the Leidenfrost effect to ensure residue-free decomposition of AdBlue®, preventing damage to the exhaust system. This innovative solution enhances the efficiency of the selective catalytic reduction (SCR) system, crucial for maintaining compliant emissions in modern diesel vehicles.
|
Global Auto SCR System Market |
|||
|
Base Year: |
2024 |
Forecast Period: |
2024-2034 |
|
Historical Data: |
2017 to 2024 |
Market Size in 2024: |
USD 8.86 Bn. |
|
Forecast Period 2023-30 CAGR: |
11.30% |
Market Size in 2032: |
USD 20.87 Bn. |
|
Segments Covered: |
By Vehicle Type |
|
|
|
By Component |
|
||
|
By Fuel Type |
|
||
|
By Region |
|
||
|
Key Market Drivers: |
|
||
|
Key Market Restraints: |
|
||
|
Key Opportunities: |
|
||
|
Companies Covered in the report: |
|
||
Chapter 1: Introduction
1.1 Scope and Coverage
Chapter 2:Executive Summary
Chapter 3: Market Landscape
3.1 Market Dynamics
3.1.1 Drivers
3.1.2 Restraints
3.1.3 Opportunities
3.1.4 Challenges
3.2 Market Trend Analysis
3.3 PESTLE Analysis
3.4 Porter's Five Forces Analysis
3.5 Industry Value Chain Analysis
3.6 Ecosystem
3.7 Regulatory Landscape
3.8 Price Trend Analysis
3.9 Patent Analysis
3.10 Technology Evolution
3.11 Investment Pockets
3.12 Import-Export Analysis
Chapter 4: Auto SCR System Market by Vehicle Type (2018-2032)
4.1 Auto SCR System Market Snapshot and Growth Engine
4.2 Market Overview
4.3 Passenger Cars
4.3.1 Introduction and Market Overview
4.3.2 Historic and Forecasted Market Size in Value USD and Volume Units
4.3.3 Key Market Trends, Growth Factors, and Opportunities
4.3.4 Geographic Segmentation Analysis
4.4 Commercial Vehicles
Chapter 5: Auto SCR System Market by Component (2018-2032)
5.1 Auto SCR System Market Snapshot and Growth Engine
5.2 Market Overview
5.3 Pump
5.3.1 Introduction and Market Overview
5.3.2 Historic and Forecasted Market Size in Value USD and Volume Units
5.3.3 Key Market Trends, Growth Factors, and Opportunities
5.3.4 Geographic Segmentation Analysis
5.4 Urea tank
5.5 Injector
5.6 ECU
Chapter 6: Auto SCR System Market by Fuel Type (2018-2032)
6.1 Auto SCR System Market Snapshot and Growth Engine
6.2 Market Overview
6.3 Diesel
6.3.1 Introduction and Market Overview
6.3.2 Historic and Forecasted Market Size in Value USD and Volume Units
6.3.3 Key Market Trends, Growth Factors, and Opportunities
6.3.4 Geographic Segmentation Analysis
6.4 Gasoline
Chapter 7: Company Profiles and Competitive Analysis
7.1 Competitive Landscape
7.1.1 Competitive Benchmarking
7.1.2 Auto SCR System Market Share by Manufacturer (2024)
7.1.3 Industry BCG Matrix
7.1.4 Heat Map Analysis
7.1.5 Mergers and Acquisitions
7.2 APPLIED RESEARCH ASSOCIATE INCCOBHAM PLC
7.2.1 Company Overview
7.2.2 Key Executives
7.2.3 Company Snapshot
7.2.4 Role of the Company in the Market
7.2.5 Sustainability and Social Responsibility
7.2.6 Operating Business Segments
7.2.7 Product Portfolio
7.2.8 Business Performance
7.2.9 Key Strategic Moves and Recent Developments
7.2.10 SWOT Analysis
7.3 RAYTHEON COMPANY
7.4 DOMO TACTICAL COMMUNICATIONS (DTC)
7.5 LEONARDO SPA
7.6 MCQ INCELBIT SYSTEMS LTDL3 TECHNOLOGIES INCPRUST HOLDING BV
7.7 NORTHROP GRUMMAN CORPORATION
7.8 TEXTRON SYSTEMS
7.9 THALES GROUP
7.10 LOCKHEED MARTIN CORPORATION
7.11 BERTIN INSTRUMENTS
7.12 EXENSOR TECHNOLOGY AB
7.13 BAE SYSTEMS
7.14 DRS TECHNOLOGIES INCSAAB AB
7.15 QINETIQ GROUP
7.16 GENERAL DYNAMICS MISSION SYSTEMS
7.17 HARRIS CORPORATION
Chapter 8: Global Auto SCR System Market By Region
8.1 Overview
8.2. North America Auto SCR System Market
8.2.1 Key Market Trends, Growth Factors and Opportunities
8.2.2 Top Key Companies
8.2.3 Historic and Forecasted Market Size by Segments
8.2.4 Historic and Forecasted Market Size by Vehicle Type
8.2.4.1 Passenger Cars
8.2.4.2 Commercial Vehicles
8.2.5 Historic and Forecasted Market Size by Component
8.2.5.1 Pump
8.2.5.2 Urea tank
8.2.5.3 Injector
8.2.5.4 ECU
8.2.6 Historic and Forecasted Market Size by Fuel Type
8.2.6.1 Diesel
8.2.6.2 Gasoline
8.2.7 Historic and Forecast Market Size by Country
8.2.7.1 US
8.2.7.2 Canada
8.2.7.3 Mexico
8.3. Eastern Europe Auto SCR System Market
8.3.1 Key Market Trends, Growth Factors and Opportunities
8.3.2 Top Key Companies
8.3.3 Historic and Forecasted Market Size by Segments
8.3.4 Historic and Forecasted Market Size by Vehicle Type
8.3.4.1 Passenger Cars
8.3.4.2 Commercial Vehicles
8.3.5 Historic and Forecasted Market Size by Component
8.3.5.1 Pump
8.3.5.2 Urea tank
8.3.5.3 Injector
8.3.5.4 ECU
8.3.6 Historic and Forecasted Market Size by Fuel Type
8.3.6.1 Diesel
8.3.6.2 Gasoline
8.3.7 Historic and Forecast Market Size by Country
8.3.7.1 Russia
8.3.7.2 Bulgaria
8.3.7.3 The Czech Republic
8.3.7.4 Hungary
8.3.7.5 Poland
8.3.7.6 Romania
8.3.7.7 Rest of Eastern Europe
8.4. Western Europe Auto SCR System Market
8.4.1 Key Market Trends, Growth Factors and Opportunities
8.4.2 Top Key Companies
8.4.3 Historic and Forecasted Market Size by Segments
8.4.4 Historic and Forecasted Market Size by Vehicle Type
8.4.4.1 Passenger Cars
8.4.4.2 Commercial Vehicles
8.4.5 Historic and Forecasted Market Size by Component
8.4.5.1 Pump
8.4.5.2 Urea tank
8.4.5.3 Injector
8.4.5.4 ECU
8.4.6 Historic and Forecasted Market Size by Fuel Type
8.4.6.1 Diesel
8.4.6.2 Gasoline
8.4.7 Historic and Forecast Market Size by Country
8.4.7.1 Germany
8.4.7.2 UK
8.4.7.3 France
8.4.7.4 The Netherlands
8.4.7.5 Italy
8.4.7.6 Spain
8.4.7.7 Rest of Western Europe
8.5. Asia Pacific Auto SCR System Market
8.5.1 Key Market Trends, Growth Factors and Opportunities
8.5.2 Top Key Companies
8.5.3 Historic and Forecasted Market Size by Segments
8.5.4 Historic and Forecasted Market Size by Vehicle Type
8.5.4.1 Passenger Cars
8.5.4.2 Commercial Vehicles
8.5.5 Historic and Forecasted Market Size by Component
8.5.5.1 Pump
8.5.5.2 Urea tank
8.5.5.3 Injector
8.5.5.4 ECU
8.5.6 Historic and Forecasted Market Size by Fuel Type
8.5.6.1 Diesel
8.5.6.2 Gasoline
8.5.7 Historic and Forecast Market Size by Country
8.5.7.1 China
8.5.7.2 India
8.5.7.3 Japan
8.5.7.4 South Korea
8.5.7.5 Malaysia
8.5.7.6 Thailand
8.5.7.7 Vietnam
8.5.7.8 The Philippines
8.5.7.9 Australia
8.5.7.10 New Zealand
8.5.7.11 Rest of APAC
8.6. Middle East & Africa Auto SCR System Market
8.6.1 Key Market Trends, Growth Factors and Opportunities
8.6.2 Top Key Companies
8.6.3 Historic and Forecasted Market Size by Segments
8.6.4 Historic and Forecasted Market Size by Vehicle Type
8.6.4.1 Passenger Cars
8.6.4.2 Commercial Vehicles
8.6.5 Historic and Forecasted Market Size by Component
8.6.5.1 Pump
8.6.5.2 Urea tank
8.6.5.3 Injector
8.6.5.4 ECU
8.6.6 Historic and Forecasted Market Size by Fuel Type
8.6.6.1 Diesel
8.6.6.2 Gasoline
8.6.7 Historic and Forecast Market Size by Country
8.6.7.1 Turkiye
8.6.7.2 Bahrain
8.6.7.3 Kuwait
8.6.7.4 Saudi Arabia
8.6.7.5 Qatar
8.6.7.6 UAE
8.6.7.7 Israel
8.6.7.8 South Africa
8.7. South America Auto SCR System Market
8.7.1 Key Market Trends, Growth Factors and Opportunities
8.7.2 Top Key Companies
8.7.3 Historic and Forecasted Market Size by Segments
8.7.4 Historic and Forecasted Market Size by Vehicle Type
8.7.4.1 Passenger Cars
8.7.4.2 Commercial Vehicles
8.7.5 Historic and Forecasted Market Size by Component
8.7.5.1 Pump
8.7.5.2 Urea tank
8.7.5.3 Injector
8.7.5.4 ECU
8.7.6 Historic and Forecasted Market Size by Fuel Type
8.7.6.1 Diesel
8.7.6.2 Gasoline
8.7.7 Historic and Forecast Market Size by Country
8.7.7.1 Brazil
8.7.7.2 Argentina
8.7.7.3 Rest of SA
Chapter 9 Analyst Viewpoint and Conclusion
9.1 Recommendations and Concluding Analysis
9.2 Potential Market Strategies
Chapter 10 Research Methodology
10.1 Research Process
10.2 Primary Research
10.3 Secondary Research
|
Global Auto SCR System Market |
|||
|
Base Year: |
2024 |
Forecast Period: |
2024-2034 |
|
Historical Data: |
2017 to 2024 |
Market Size in 2024: |
USD 8.86 Bn. |
|
Forecast Period 2023-30 CAGR: |
11.30% |
Market Size in 2032: |
USD 20.87 Bn. |
|
Segments Covered: |
By Vehicle Type |
|
|
|
By Component |
|
||
|
By Fuel Type |
|
||
|
By Region |
|
||
|
Key Market Drivers: |
|
||
|
Key Market Restraints: |
|
||
|
Key Opportunities: |
|
||
|
Companies Covered in the report: |
|
||


