


Cleaning Products Market Synopsis:
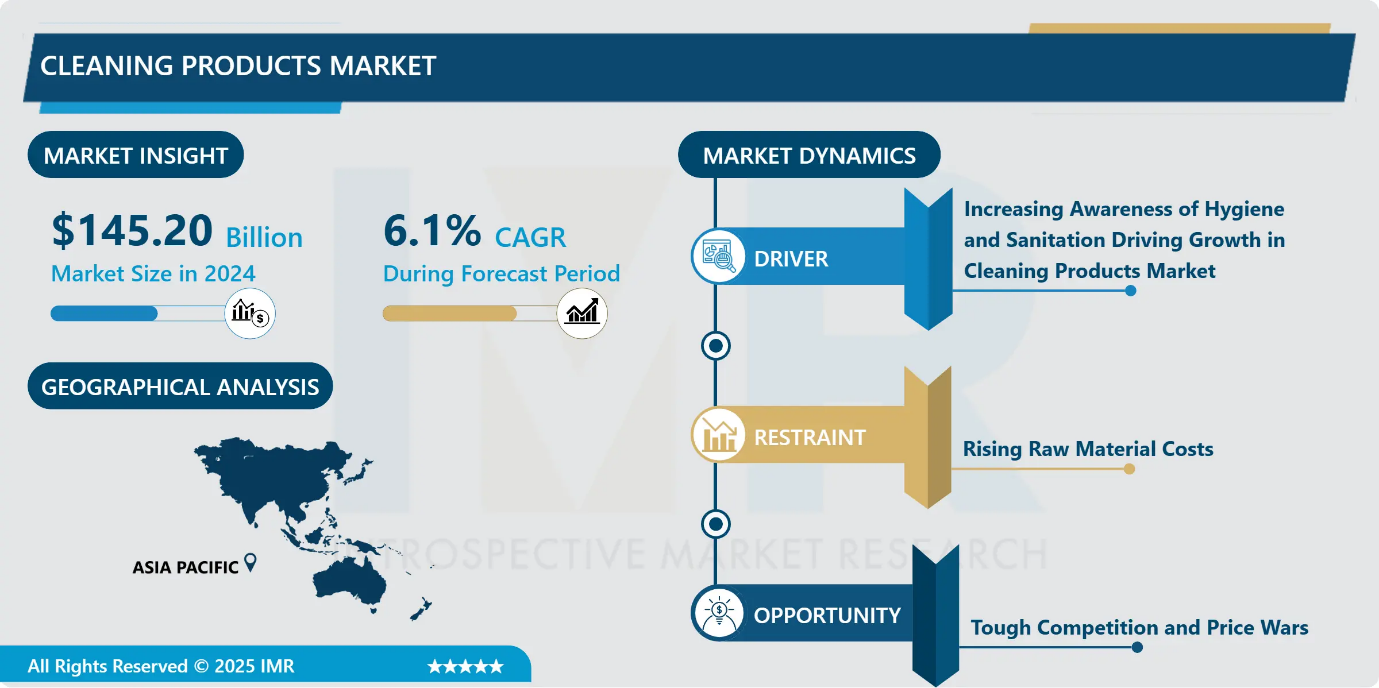
Cleaning products Market Size Was Valued at USD 145.20 Billion in 2024, and is Projected to Reach USD 278.51 Billion by 2035, Growing at a CAGR of 6.1% From 2025–2035.
The cleaning products market is growing fast because more people want better and safer products. Especially in developed countries, where people have more money to spend, customers are choosing cleaning products that work well and are good for the environment. They want products that clean effectively but don’t harm their health or the planet. Many also want products that fit into their smart homes and modern lifestyles.
Because of this, companies are focusing on making high-quality and eco-friendly cleaning products. These products often use natural ingredients and come in recyclable or biodegradable packaging. This makes them safer and better for the environment, which many customers appreciate. However, making these kinds of products is more expensive. The raw materials needed, like natural oils or plant-based chemicals, cost more than traditional ingredients. This makes it harder for companies to keep their prices low while still making good profits.
Companies also need to invest money in research and development to create new and better cleaning products. They need to find ways to make products that are both effective and eco-friendly but not too expensive. This requires time, effort, and money. Because of these challenges, companies must find the right balance between quality, price, and cost to stay competitive.
To succeed, companies are working on new ideas and adding more types of products to their collections. They are trying to offer unique cleaning solutions that attract customers who care about health, the environment, and convenience. Innovation and expanding their product range are important strategies for companies to grow in this market.
In summary, the cleaning products market has great opportunities, but companies must carefully manage costs, focus on innovation, and meet what modern customers want to stay ahead.
Cleaning Products Market Growth and Trend Analysis:
Cleaning Products Market Growth Driver - Increasing Awareness of Hygiene and Sanitation Driving Growth in Cleaning Products Market
-
Growing Awareness of Hygiene and Sanitation as people’s living conditions improve and they have more money to spend, especially in developing countries, they are becoming more aware of the importance of hygiene and cleanliness. People now understand that keeping their homes and surroundings clean is not just about looking nice it also helps prevent many diseases.
- In the past, illnesses like diarrhoea and worm infections were very common, but today these problems are getting less frequent. This is because more people are regularly using cleaning products at home and in public places like schools, offices, and parks. They have realized that spending just a few minutes cleaning can protect them from getting sick and save money on medical bills.
- Governments and organizations like NGOs have also played a big role in this change. They run campaigns to teach people about good hygiene habits and why it is important to keep clean. These health education programs help spread awareness about how simple actions, like washing hands, cleaning surfaces, and using disinfectants, can stop the spread of germs and keep communities healthier.
- As a result, more people are buying and using cleaning products regularly, which is helping the cleaning products market grow. This growing focus on hygiene and sanitation is making a big difference in people’s health and overall quality of life. It shows how awareness and education can help create safer and cleaner environments for everyone.
Cleaning Products Market Limiting Factor - Rising Raw Material Costs
-
One of the biggest challenges, or restraints, in the cleaning products market is the rising cost of raw materials. Raw materials are the basic ingredients and components used to make cleaning products, like chemicals, packaging materials, and natural ingredients. Over the past few years, the prices of many of these materials have gone up because of factors like supply shortages, increased demand, and higher transportation costs.
- When the cost of raw materials rises, it becomes more expensive for companies to produce cleaning products. This can lead to higher prices for the final products. However, many consumers expect cleaning products to remain affordable, so companies face pressure to keep prices low. This creates a difficult situation where companies must balance between higher production costs and customers’ willingness to pay.
- Because of these rising costs, some companies might reduce the quality of their products to save money, but this can hurt their reputation and customer trust. Others may try to absorb the higher costs, which lowers their profit margins and can affect their ability to invest in new products or marketing.
- Another challenge linked to raw material costs is the growing demand for eco-friendly and natural ingredients. These ingredients often cost more than traditional chemicals, making it even more expensive for companies to develop green cleaning products that many consumers want today.
- Overall, rising raw material costs create a major restraint for the cleaning products market. Companies need to find smart ways to manage these costs while still offering good quality products at prices customers can afford. This might include improving supply chains, finding alternative materials, or increasing efficiency in production.
Cleaning Products Market Expansion Opportunity - Tough Competition and Price Wars
-
The cleaning products market is full of many companies, both big international brands and smaller local businesses. Because there are so many companies, the competition has become very strong. Every company wants to sell more products and get more customers, so they often lower their prices to attract buyers. This creates something called price wars, where companies keep cutting prices to beat their competitors.
- While lower prices can be good for customers, they cause problems for the companies. When prices go down, the profit companies make from each product also goes down. This means companies earn less money, even if they sell a lot. To attract more buyers, companies also spend more on advertising, discounts, and special offers, which costs a lot of money.
- This makes it very hard for companies to find the right balance. They want to keep prices low so customers choose their products, but they also need to make enough money to keep running their business. This balance is especially tough for smaller companies, which may not have enough money to compete with big brands. Because of this, many small companies may struggle to survive.
- In some cases, smaller companies might join together with others to reduce costs and compete better. This is called merging or getting economies of scale, meaning they can produce goods cheaper by working together.
- Overall, the strong competition and price wars make it hard for cleaning product companies to grow and succeed. To do well, companies need to find new ways to stand out without just lowering prices all the time.
Cleaning Products Market Challenge and Risk - High Competition and Price Wars
-
The cleaning products market has become very crowded with many companies, both big international brands and smaller local ones. Because there are so many players, competition has become very strong. Companies want to sell more products and gain a bigger share of the market, so they often lower their prices to attract customers. This leads to price wars, where brands keep cutting prices to beat each other.
- While lower prices might be good for customers, these price wars create big problems for the companies. When prices drop, the money companies make from each product, called profit margins, becomes very small. This means they earn less money even if they sell a lot of products. To bring in customers, companies also have to spend more on advertising, promotions, and discounts, which increases their costs.
- Because of this, companies face a hard task: they need to keep prices low enough to compete but also make enough profit to stay in business. This balance is difficult to achieve. The smaller companies especially struggle because they don’t have as much money or resources as the big brands. Many small companies might find it hard to survive in such a tough market.
- In the future, some companies may join together, or merge, to reduce costs and compete better. This is called achieving economies of scale, which helps companies produce goods more cheaply.
- Overall, the high level of competition and price wars create challenges for cleaning product companies. It makes it harder for them to grow and succeed in the long run. Companies will need to find smart ways to stand out without just lowering prices.
Cleaning Products Market Segment Analysis:
Cleaning Products Market is segmented based on Type, Application, End-Users, and Region
By Type, Cleaning Products segment is expected to dominate the market during the forecast period
-
Surface cleaners are one of the most popular types of cleaning products, and they are expected to make up about more profit. This is because they are convenient and can be used for many different cleaning tasks. People use surface cleaners to quickly clean things like kitchen counters, floors, appliances, windows, and tables. These products are very useful in both homes and businesses because they work well on many kinds of surfaces.
- One big reason why surface cleaners are so popular is that they save time and effort. Most come ready to use in spray bottles or as cleaning wipes, so there’s no need to mix anything or use extra tools. You just spray or wipe, and the surface becomes clean and shiny. This is especially helpful for people who have busy lives and want to keep their spaces clean without spending a lot of time.
- Also, surface cleaners often include disinfecting ingredients, which means they don’t just remove dirt they also kill germs. This has become more important to people since the COVID-19 pandemic, as everyone is more aware of the need to keep things sanitary. The mix of convenience, time-saving, and germ-killing power makes surface cleaners a go-to choice for many households and businesses. As a result, their demand continues to grow, making them a major part of the overall cleaning products market.
By Application, Cleaning Products segment held the largest share in 2024
-
Surface cleaners are becoming one of the most popular types of cleaning products, and they are expected to make up about more profit of the cleaning products market. This is mainly because they are very convenient and can be used in many different ways. Surface cleaners are used to clean a wide range of things, such as kitchen counters, floors, windows, appliances, and tables. They work well in both homes and businesses, which makes them a smart and useful choice for many people.
- One of the biggest reasons people like surface cleaners is because they are easy to use and save time. Most surface cleaners come already mixed and ready in spray bottles or as cleaning wipes. This means you don’t have to spend time mixing solutions or using special tools. With just a quick spray or wipe, you can clean and shine a surface in seconds. This is very helpful for people who are busy and want to keep their homes or workplaces clean without spending too much time on it.
- Another great thing about surface cleaners is that many of them also disinfect. That means they don’t just clean away dirt they also kill germs and bacteria. This became especially important after the COVID-19 pandemic, as more people became aware of the importance of keeping things clean and safe. Because surface cleaners are fast, easy, and powerful, they are now seen as a must-have in many households and businesses. Their ability to clean multiple types of surfaces makes them a practical choice, which is why their demand is growing quickly in the cleaning products market.
Cleaning Products Market Regional Insights:
-
Asia Pacific region is leading the cleaning products market is growing quickly around the world. By 2025, this region is expected to have about more of the global market. This means that many people in Asia are buying and using cleaning products. Big companies that make these products are already well established there. They do a lot of advertising and marketing to make people more aware of their brands. Also, many governments in Asia have strict rules about cleanliness and hygiene, which makes people more careful about keeping things clean. All of this is helping the cleaning products market grow in Asia.
Cleaning Products Market Active Players:
- Amway Corporation (USA)
- BASF SE (Cleaning segment) (Germany)
- Blue Moon Group Holdings Limited (China)
- Church & Dwight Co., Inc. (USA)
- Colgate-Palmolive Company (USA)
- Dabur India Ltd. (India)
- Dr. Bronner's Magic Soaps (USA)
- Ecolab Inc. (USA)
- Faber-Castell Cosmetics GmbH (Germany)
- Godrej Consumer Products Ltd. (India)
- Henkel AG & Co. KGaA (Germany)
- Jyothy Labs Ltd. (India)
- Kao Corporation (Japan)
- LG Household & Health Care Ltd. (South Korea)
- Lion Corporation (Japan)
- Marico Limited (India)
- McBride plc (UK)
- Method Products, PBC (USA)
- Nice Group Co., Ltd. (China)
- PZ Cussons plc (UK)
- Reckitt Benckiser Group plc (UK)
- S.C. Johnson & Son Inc. (USA)
- SC Johnson Professional (USA)
- Seventh Generation, Inc. (USA)
- The Clorox Company (USA)
- The Procter & Gamble Company (USA)
- Unilever plc (UK/Netherlands)
- Vikara Services Pvt. Ltd. (India)
- Werner & Mertz GmbH (Frosch) (Germany)
- Zep Inc. (USA)
- Other active players
|
Cleaning Products Market |
|||
|
Base Year: |
2024 |
Forecast Period: |
2025-2032 |
|
Historical Data: |
2018 to 2024 |
Market Size in 2024: |
USD 145.20 Billion.
|
|
Forecast Period 2025-35 CAGR: |
6.1% |
Market Size in 2035: |
USD 278.51 Billion |
|
Segments Covered: |
By Type |
|
|
|
By Application |
|
||
|
By End User |
|
||
|
By Distribution Channel |
|
||
|
By Region |
|
||
|
Growth Driver: |
|
||
|
Limiting Factor |
|
||
|
Expansion Opportunity |
|
||
|
Challenge and Risk |
|
||
|
Companies Covered in the Report: |
|
||
Chapter 1: Introduction
1.1 Scope and Coverage
Chapter 2:Executive Summary
Chapter 3: Market Landscape
3.1 Market Dynamics and Opportunity Analysis
3.1.1 Growth Drivers
3.1.2 Limiting Factors
3.1.3 Growth Opportunities
3.1.4 Challenges and Risks
3.2 Market Trend Analysis
3.3 Industry Ecosystem
3.4 Industry Value Chain Mapping
3.5 Strategic PESTLE Overview
3.6 Porter's Five Forces Framework
3.7 Regulatory Framework
3.8 Pricing Trend Analysis
3.9 Intellectual Property Review
3.10 Technology Evolution
3.11 Import-Export Analysis
3.12 Consumer Behavior Analysis
3.13 Investment Pocket Analysis
3.14 Go-To Market Strategy
Chapter 4: Cleaning Products Market by Type (2018-2035)
4.1 Cleaning Products Market Snapshot and Growth Engine
4.2 Market Overview
4.3 Surface Cleaners
4.3.1 Introduction and Market Overview
4.3.2 Historic and Forecasted Market Size in Value USD and Volume Units
4.3.3 Key Market Trends, Growth Factors, and Opportunities
4.3.4 Geographic Segmentation Analysis
4.4 Laundry Detergents
4.5 Dishwashing Products
4.6 Toilet Cleaners
4.7 Others
Chapter 5: Cleaning Products Market by Application (2018-2035)
5.1 Cleaning Products Market Snapshot and Growth Engine
5.2 Market Overview
5.3 Toilet
5.3.1 Introduction and Market Overview
5.3.2 Historic and Forecasted Market Size in Value USD and Volume Units
5.3.3 Key Market Trends, Growth Factors, and Opportunities
5.3.4 Geographic Segmentation Analysis
5.4 Kitchen
5.5 Floor
5.6 Surface
5.7 Laundry
5.8 Hand/Personal Care
5.9 Others
Chapter 6: Cleaning Products Market by End User (2018-2035)
6.1 Cleaning Products Market Snapshot and Growth Engine
6.2 Market Overview
6.3 Household
6.3.1 Introduction and Market Overview
6.3.2 Historic and Forecasted Market Size in Value USD and Volume Units
6.3.3 Key Market Trends, Growth Factors, and Opportunities
6.3.4 Geographic Segmentation Analysis
6.4 Commercial
Chapter 7: Cleaning Products Market by Distribution Channel (2018-2032)
7.1 Cleaning Products Market Snapshot and Growth Engine
7.2 Market Overview
7.3 Supermarkets/Hypermarkets
7.3.1 Introduction and Market Overview
7.3.2 Historic and Forecasted Market Size in Value USD and Volume Units
7.3.3 Key Market Trends, Growth Factors, and Opportunities
7.3.4 Geographic Segmentation Analysis
7.4 Online Retail
7.5 Convenience Stores
7.6 Others
Chapter 8: Company Profiles and Competitive Analysis
8.1 Competitive Landscape
8.1.1 Competitive Benchmarking
8.1.2 Cleaning Products Market Share by Manufacturer/Service Provider(2024)
8.1.3 Industry BCG Matrix
8.1.4 PArtnerships, Mergers & Acquisitions
8.2 AMWAY CORPORATION (USA)
8.2.1 Company Overview
8.2.2 Key Executives
8.2.3 Company Snapshot
8.2.4 Role of the Company in the Market
8.2.5 Sustainability and Social Responsibility
8.2.6 Operating Business Segments
8.2.7 Product Portfolio
8.2.8 Business Performance
8.2.9 Recent News & Developments
8.2.10 SWOT Analysis
8.3 BASF SE (CLEANING SEGMENT) (GERMANY)
8.4 BLUE MOON GROUP HOLDINGS LIMITED (CHINA)
8.5 CHURCH & DWIGHT CO.
8.6 INC. (USA)
8.7 COLGATE-PALMOLIVE COMPANY (USA)
8.8 DABUR INDIA LTD. (INDIA)
8.9 DR. BRONNER'S MAGIC SOAPS (USA)
8.10 ECOLAB INC. (USA)
8.11 FABER-CASTELL COSMETICS GMBH (GERMANY)
8.12 GODREJ CONSUMER PRODUCTS LTD. (INDIA)
8.13 HENKEL AG & CO. KGAA (GERMANY)
8.14 JYOTHY LABS LTD. (INDIA)
8.15 KAO CORPORATION (JAPAN)
8.16 LG HOUSEHOLD & HEALTH CARE LTD. (SOUTH KOREA)
8.17 LION CORPORATION (JAPAN)
8.18 MARICO LIMITED (INDIA)
8.19 MCBRIDE PLC (UK)
8.20 METHOD PRODUCTS
8.21 PBC (USA)
8.22 NICE GROUP CO.
8.23 LTD. (CHINA)
8.24 PZ CUSSONS PLC (UK)
8.25 RECKITT BENCKISER GROUP PLC (UK)
8.26 S.C. JOHNSON & SON INC. (USA)
8.27 SC JOHNSON PROFESSIONAL (USA)
8.28 SEVENTH GENERATION
8.29 INC. (USA)
8.30 THE CLOROX COMPANY (USA)
8.31 THE PROCTER & GAMBLE COMPANY (USA)
8.32 UNILEVER PLC (UK/NETHERLANDS)
8.33 VIKARA SERVICES PVT. LTD. (INDIA)
8.34 WERNER & MERTZ GMBH (FROSCH) (GERMANY)
8.35 ZEP INC. (USA)
8.36 AND OTHER ACTIVE PLAYERS
Chapter 9: Global Cleaning Products Market By Region
9.1 Overview
9.2. North America Cleaning Products Market
9.2.1 Key Market Trends, Growth Factors and Opportunities
9.2.2 Top Key Companies
9.2.3 Historic and Forecasted Market Size by Segments
9.2.4 Historic and Forecast Market Size by Country
9.2.4.1 US
9.2.4.2 Canada
9.2.4.3 Mexico
9.3. Eastern Europe Cleaning Products Market
9.3.1 Key Market Trends, Growth Factors and Opportunities
9.3.2 Top Key Companies
9.3.3 Historic and Forecasted Market Size by Segments
9.3.4 Historic and Forecast Market Size by Country
9.3.4.1 Russia
9.3.4.2 Bulgaria
9.3.4.3 The Czech Republic
9.3.4.4 Hungary
9.3.4.5 Poland
9.3.4.6 Romania
9.3.4.7 Rest of Eastern Europe
9.4. Western Europe Cleaning Products Market
9.4.1 Key Market Trends, Growth Factors and Opportunities
9.4.2 Top Key Companies
9.4.3 Historic and Forecasted Market Size by Segments
9.4.4 Historic and Forecast Market Size by Country
9.4.4.1 Germany
9.4.4.2 UK
9.4.4.3 France
9.4.4.4 The Netherlands
9.4.4.5 Italy
9.4.4.6 Spain
9.4.4.7 Rest of Western Europe
9.5. Asia Pacific Cleaning Products Market
9.5.1 Key Market Trends, Growth Factors and Opportunities
9.5.2 Top Key Companies
9.5.3 Historic and Forecasted Market Size by Segments
9.5.4 Historic and Forecast Market Size by Country
9.5.4.1 China
9.5.4.2 India
9.5.4.3 Japan
9.5.4.4 South Korea
9.5.4.5 Malaysia
9.5.4.6 Thailand
9.5.4.7 Vietnam
9.5.4.8 The Philippines
9.5.4.9 Australia
9.5.4.10 New Zealand
9.5.4.11 Rest of APAC
9.6. Middle East & Africa Cleaning Products Market
9.6.1 Key Market Trends, Growth Factors and Opportunities
9.6.2 Top Key Companies
9.6.3 Historic and Forecasted Market Size by Segments
9.6.4 Historic and Forecast Market Size by Country
9.6.4.1 Turkiye
9.6.4.2 Bahrain
9.6.4.3 Kuwait
9.6.4.4 Saudi Arabia
9.6.4.5 Qatar
9.6.4.6 UAE
9.6.4.7 Israel
9.6.4.8 South Africa
9.7. South America Cleaning Products Market
9.7.1 Key Market Trends, Growth Factors and Opportunities
9.7.2 Top Key Companies
9.7.3 Historic and Forecasted Market Size by Segments
9.7.4 Historic and Forecast Market Size by Country
9.7.4.1 Brazil
9.7.4.2 Argentina
9.7.4.3 Rest of SA
Chapter 10 Analyst Viewpoint and Conclusion
Chapter 11 Our Thematic Research Methodology
11.1 Research Process
11.2 Primary Research
11.3 Secondary Research
Chapter 12 Case Study
Chapter 13 Appendix
13.1 Sources
13.2 List of Tables and figures
13.3 Short Forms and Citations
13.4 Assumption and Conversion
13.5 Disclaimer
|
Cleaning Products Market |
|||
|
Base Year: |
2024 |
Forecast Period: |
2025-2032 |
|
Historical Data: |
2018 to 2024 |
Market Size in 2024: |
USD 145.20 Billion.
|
|
Forecast Period 2025-35 CAGR: |
6.1% |
Market Size in 2035: |
USD 278.51 Billion |
|
Segments Covered: |
By Type |
|
|
|
By Application |
|
||
|
By End User |
|
||
|
By Distribution Channel |
|
||
|
By Region |
|
||
|
Growth Driver: |
|
||
|
Limiting Factor |
|
||
|
Expansion Opportunity |
|
||
|
Challenge and Risk |
|
||
|
Companies Covered in the Report: |
|
||


