


Climate Conscious Product Market Synopsis:
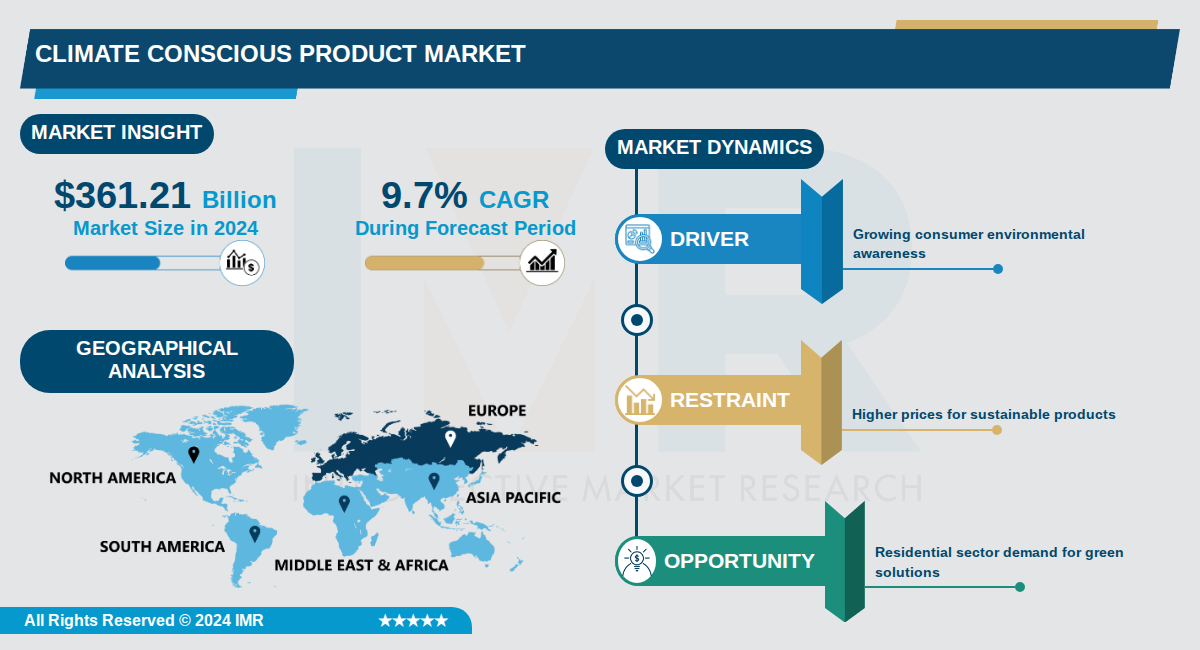
Climate Conscious Product Market Size Was Valued at USD 361.21 Billion in 2024, and is Projected to Reach USD 911.12 Billion by 2035, Growing at a CAGR of 9.7% From 2024-2035.
The Climate Conscious Product Market, encompassing sustainable consumer goods aligned with environmental values, reached $361.21 billion in 2024 and is projected to grow to $911.12 billion by 2035 at a CAGR of 9.7%. This expansion reflects surging consumer demand for products that minimize environmental impact, particularly in consumer packaged goods (CPG) where sustainable options now hold 23.8% market share, up 9.2 percentage points since 2013.
Sustainable products have driven outsized growth, accounting for 41% of CPG market expansion from 2013-2024 and achieving a 5-year CAGR of 12.4%, far surpassing the total market's 6.8% and conventional products' 5.4%. Consumers increasingly prioritize sustainability, with 80% concerned about product environmental impacts and 85% experiencing climate change effects firsthand.
This market shift is fueled by heightened awareness, as evidenced by studies showing sustainable products growing 2.7 times faster than non-sustainable ones, positioning climate-conscious offerings as key drivers of industry transformation and competitive advantage.
Climate Conscious Product Market Trend Analysis:
Expansion of Eco-Friendly Product Market Share and Consumer Spending
- The U.S. eco-friendly retail market is growing 173% faster than the conventional retail market, with sustainably marketed products accounting for $230 billion in consumer spending in 2025. Eco-friendly shopping now represents 24.8% of American retail spending, and projections indicate this will reach 34.4% by 2032 if current trends continue.
- An estimated 207 million American adults were eco-conscious shoppers in 2024, demonstrating massive consumer base adoption. Additionally, 80% of worldwide consumers are willing to pay more for eco-friendly products, with consumers paying 26.6% higher prices for eco-friendly items compared to conventional alternatives.
- The share of U.S. consumers willing to pay extra for eco-friendly products grew 7.64% in a single year, indicating accelerating momentum. An estimated 70% of new products launched in 2024 were eco-friendly, up from 14.4% compound annual growth rate between 2017-2021.
Generation Z and Millennial Leadership in Sustainable Purchasing Behavior
- Gen Z consumers are significantly outpacing other demographics in sustainability prioritization, with 79% considering sustainability when choosing brands and being 53.1% more likely to purchase based on sustainability rather than brand name. By 2027, Gen Z is projected to support 35% of the eco-friendly fashion industry, fundamentally reshaping the market.
- Millennials represent the second dominant force, with 73% considering sustainability in brand selection and 67% preferring sustainable brands. This demographic is expected to comprise 41% of the sustainable apparel market by 2027, indicating a generational shift toward eco-conscious consumption.
- Both younger cohorts show stronger preference for specific sustainability attributes: 64% of Gen Z shoppers prefer eco-friendly packaging versus 54% of Millennials, and 63% of Gen Z prioritize products with carbon footprint information compared to 59% of Millennials.
Digital Transparency and Supply Chain Traceability as Market Requirement
- Digital Product Passports are rolling out in 2026 for priority product groups, requiring every product to carry a digital record containing materials, origin, carbon footprint, repair instructions, and end-of-life options. This infrastructure shift demands that product design teams implement data systems for complete material composition tracking and supply chain traceability.
- The EU Carbon Border Adjustment Mechanism enters its definitive phase in 2026 with payments beginning in 2027, forcing carbon-intensive exporters to adapt or lose market access. This regulatory pressure is driving global harmonization of emissions reporting and GHG Protocol Scope 2 standards, significantly impacting corporate clean power strategies and product sourcing decisions.
Climate Conscious Product Market Segment Analysis:
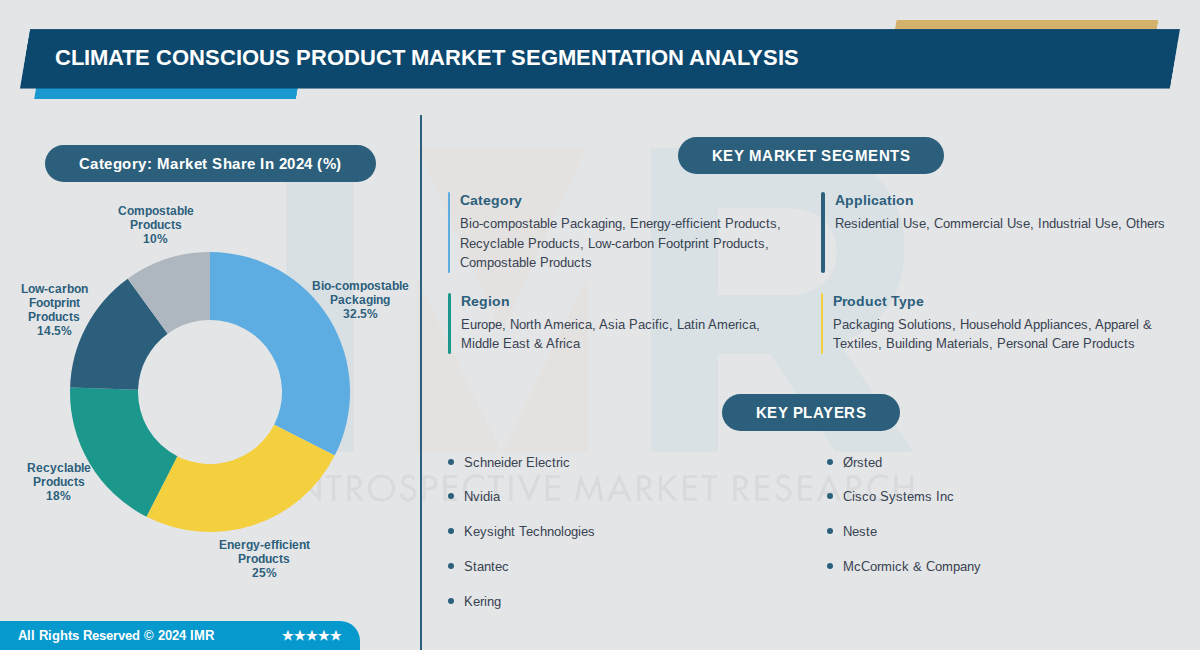
Climate Conscious Product Market is Segmented on the basis of By Category, By Application, By Region
By Category, Bio-compostable Packaging segment is expected to dominate the market during the forecast period
- Bio-compostable packaging dominates due to surging demand from consumers and businesses seeking alternatives to single-use plastics to curb waste pollution.
- Regulatory mandates in Europe and North America for biodegradable solutions have accelerated adoption, capturing the largest market share in 2024.
By Application, Residential Use segment is expected to dominate the market during the forecast period
- Residential use leads as heightened homeowner awareness of carbon footprints drives purchases of eco-friendly appliances, materials, and furniture.
- Growing preference for green home solutions amid rising energy costs and sustainability trends fuels the fastest segment expansion.
By Region, Europe segment is expected to dominate the market during the forecast period
- Europe commands the top share owing to rigorous EU regulations on emissions, waste, and sustainable production practices.
- Strong governmental policies and cultural emphasis on environmental responsibility have solidified Europe's market leadership in 2024.
By Product Type, Packaging Solutions segment is expected to dominate the market during the forecast period
- Packaging solutions dominate propelled by the shift to bio-compostable options amid global plastic bans and waste reduction initiatives.
- Businesses across retail and e-commerce prioritize sustainable packaging, amplifying its revenue contribution.
Climate Conscious Product Market Regional Insights:
Europe is Expected to Dominate the Market Over the Forecast Period
- Europe dominated the climate-conscious product market revenue share in 2024, making it the largest regional market globally. This leadership stems from high consumer awareness of environmental issues and a strong push for sustainable options across countries like Germany, France, and the UK. The region's mature market for eco-friendly products positions it ahead of others in current revenue terms.
- Stringent EU regulations, such as the Carbon Border Adjustment Mechanism (CBAM) introduced in 2023, enforce carbon emission reductions, waste management, and sustainable production practices. These policies compel businesses to adopt eco-friendly methods to comply and meet rising consumer demand for green products. Europe's emphasis on renewable energy, digital circular economies, and sustainable manufacturing further solidifies its infrastructure for market growth.
- Major players like IKEA, Patagonia, Nudie Jeans Co., and Schneider Electric have significant operations in Europe, driving innovation in climate-conscious products. Recent developments include expanded sustainable supply chains and product lines tailored to residential and commercial applications. Companies are responding to both regulatory pressures and consumer preferences, fostering ongoing market expansion in the region.
Active Key Players in the Climate Conscious Product Market:
- Schneider Electric (France)
- Ørsted (Denmark)
- Nvidia (USA)
- Cisco Systems Inc (USA)
- Keysight Technologies (USA)
- Neste (Finland)
- Stantec (Canada)
- McCormick & Company (USA)
- Kering (France)
- Metso Outotec (Finland)
- American Water Works Company (USA)
- ERG SpA (Italy)
- Pandora A/S (Denmark)
- EDP Renováveis SA (Portugal)
- Fluence Energy, Inc (USA)
- Patagonia (USA)
- Allbirds (USA)
- Climeworks (Switzerland)
- Form Energy (USA)
- Other Active Players
|
Climate Conscious Product Market |
|||
|
Base Year: |
2024 |
Forecast Period: |
2024-2035 |
|
Historical Data: |
2017 to 2024 |
Market Size in 2024: |
USD 361.21 Billion |
|
Forecast Period 2024-2035 CAGR: |
9.7 % |
Market Size in 2035: |
USD 911.12 Billion |
|
Segments Covered: |
By Category |
|
|
|
By Application |
|
||
|
By Region |
|
||
|
By Product Type |
|
||
|
By Region |
|
||
|
Key Market Drivers: |
|
||
|
Key Market Restraints: |
|
||
|
Key Opportunities: |
|
||
|
Companies Covered in the report: |
|
||
Chapter 1: Introduction
1.1 Scope and Coverage
Chapter 2: Executive Summary
Chapter 3: Market Landscape
3.1 Market Dynamics and Opportunity Analysis
3.1.1 Growth Drivers
3.1.2 Limiting Factors
3.1.3 Growth Opportunities
3.1.4 Challenges and Risks
3.2 Market Trend Analysis
3.3 Industry Ecosystem
3.4 Industry Value Chain Mapping
3.5 Strategic PESTLE Overview
3.6 Porter's Five Forces Framework
3.7 Regulatory Framework
3.8 Pricing Trend Analysis
3.9 Intellectual Property Review
3.10 Technology Evolution
3.11 Import-Export Analysis
3.12 Consumer Behavior Analysis
3.13 Investment Pocket Analysis
3.14 Go-To Market Strategy
Chapter 4: Climate Conscious Product Market by Category (2017-2035)
4.1 Climate Conscious Product Market Snapshot and Growth Engine
4.2 Market Overview
4.3 Bio-compostable Packaging
4.3.1 Introduction and Market Overview
4.3.2 Historic and Forecasted Market Size in Value USD and Volume Units
4.3.3 Key Market Trends, Growth Factors, and Opportunities
4.3.4 Geographic Segmentation Analysis
4.4 Energy-efficient Products
4.5 Recyclable Products
4.6 Low-carbon Footprint Products
4.7 Compostable Products
Chapter 5: Climate Conscious Product Market by Application (2017-2035)
5.1 Climate Conscious Product Market Snapshot and Growth Engine
5.2 Market Overview
5.3 Residential Use
5.3.1 Introduction and Market Overview
5.3.2 Historic and Forecasted Market Size in Value USD and Volume Units
5.3.3 Key Market Trends, Growth Factors, and Opportunities
5.3.4 Geographic Segmentation Analysis
5.4 Commercial Use
5.5 Industrial Use
5.6 Others
Chapter 6: Climate Conscious Product Market by Region (2017-2035)
6.1 Climate Conscious Product Market Snapshot and Growth Engine
6.2 Market Overview
6.3 Europe
6.3.1 Introduction and Market Overview
6.3.2 Historic and Forecasted Market Size in Value USD and Volume Units
6.3.3 Key Market Trends, Growth Factors, and Opportunities
6.3.4 Geographic Segmentation Analysis
6.4 North America
6.5 Asia Pacific
6.6 Latin America
6.7 Middle East & Africa
Chapter 7: Climate Conscious Product Market by Product Type (2017-2035)
7.1 Climate Conscious Product Market Snapshot and Growth Engine
7.2 Market Overview
7.3 Packaging Solutions
7.3.1 Introduction and Market Overview
7.3.2 Historic and Forecasted Market Size in Value USD and Volume Units
7.3.3 Key Market Trends, Growth Factors, and Opportunities
7.3.4 Geographic Segmentation Analysis
7.4 Household Appliances
7.5 Apparel & Textiles
7.6 Building Materials
7.7 Personal Care Products
Chapter 8: Company Profiles and Competitive Analysis
8.1 Competitive Landscape
8.1.1 Competitive Benchmarking
8.1.2 Climate Conscious Product Market Share by Manufacturer/Service Provider (2024)
8.1.3 Industry BCG Matrix
8.1.4 Partnerships, Mergers & Acquisitions
8.2 SCHNEIDER ELECTRIC
8.2.1 Company Overview
8.2.2 Key Executives
8.2.3 Company Snapshot
8.2.4 Role of the Company in the Market
8.2.5 Sustainability and Social Responsibility
8.2.6 Operating Business Segments
8.2.7 Product Portfolio
8.2.8 Business Performance
8.2.9 Recent News & Developments
8.2.10 SWOT Analysis
8.3 ØRSTED
8.4 NVIDIA
8.5 CISCO SYSTEMS INC
8.6 KEYSIGHT TECHNOLOGIES
8.7 NESTE
8.8 STANTEC
8.9 MCCORMICK & COMPANY
8.10 KERING
8.11 METSO OUTOTEC
8.12 AMERICAN WATER WORKS COMPANY
8.13 ERG SPA
8.14 PANDORA A/S
8.15 EDP RENOVÁVEIS SA
8.16 FLUENCE ENERGY
8.17 INC
8.18 PATAGONIA
8.19 ALLBIRDS
8.20 CLIMEWORKS
8.21 FORM ENERGY
Chapter 9: Global Climate Conscious Product Market By Region
9.1 Overview
9.2. North America Climate Conscious Product Market
9.2.1 Key Market Trends, Growth Factors and Opportunities
9.2.2 Top Key Companies
9.2.3 Historic and Forecasted Market Size by Segments
9.2.4 Historic and Forecast Market Size by Country
9.3. Eastern Europe Climate Conscious Product Market
9.3.1 Key Market Trends, Growth Factors and Opportunities
9.3.2 Top Key Companies
9.3.3 Historic and Forecasted Market Size by Segments
9.3.4 Historic and Forecast Market Size by Country
9.4. Western Europe Climate Conscious Product Market
9.4.1 Key Market Trends, Growth Factors and Opportunities
9.4.2 Top Key Companies
9.4.3 Historic and Forecasted Market Size by Segments
9.4.4 Historic and Forecast Market Size by Country
9.5. Asia Pacific Climate Conscious Product Market
9.5.1 Key Market Trends, Growth Factors and Opportunities
9.5.2 Top Key Companies
9.5.3 Historic and Forecasted Market Size by Segments
9.5.4 Historic and Forecast Market Size by Country
9.6. Middle East & Africa Climate Conscious Product Market
9.6.1 Key Market Trends, Growth Factors and Opportunities
9.6.2 Top Key Companies
9.6.3 Historic and Forecasted Market Size by Segments
9.6.4 Historic and Forecast Market Size by Country
9.7. South America Climate Conscious Product Market
9.7.1 Key Market Trends, Growth Factors and Opportunities
9.7.2 Top Key Companies
9.7.3 Historic and Forecasted Market Size by Segments
9.7.4 Historic and Forecast Market Size by Country
Chapter 10: Analyst Viewpoint and Conclusion
Chapter 11: Research Methodology
11.1 Research Process
11.2 Primary Research
11.3 Secondary Research
Chapter 12: Case Study
Chapter 13: Appendix
13.1 Sources
13.2 List of Tables and Figures
13.3 Short Forms and Citations
13.4 Assumption and Conversion
13.5 Disclaimer
|
Climate Conscious Product Market |
|||
|
Base Year: |
2024 |
Forecast Period: |
2024-2035 |
|
Historical Data: |
2017 to 2024 |
Market Size in 2024: |
USD 361.21 Billion |
|
Forecast Period 2024-2035 CAGR: |
9.7 % |
Market Size in 2035: |
USD 911.12 Billion |
|
Segments Covered: |
By Category |
|
|
|
By Application |
|
||
|
By Region |
|
||
|
By Product Type |
|
||
|
By Region |
|
||
|
Key Market Drivers: |
|
||
|
Key Market Restraints: |
|
||
|
Key Opportunities: |
|
||
|
Companies Covered in the report: |
|
||


