 Supply-Chain and Value-Chain Mapping
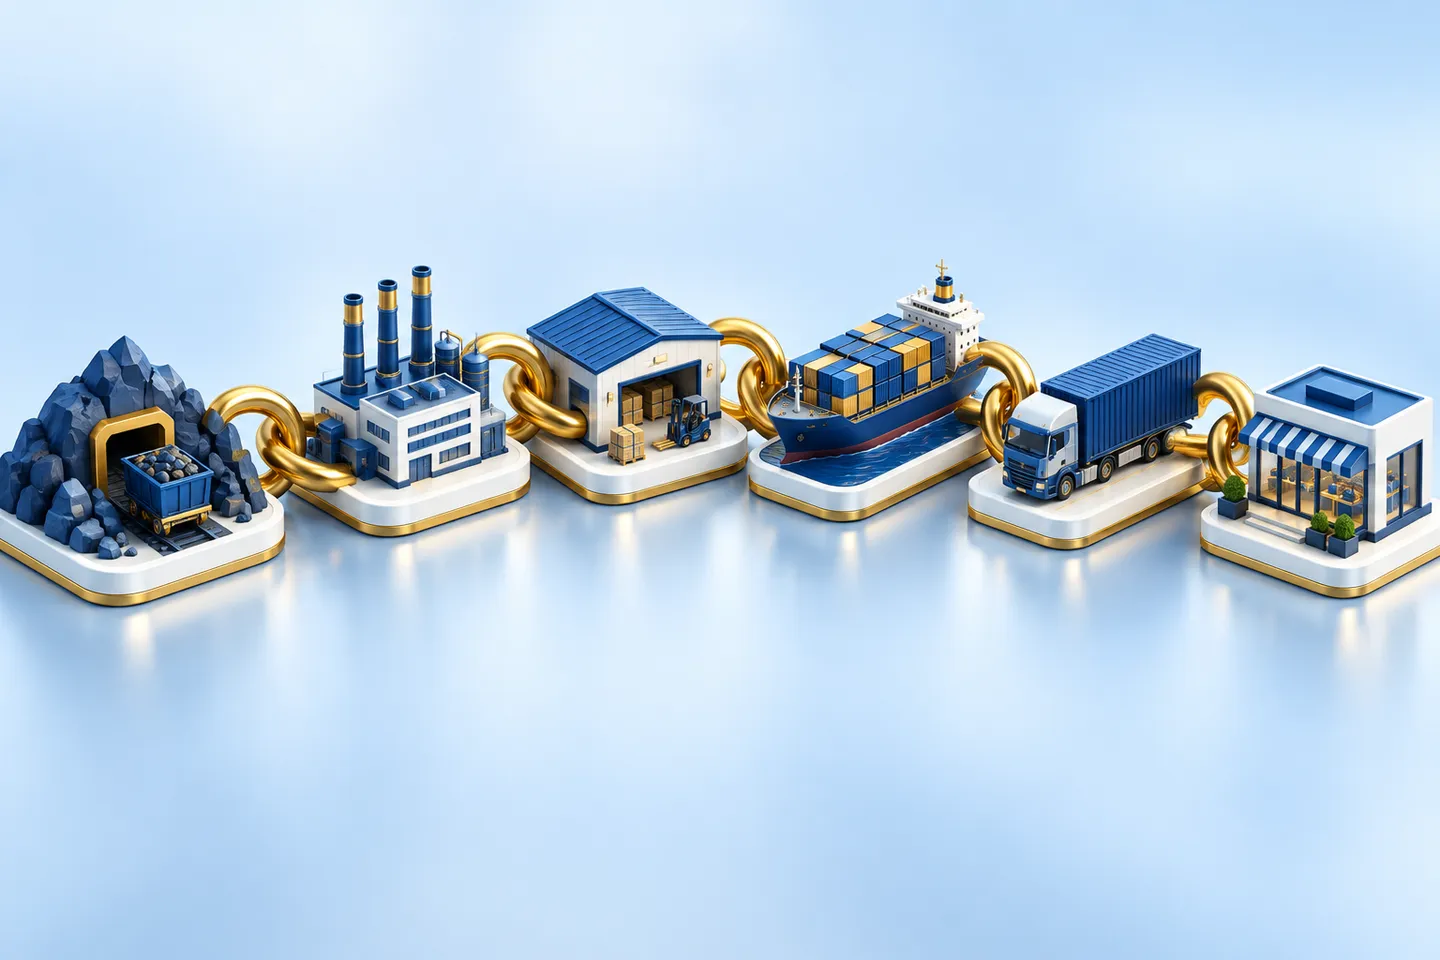
Map the chain from raw material to end use, and find where the margin sits
A value-chain map with margins at every stage, analysis of bottlenecks and dependencies, and an evaluation of integration and sourcing options.
Is this for you?
- You want to know where value is captured in your chain and whether you should integrate up or down.
- Supply disruptions keep recurring and the dependencies are not understood.
- You are evaluating backward integration, a new sourcing geography or a different supply model.
- Strategy and procurement need a shared, evidence-based picture of the chain.
What you get
- 01
Value-chain map with margins by stage
Every step from raw material to end use, with volumes, players and margins.
- 02
Bottleneck and dependency analysis
Where capacity, logistics or single sources constrain the chain.
- 03
Integration and sourcing options
Alternatives evaluated on cost, risk and capability.
Deliverables
- Value-chain map (PDF)
- Margin and flow model (Excel)
- Options report with recommendation
How we work
- Step 01
Define the chain, products and geographies.
- Step 02
Research flows, players and margins through trade data and interviews along the chain.
- Step 03
Identify bottlenecks and dependencies; model options.
- Step 04
Recommend and present.
Why IMR for this
Engineers map process chains accurately, including by-products and conversion economics.
Interviews along the chain, from producers to end users, provide the margin data that is not published.
Follows naturally into a TEV study if integration is the chosen option.
Frequently asked questions
Which chains do you cover?
Chemicals, materials, agri and food processing, energy and industrial manufacturing.
Can you include international stages?
Yes; chains are mapped across borders.
Is this a one-off?
Usually; ongoing monitoring is available through a retainer.