


Virtual Sensors Market Synopsis
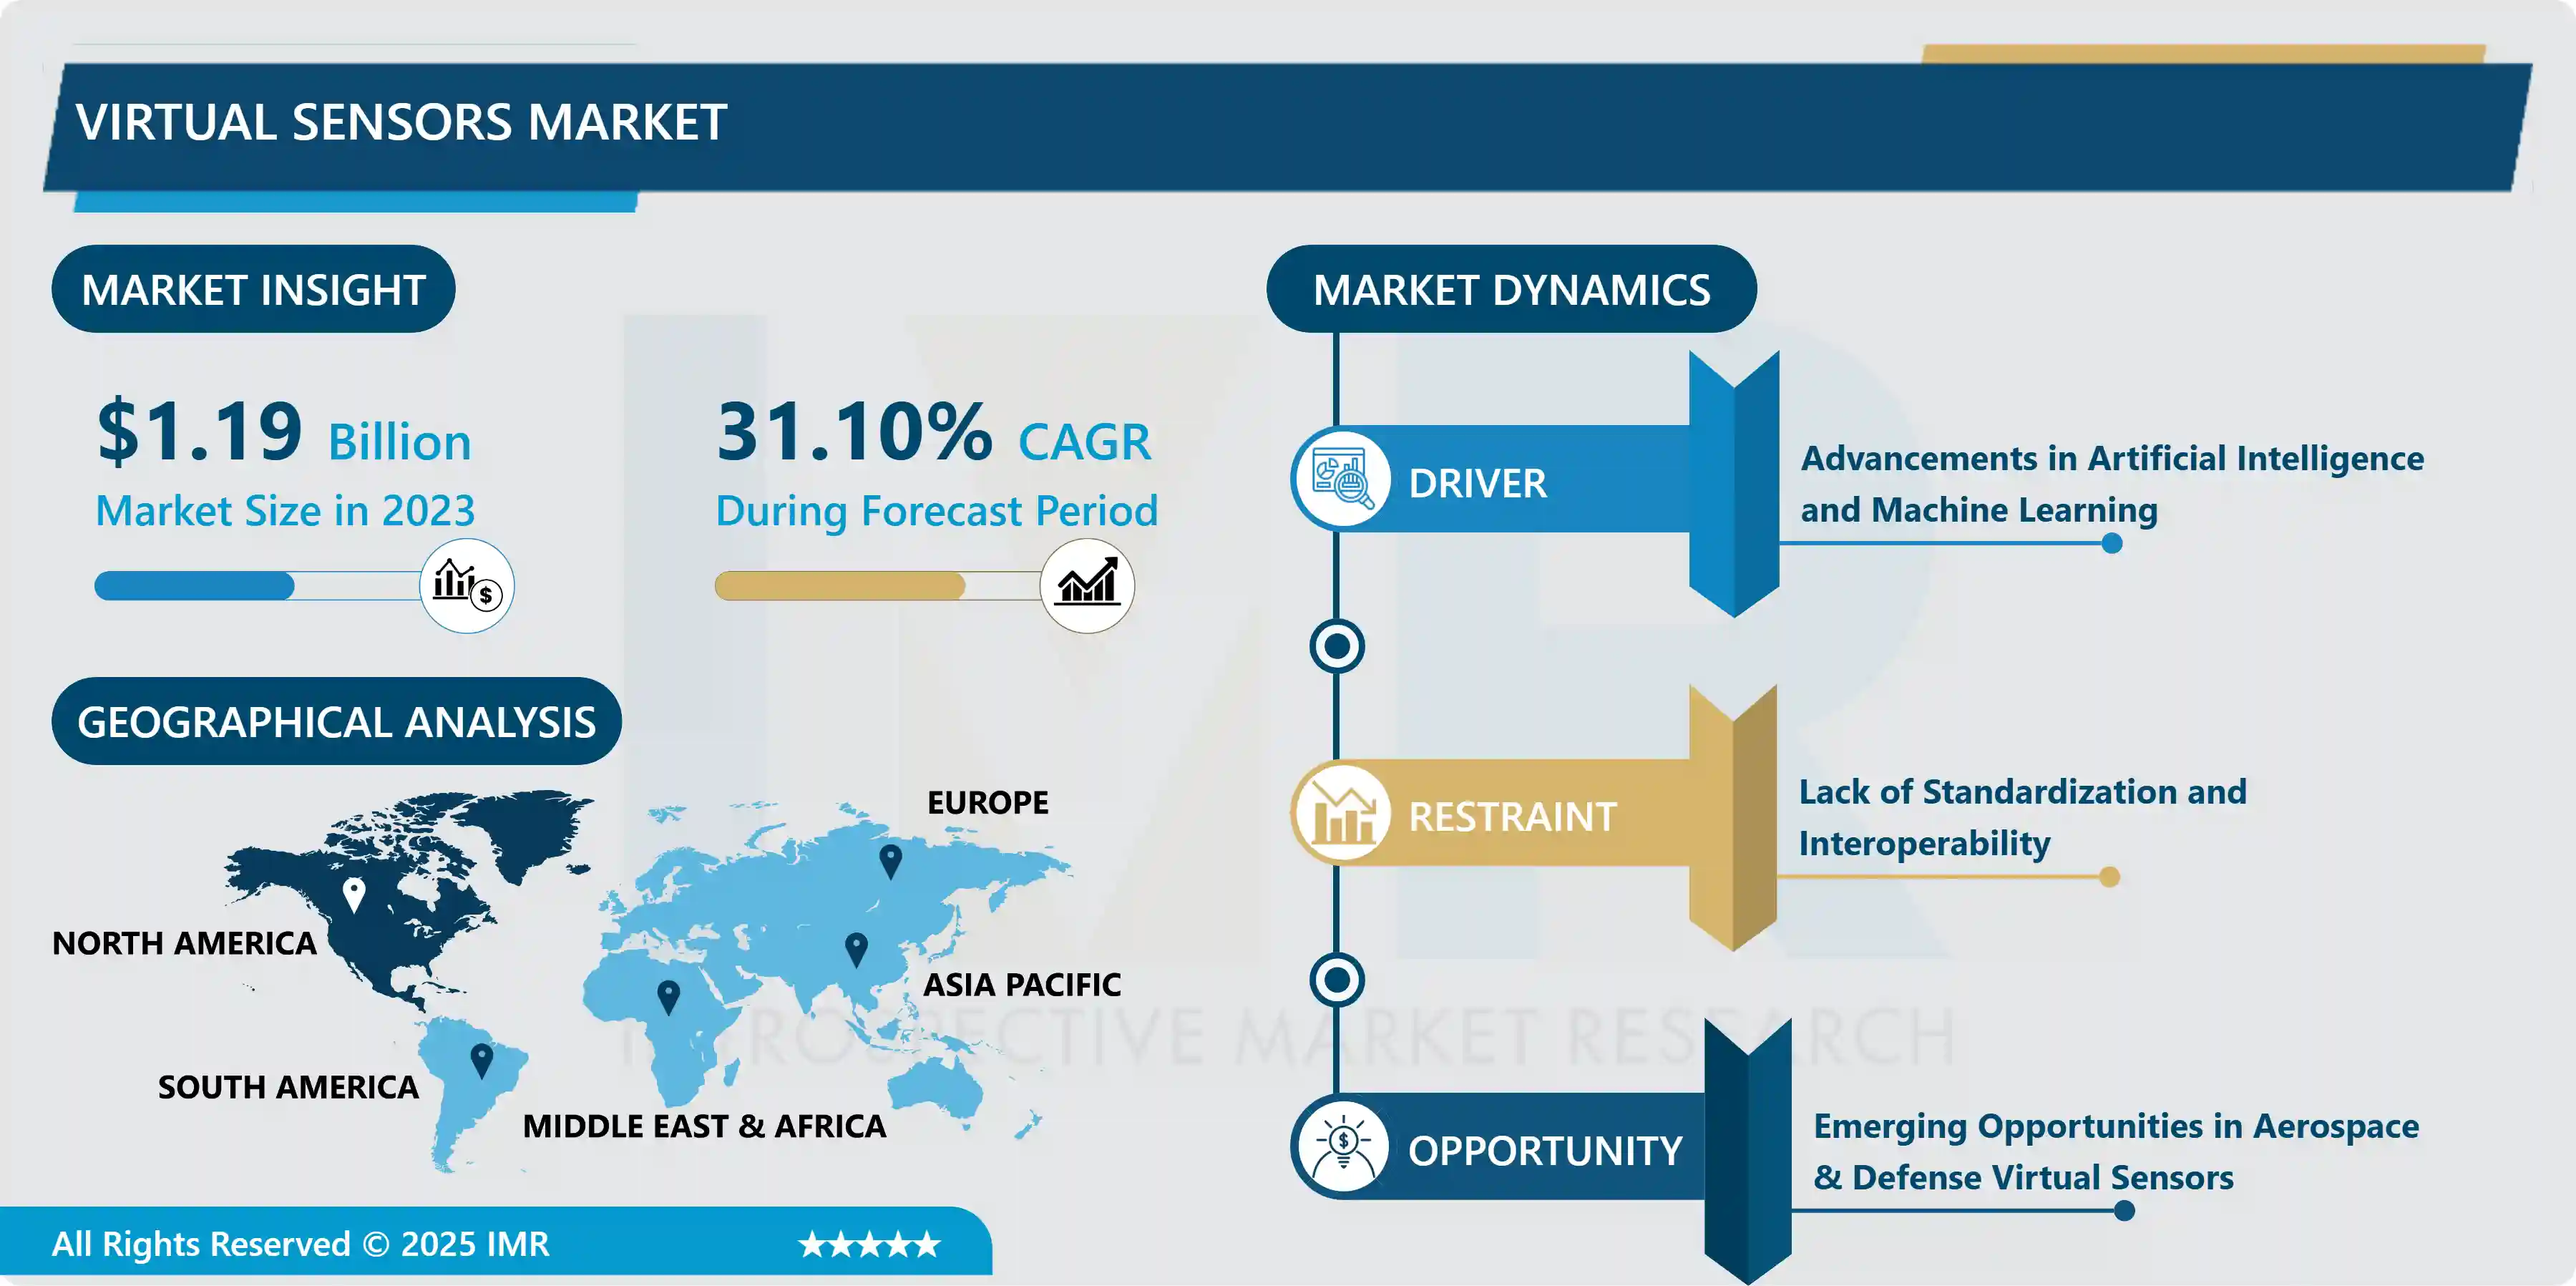
Virtual Sensors Market Size is Valued at USD 1.19 Billion in 2023, and is Projected to Reach USD 10.41 Billion by 2032, Growing at a CAGR of 31.10% From 2024-2032.
Software and algorithms that offer alternative data to that of actual sensors without the existence of the physical sensor make up the Virtual Sensors Market. These virtual sensors use AI, ML, and big data techniques to gain measurements, monitoring, and predictive features in various applications and industries. Some of the categories include technology, application, end-users, and deployment types providing service to sectors such as automotive, healthcare, industrial automation, smart cities, etc. It provides a cheaper and more versatile data acquisition and analysis tool that improves working effectiveness and decision-making.
The Virtual Sensors Market has got a boost in recent years because of the use and implementation of modern technologies in every segment. Software-based sensors or virtual sensors which are digital replicas of the physical sensors with the ability to measure signals in real-time and analyze them can be used for real-time control instead of the real sensors. In terms of type, this market is divided into software-based virtual sensors and hardware-based virtual sensors depending on requirements of the application and technology. The major sectors that apply the products include automobile, aerospace and defense, industrial control, healthcare, power and light, and construction and facilities management among others. Integration of artificial intelligence (AI), machine learning (ML), and Internet of Things (IoT) has made virtual sensors a component of operational and decision-making elastic structure.
It is also divided on the basis of geographical area as North American, European, Asia-Pacific, Latin American and Middle Eastern & African market which have different rates of adoption and growth. Organization can enhance the deployment modes that include cloud-based and On-Premises, and thus the integration modes can be liked according to the flexibility required. It is also noteworthy that the scope of the virtual sensors market involves a great variety of components, such as software, professional, and managed services. This segmentation sheds light on the fact that market is very evolving in nature due to technological changes and increase demand of IT solution across the growing industries and sectors.

Virtual Sensors Market Trend Analysis
The Future of Smart Infrastructure, Growth and Opportunities in the Virtual Sensors Market
- The prominence of Virtual Sensors Market is due to AI capabilities, Machine Learning and IoT based progressions. With the advancement of industries like automotive, aerospace, healthcare and others which are all implemented Ing smart systems and adapting to the use of digital technologies has boosted the demand of virtual sensors. Implicit in the control of operations, hence efficiency, are real-time monitoring, health-check surveillance, and decision-making, which are all attainable through integrating these technologies. The coupling of AI and big data analytics with virtual sensors is the reason for the further growth of the market due to better information that is provided.
- Besides, the measure of Industry 4. 0, and such smart infrastructures are helping the market to grow. They find applications in smart cities and automated systems where the applications help in managing the resources effectively along with energy consumption and even in safety. Digitalization, growth in the number of interconnected devices, and changes in solutions toward cloud-based architectures are also driving the market for virtual sensors because it provides more opportunities to gather and analyze data at lower costs. It is with this belief that industries are likely to continue going for solutions that offer unique ways of leveraging data.
Harnessing Innovation, Growth Potential in the Virtual Sensors Industry
- The Virtual Sensors Market has growth prospects as a result of the novel use of AI, ML, and IoT. The amalgamation of these aspects of technology preferably results to proper data collection and analysis together with forecast or prediction systems. Automotive, aerospace, and healthcare are some of the sectors that are using the virtual sensors in operations to improve performance, cut down on maintenance expenses, and guarantee safety. For instance, in the automotive industry, virtual sensors are applied to oversee vehicle behaviour and prognosis of various elements, which in turn, helps in the right scheduling of the maintenance and contributes to driver safety considerably.
- Further, smart cities and the industrial revolution drive the growth of virtual sensors market. In smart and intelligent infrastructure and industrial systems, there are virtual sensors which are very useful for monitoring and controlling the use of resources and performance of the systems. This increase of these applications in different industries accompanied by a rising technological and infrastructural investment shows the huge potential for virtual sensors. Those firms, which manage to exploit such opportunities, are in a position to realize enhanced competitive advantage and bring solutions to tide the requirements of a rapidly expanding range of industries.
Virtual Sensors Market Segment Analysis:
Virtual Sensors Market Segmented on the basis of type, Technology, and end-users.
By Type, Software-based Virtual Sensors segment is expected to dominate the market during the forecast period
- The Virtual Sensors Market is classified into Software Virtual Sensors and Hardware Virtual Sensors. Software type of virtual sensors relies on algorithms data processing functionality to deliver tools for virtual sensing through the use of application software which increases structural flexibility and expansiveness. On the other hand, there are virtual sensors that are built on the top of actual physical hardware, where physical and sensing devices are used to emulate the conventional sensors’ roles, and provide reliable and stable measurements. Both of them are widely used in different applications; the software based sensors concentrate on real-time adaptability and easy installation; however, the hardware based sensors emphasize exactness and sturdiness.
By Technology, Artificial Intelligence (AI) segment held the largest share in 2024
- The different technologies driving the Virtual Sensors Market include Artificial Intelligence (AI) & Machine Learning (ML), these technologies aid in data analysis. Internet of Things relates virtual sensing to actual devices, making it possible to monitor and possibly act on them in real-time. Big Data Analytics involves the use of large amount of data for enhancing the sensor data and getting more precise results. Also, Cloud Computing supports the dynamic provisioning and monitoring of the virtual sensors, providing flexibility and decreasing the expenses of the infrastructure. Combined, these technologies enhance broadband sensing in multitude of fields.
Virtual Sensors Market Regional Insights:
North America is Expected to Dominate the Market Over the Forecast period
- The market for Virtual Sensors in North America is well-developed based on the region’s advanced technological system and high utilization of Virtual Sensors across multiple industries. Audi, Airbus, and BMW are some of the biggest companies in this region, which demand virtual sensors, particularly in the automotive and aerospace industries, as they offer improvements to system and components managing and predictive maintenance. Existence of some of the key technology players such as major virtual sensors companies along with research and development activities holds America’s position strong in the market. Business entities in the region utilize advanced technologies like artificial intelligence and machine learning and come up with highly advanced virtual sensors for the industrial and consumer market.
- Apart from industrial uses, the North American market avails itself of expanding investment in such matters as smart city and healthcare sectors. Virtual sensors are increasingly being incorporated into building automation and energy management systems mainly due to the focus that is being placed in the region on sustainability and reductions of energy consumption. Furthermore, the CN America region is also advancing its cloud computing and big data analysis, thus enhancing the concept of virtual sensors and providing more precise data and real-time monitoring services. Therefore, the North American Virtual Sensors Market should be expected to continue growing due to these factors; technological enhancement, and increasing industries’ needs.
Active Key Players in the Virtual Sensors Market
- Honeywell International Inc. (United States)
- Siemens AG (Germany)
- Schneider Electric SE (France)
- General Electric Company (United States)
- IBM Corporation (United States)
- Rockwell Automation, Inc. (United States)
- Emerson Electric Co. (United States)
- Microsoft Corporation (United States)
- SAP SE (Germany)
- PTC Inc. (United States)
- Intel Corporation (United States)
- Oracle Corporation (United States)
- Cisco Systems, Inc. (United States)
- Dassault Systèmes SE (France)
- ANSYS, Inc. (United States)
- others
|
Virtual Sensors Market |
|||
|
Base Year: |
2023 |
Forecast Period: |
2024-2032 |
|
Historical Data: |
2017 to 2023 |
Market Size in 2023: |
USD 1.19 Bn. |
|
Forecast Period 2024-32 CAGR: |
31.10 % |
Market Size in 2032: |
USD 10.41 Bn. |
|
Segments Covered: |
By Type |
|
|
|
By Technology |
|
||
|
By End User |
|
||
|
By Region |
|
||
|
Key Market Drivers: |
|
||
|
Key Market Restraints: |
|
||
|
Key Opportunities: |
|
||
|
Companies Covered in the report: |
|
||
Chapter 1: Introduction
1.1 Scope and Coverage
Chapter 2:Executive Summary
Chapter 3: Market Landscape
3.1 Market Dynamics
3.1.1 Drivers
3.1.2 Restraints
3.1.3 Opportunities
3.1.4 Challenges
3.2 Market Trend Analysis
3.3 PESTLE Analysis
3.4 Porter's Five Forces Analysis
3.5 Industry Value Chain Analysis
3.6 Ecosystem
3.7 Regulatory Landscape
3.8 Price Trend Analysis
3.9 Patent Analysis
3.10 Technology Evolution
3.11 Investment Pockets
3.12 Import-Export Analysis
Chapter 4: Virtual Sensors Market by Type (2018-2032)
4.1 Virtual Sensors Market Snapshot and Growth Engine
4.2 Market Overview
4.3 Software-based Virtual Sensors
4.3.1 Introduction and Market Overview
4.3.2 Historic and Forecasted Market Size in Value USD and Volume Units
4.3.3 Key Market Trends, Growth Factors, and Opportunities
4.3.4 Geographic Segmentation Analysis
4.4 Hardware-based Virtual Sensors
Chapter 5: Virtual Sensors Market by Technology (2018-2032)
5.1 Virtual Sensors Market Snapshot and Growth Engine
5.2 Market Overview
5.3 Artificial Intelligence (AI)
5.3.1 Introduction and Market Overview
5.3.2 Historic and Forecasted Market Size in Value USD and Volume Units
5.3.3 Key Market Trends, Growth Factors, and Opportunities
5.3.4 Geographic Segmentation Analysis
5.4 Machine Learning (ML)
5.5 Internet of Things (IoT)
5.6 Big Data Analytics
5.7 Cloud Computing
Chapter 6: Virtual Sensors Market by End User (2018-2032)
6.1 Virtual Sensors Market Snapshot and Growth Engine
6.2 Market Overview
6.3 Automotive
6.3.1 Introduction and Market Overview
6.3.2 Historic and Forecasted Market Size in Value USD and Volume Units
6.3.3 Key Market Trends, Growth Factors, and Opportunities
6.3.4 Geographic Segmentation Analysis
6.4 Aerospace & Defense
6.5 Manufacturing
6.6 Oil & Gas
6.7 Healthcare
6.8 Energy & Utilities
6.9 Smart Cities
6.10 Retail
6.11 Others
Chapter 7: Company Profiles and Competitive Analysis
7.1 Competitive Landscape
7.1.1 Competitive Benchmarking
7.1.2 Virtual Sensors Market Share by Manufacturer (2024)
7.1.3 Industry BCG Matrix
7.1.4 Heat Map Analysis
7.1.5 Mergers and Acquisitions
7.2 HONEYWELL INTERNATIONAL INC. (UNITED STATES)
7.2.1 Company Overview
7.2.2 Key Executives
7.2.3 Company Snapshot
7.2.4 Role of the Company in the Market
7.2.5 Sustainability and Social Responsibility
7.2.6 Operating Business Segments
7.2.7 Product Portfolio
7.2.8 Business Performance
7.2.9 Key Strategic Moves and Recent Developments
7.2.10 SWOT Analysis
7.3 SIEMENS AG (GERMANY)
7.4 SCHNEIDER ELECTRIC SE (FRANCE)
7.5 GENERAL ELECTRIC COMPANY (UNITED STATES)
7.6 IBM CORPORATION (UNITED STATES)
7.7 ROCKWELL AUTOMATION INC. (UNITED STATES)
7.8 EMERSON ELECTRIC CO. (UNITED STATES)
7.9 MICROSOFT CORPORATION (UNITED STATES)
7.10 SAP SE (GERMANY)
7.11 PTC INC. (UNITED STATES)
7.12 INTEL CORPORATION (UNITED STATES)
7.13 ORACLE CORPORATION (UNITED STATES)
7.14 CISCO SYSTEMS INC. (UNITED STATES)
7.15 DASSAULT SYSTÈMES SE (FRANCE)
7.16 ANSYS INC. (UNITED STATES)
7.17 OTHERS
Chapter 8: Global Virtual Sensors Market By Region
8.1 Overview
8.2. North America Virtual Sensors Market
8.2.1 Key Market Trends, Growth Factors and Opportunities
8.2.2 Top Key Companies
8.2.3 Historic and Forecasted Market Size by Segments
8.2.4 Historic and Forecasted Market Size by Type
8.2.4.1 Software-based Virtual Sensors
8.2.4.2 Hardware-based Virtual Sensors
8.2.5 Historic and Forecasted Market Size by Technology
8.2.5.1 Artificial Intelligence (AI)
8.2.5.2 Machine Learning (ML)
8.2.5.3 Internet of Things (IoT)
8.2.5.4 Big Data Analytics
8.2.5.5 Cloud Computing
8.2.6 Historic and Forecasted Market Size by End User
8.2.6.1 Automotive
8.2.6.2 Aerospace & Defense
8.2.6.3 Manufacturing
8.2.6.4 Oil & Gas
8.2.6.5 Healthcare
8.2.6.6 Energy & Utilities
8.2.6.7 Smart Cities
8.2.6.8 Retail
8.2.6.9 Others
8.2.7 Historic and Forecast Market Size by Country
8.2.7.1 US
8.2.7.2 Canada
8.2.7.3 Mexico
8.3. Eastern Europe Virtual Sensors Market
8.3.1 Key Market Trends, Growth Factors and Opportunities
8.3.2 Top Key Companies
8.3.3 Historic and Forecasted Market Size by Segments
8.3.4 Historic and Forecasted Market Size by Type
8.3.4.1 Software-based Virtual Sensors
8.3.4.2 Hardware-based Virtual Sensors
8.3.5 Historic and Forecasted Market Size by Technology
8.3.5.1 Artificial Intelligence (AI)
8.3.5.2 Machine Learning (ML)
8.3.5.3 Internet of Things (IoT)
8.3.5.4 Big Data Analytics
8.3.5.5 Cloud Computing
8.3.6 Historic and Forecasted Market Size by End User
8.3.6.1 Automotive
8.3.6.2 Aerospace & Defense
8.3.6.3 Manufacturing
8.3.6.4 Oil & Gas
8.3.6.5 Healthcare
8.3.6.6 Energy & Utilities
8.3.6.7 Smart Cities
8.3.6.8 Retail
8.3.6.9 Others
8.3.7 Historic and Forecast Market Size by Country
8.3.7.1 Russia
8.3.7.2 Bulgaria
8.3.7.3 The Czech Republic
8.3.7.4 Hungary
8.3.7.5 Poland
8.3.7.6 Romania
8.3.7.7 Rest of Eastern Europe
8.4. Western Europe Virtual Sensors Market
8.4.1 Key Market Trends, Growth Factors and Opportunities
8.4.2 Top Key Companies
8.4.3 Historic and Forecasted Market Size by Segments
8.4.4 Historic and Forecasted Market Size by Type
8.4.4.1 Software-based Virtual Sensors
8.4.4.2 Hardware-based Virtual Sensors
8.4.5 Historic and Forecasted Market Size by Technology
8.4.5.1 Artificial Intelligence (AI)
8.4.5.2 Machine Learning (ML)
8.4.5.3 Internet of Things (IoT)
8.4.5.4 Big Data Analytics
8.4.5.5 Cloud Computing
8.4.6 Historic and Forecasted Market Size by End User
8.4.6.1 Automotive
8.4.6.2 Aerospace & Defense
8.4.6.3 Manufacturing
8.4.6.4 Oil & Gas
8.4.6.5 Healthcare
8.4.6.6 Energy & Utilities
8.4.6.7 Smart Cities
8.4.6.8 Retail
8.4.6.9 Others
8.4.7 Historic and Forecast Market Size by Country
8.4.7.1 Germany
8.4.7.2 UK
8.4.7.3 France
8.4.7.4 The Netherlands
8.4.7.5 Italy
8.4.7.6 Spain
8.4.7.7 Rest of Western Europe
8.5. Asia Pacific Virtual Sensors Market
8.5.1 Key Market Trends, Growth Factors and Opportunities
8.5.2 Top Key Companies
8.5.3 Historic and Forecasted Market Size by Segments
8.5.4 Historic and Forecasted Market Size by Type
8.5.4.1 Software-based Virtual Sensors
8.5.4.2 Hardware-based Virtual Sensors
8.5.5 Historic and Forecasted Market Size by Technology
8.5.5.1 Artificial Intelligence (AI)
8.5.5.2 Machine Learning (ML)
8.5.5.3 Internet of Things (IoT)
8.5.5.4 Big Data Analytics
8.5.5.5 Cloud Computing
8.5.6 Historic and Forecasted Market Size by End User
8.5.6.1 Automotive
8.5.6.2 Aerospace & Defense
8.5.6.3 Manufacturing
8.5.6.4 Oil & Gas
8.5.6.5 Healthcare
8.5.6.6 Energy & Utilities
8.5.6.7 Smart Cities
8.5.6.8 Retail
8.5.6.9 Others
8.5.7 Historic and Forecast Market Size by Country
8.5.7.1 China
8.5.7.2 India
8.5.7.3 Japan
8.5.7.4 South Korea
8.5.7.5 Malaysia
8.5.7.6 Thailand
8.5.7.7 Vietnam
8.5.7.8 The Philippines
8.5.7.9 Australia
8.5.7.10 New Zealand
8.5.7.11 Rest of APAC
8.6. Middle East & Africa Virtual Sensors Market
8.6.1 Key Market Trends, Growth Factors and Opportunities
8.6.2 Top Key Companies
8.6.3 Historic and Forecasted Market Size by Segments
8.6.4 Historic and Forecasted Market Size by Type
8.6.4.1 Software-based Virtual Sensors
8.6.4.2 Hardware-based Virtual Sensors
8.6.5 Historic and Forecasted Market Size by Technology
8.6.5.1 Artificial Intelligence (AI)
8.6.5.2 Machine Learning (ML)
8.6.5.3 Internet of Things (IoT)
8.6.5.4 Big Data Analytics
8.6.5.5 Cloud Computing
8.6.6 Historic and Forecasted Market Size by End User
8.6.6.1 Automotive
8.6.6.2 Aerospace & Defense
8.6.6.3 Manufacturing
8.6.6.4 Oil & Gas
8.6.6.5 Healthcare
8.6.6.6 Energy & Utilities
8.6.6.7 Smart Cities
8.6.6.8 Retail
8.6.6.9 Others
8.6.7 Historic and Forecast Market Size by Country
8.6.7.1 Turkiye
8.6.7.2 Bahrain
8.6.7.3 Kuwait
8.6.7.4 Saudi Arabia
8.6.7.5 Qatar
8.6.7.6 UAE
8.6.7.7 Israel
8.6.7.8 South Africa
8.7. South America Virtual Sensors Market
8.7.1 Key Market Trends, Growth Factors and Opportunities
8.7.2 Top Key Companies
8.7.3 Historic and Forecasted Market Size by Segments
8.7.4 Historic and Forecasted Market Size by Type
8.7.4.1 Software-based Virtual Sensors
8.7.4.2 Hardware-based Virtual Sensors
8.7.5 Historic and Forecasted Market Size by Technology
8.7.5.1 Artificial Intelligence (AI)
8.7.5.2 Machine Learning (ML)
8.7.5.3 Internet of Things (IoT)
8.7.5.4 Big Data Analytics
8.7.5.5 Cloud Computing
8.7.6 Historic and Forecasted Market Size by End User
8.7.6.1 Automotive
8.7.6.2 Aerospace & Defense
8.7.6.3 Manufacturing
8.7.6.4 Oil & Gas
8.7.6.5 Healthcare
8.7.6.6 Energy & Utilities
8.7.6.7 Smart Cities
8.7.6.8 Retail
8.7.6.9 Others
8.7.7 Historic and Forecast Market Size by Country
8.7.7.1 Brazil
8.7.7.2 Argentina
8.7.7.3 Rest of SA
Chapter 9 Analyst Viewpoint and Conclusion
9.1 Recommendations and Concluding Analysis
9.2 Potential Market Strategies
Chapter 10 Research Methodology
10.1 Research Process
10.2 Primary Research
10.3 Secondary Research
|
Virtual Sensors Market |
|||
|
Base Year: |
2023 |
Forecast Period: |
2024-2032 |
|
Historical Data: |
2017 to 2023 |
Market Size in 2023: |
USD 1.19 Bn. |
|
Forecast Period 2024-32 CAGR: |
31.10 % |
Market Size in 2032: |
USD 10.41 Bn. |
|
Segments Covered: |
By Type |
|
|
|
By Technology |
|
||
|
By End User |
|
||
|
By Region |
|
||
|
Key Market Drivers: |
|
||
|
Key Market Restraints: |
|
||
|
Key Opportunities: |
|
||
|
Companies Covered in the report: |
|
||


