


Ozone Technology Market Synopsis
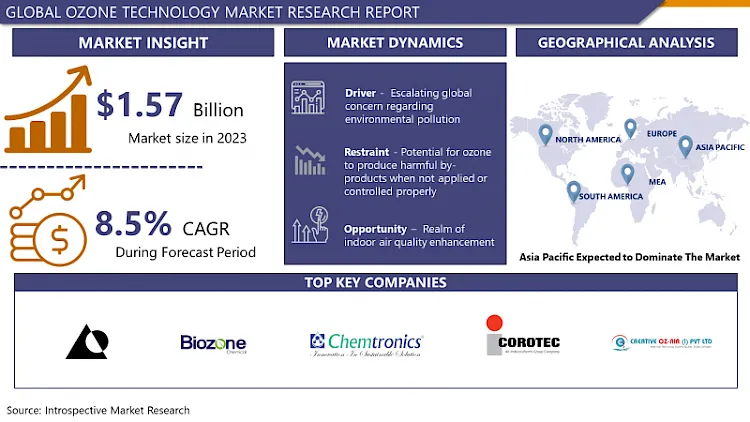
Ozone Technology Market Size Was Valued at USD 1.57 Billion in 2023 and is Projected to Reach USD 13.27 Billion by 2032, Growing at a CAGR of 8.50% From 2024-2032.
The implementation of ozone technology involves a series of processes in which ozone, an oxidizing power unit of the 3 atoms of oxygen, is used for different applications like water and air disinfection, soil cleaning and food processing. It generates ozone, which possesses the best disinfection and oxidization features. Consequently, ozone easily eliminates all pollutants and pathogens, rendering water, air and also soil clean. Sustainable ozone technology for clean industries and municipalities is an excellent solution for efficient and environmentally friendly disinfection, odor control, and remediation of pollution because it offers a sustainable approach to solving the pollution and the sanitation challenges.
Governments' stringent measures in enabling their standards on water and air quality push a market for ozone clean technology.
The ozone technology market is tagged with unlimited prospects to deal with the dire environmental problems just as the world expects to access the clean air and water. Yet, there is a pressing need to foster more cutting-edge developments and to craft new types of synergetic relationships in order to take advantage of the latest developments and maintain profitable growth.
Lately, UV ozone technology and cold plasma technology have been introduced in ozone generating processes, leading towards higher efficiency and broader market penetration. Shunting across all municipal, industrial and agricultural sectors, ozone technology is bound to expand in the years ahead owing to the growing application of the same.

Ozone Technology Market Trend Analysis
Increasing adoption of decentralized ozone systems
- The other way was that in comparison to large-scale ozone systems which which previously were centralized hence needed extensive infrastructure and massive capital investment. Nonetheless, they are picking up the pace due to leakage passing through and developing infrastructural networks, decentralized ozone systems are being adopted more widely. These decentralized systems are marked by their small size, modular setup, and flexibility, which makes for convenient connection into the existing infrastructure. Also, this improvise capacity of the system to meet the demands varying among the different levels. Decentration of ozone systems brings a higher operation efficiency in different sectors, reduces energy consumption significantly and costs which are associated with shipment and distribution.
- Similarly, addition of novel-decentralized ozone systems provides improved resistance against system’s critical complications plus spot application across specific regions to maximize resource use thereby boosting effectiveness in water and air treatment applications. In light of the increasing importance of having sustainability and efficiency considerations in place, the application of decentralized systems of ozone therapy is also likely to rapidly expand, thus driving innovative advancement and reshaping the entire ozone technology market landscape.
Realm of indoor air quality enhancement
- Notably, with more people allocating a considerable percentage of time inside house, and offices as well as public buildings, the necessity for air purification systems has become critical which should be effective. Ozone technology provides one way to deal with increasing poor quality of indoor air by using environmentally friendly and highly efficient indoor purification systems for indoor air. Utilizing ozone generators as an integral part of HVAC systems or standalone air devices for purification is the key to prevent airborne contaminants like bacteria, viruses, mold, respiratory irritants, and volatile organic compounds (VOCs) from circulating indoor spaces and thus eliminate them completely.
- Surface disinfection is only one of the benefits of ozone technology. Since the danger of airborne pathogens is often discussed in all corners of the globe and especially in the context of pandemics, the deployment of ozone technology shines as a light in the darkness. The ozonation catalytic process is rooted in the powerful oxidative properties of ozone to scavenge almost all microorganisms, including coronaviruses, bacteria, and other infectious targeted agents.
- In the effort of the commercial environments, health facilities, educational institutions, and other public styles to look for measures that are most reliable in terms of ensuring occupant safety and in minimizing transmission of dangerous pathogens intact with air, the growth rate in the air disinfection industry for ozone-based solutions is expected to have an incredible rise. So that several companies and providers of ozone equipment try to create uniquely designed products that are simple to use, resolute, and scalable, as indoor environment is getting more complex and popular on a global scale day by day.
Ozone Technology Market Segment Analysis:
Ozone Technology Market Segmented on the basis of Technology Type, Component, and End-User.
By Technology Type, Corona Discharge Ozone Generation segment is expected to dominate the market during the forecast period
- The power of the Corona Discharge Ozone Generation division in the market of ozone technologies by technology throughout the forecast period is because of the fact that there are few causes behind it that is; The technology of corona discharge ozone generation has meanwhile several advantages, like high efficiency of ozone production, relatively low operating costs and different modifications into various applications between the options as water treatment, air purification and food processing.
- Besides, these developments in coronal discharge technology include compact, low-consumption, and easy to use ozone generator types which have managed to grab the attention of the end-users as well. Incorporation of ozone generation technologies through corona discharge technology is likely to be propelled by growing worry about water and air pollution accompanied by stricter laws that regulate ozone and odor control. Furthermore, it is these factors that have been projected to play a key element in dictating the dominance of corona discharge technology in the ozone market in the next few years.
By component, Ozone Generator Units segment held the largest share of in 2023
- Owing to the fact the Ozone Generator Units category with the highest market share is nominally dominated by ozone-generating apparatus which form the essential part of the whole system. It is these units that form the backbone of ozone systems’ technology behind the production of oxygen which is further converted into ozone depending on whether corona discharge, UV radiation or electrolysis is used.
- Ozone generators are required in lots of various fields coming the water treatment systems, air purification and so on ending in the segment having a great popularity because of the high demand. Additionally, the strong technological progress of ozone generators, including the enhanced efficiency, reliability and scalability, render the segment positionally dominant in the sector.
Ozone Technology Market Regional Insights:
Asia Pacific is Expected to Dominate the Market Over the Forecast period
- Water and air pollution, urbanization problems and high population growth in the countries like China, India, Japan and Korea have raised the demand for water supply systems, air pollution controls and sewage efforts. Additionally, as strict environmental regulations directed at the reduction of pollution levels are a major factor alongside the growing recognition on the part of population about the necessity of clean water and air which contribute in pushing up the penetration of ozone technology in the region.
- Besides, as Governments are encouraging to sustainable development and they are investing totally on infrastructure projects and especially on the sectors such as water treatment and wastewater management, the growth of market for ozone technology in Asia Pacific will be upsurge.
Active Key Players in the Ozone Technology Market
- Absolute Systems Inc (China)
- BiOzone Corporation (US)
- Chemtronics Technologies Pvt. Ltd. (India)
- Corotec Corporation (US)
- Creative Oz-Air (I) Pvt Ltd (US)
- Dongguan Beelee Electronics Co., Ltd. (China)
- Ebara Corporation (Japan)
- Ecozone Technologies Ltd. (Israel)
- Eltech Ozone (India)
- ESCO International Ltd (UK)
- Faraday Ozone (India)
- Industrie De Nora S.p.A. (Italy)
- International Ozone (US)
- Lenntech (Netherlands)
- METAWATER Co., Ltd. (Japan)
- Mitsubishi Electric Corporation (Japan)
- MKS Instruments (US)
- Ozonetech Systems OTS AB (Sweden)
- Spartan Environmental Technologies (US)
- SUEZ Water Technologies & Solutions (France)
- Taoture International Enterprises Inc. (US)
- Teledyne API (US)
- Toshiba Corporation (Japan)
- Xylem (US)
- Other key Players
Key Industry Developments in the Ozone Technology Market:
- In May of last year, the American based company – Xylem, water solutions provider that staffs more than 17,000 employees – acquire Evoqua Water Technologies LLC, a global business offering cutting edge water treatment products and solutions, for an amount of around $7 Billion. 5 billion. The procurement has provided the highest-level platform that functions on a global scale, from which it can frontalise the most versatile solutions to the fast water problems of the Xylem’s customers and society.
- A Fresh Mouth product, introduced in April 2023 and called ozone generator-hydrogenated water producer, successfully sealed the deal. The generator is designed to clean the pharynx thoroughly and safely without the exposure of the human resources to the harmful agent. Ozone develops by the device so eliminates the bacteria, fungi, and viruses that are responsible for the periodontal disease, bad breath and other oral hygiene problems.
|
Global Ozone Technology Market |
|||
|
Base Year: |
2023 |
Forecast Period: |
2024-2032 |
|
Historical Data: |
2017 to 2023 |
Market Size in 2023: |
USD 1.57 Bn. |
|
Forecast Period 2024-32 CAGR: |
8.50% |
Market Size in 2032: |
USD 13.27 Bn. |
|
Segments Covered: |
By Technology Type |
|
|
|
By Component |
|
||
|
By End-User |
|
||
|
By Region |
|
||
|
Key Market Drivers: |
|
||
|
Key Market Restraints: |
|
||
|
Key Opportunities: |
|
||
|
Companies Covered in the report: |
|
||
Chapter 1: Introduction
1.1 Scope and Coverage
Chapter 2:Executive Summary
Chapter 3: Market Landscape
3.1 Market Dynamics
3.1.1 Drivers
3.1.2 Restraints
3.1.3 Opportunities
3.1.4 Challenges
3.2 Market Trend Analysis
3.3 PESTLE Analysis
3.4 Porter's Five Forces Analysis
3.5 Industry Value Chain Analysis
3.6 Ecosystem
3.7 Regulatory Landscape
3.8 Price Trend Analysis
3.9 Patent Analysis
3.10 Technology Evolution
3.11 Investment Pockets
3.12 Import-Export Analysis
Chapter 4: Ozone Technology Market by Technology Type (2018-2032)
4.1 Ozone Technology Market Snapshot and Growth Engine
4.2 Market Overview
4.3 Corona Discharge Ozone Generation
4.3.1 Introduction and Market Overview
4.3.2 Historic and Forecasted Market Size in Value USD and Volume Units
4.3.3 Key Market Trends, Growth Factors, and Opportunities
4.3.4 Geographic Segmentation Analysis
4.4 UV Ozone Generation
4.5 Electrolytic Ozone Generation
4.6 Cold Plasma Ozone Generation
4.7 Other Ozone Generation Technologies
Chapter 5: Ozone Technology Market by Component (2018-2032)
5.1 Ozone Technology Market Snapshot and Growth Engine
5.2 Market Overview
5.3 Ozone Generator Units
5.3.1 Introduction and Market Overview
5.3.2 Historic and Forecasted Market Size in Value USD and Volume Units
5.3.3 Key Market Trends, Growth Factors, and Opportunities
5.3.4 Geographic Segmentation Analysis
5.4 Sensors
5.5 Controllers
5.6 Others
Chapter 6: Ozone Technology Market by End-User (2018-2032)
6.1 Ozone Technology Market Snapshot and Growth Engine
6.2 Market Overview
6.3 Municipal
6.3.1 Introduction and Market Overview
6.3.2 Historic and Forecasted Market Size in Value USD and Volume Units
6.3.3 Key Market Trends, Growth Factors, and Opportunities
6.3.4 Geographic Segmentation Analysis
6.4 Healthcare
6.5 Food & Beverage
6.6 Agriculture
6.7 Textile
6.8 Semiconductor Manufacturing
6.9 Others
Chapter 7: Company Profiles and Competitive Analysis
7.1 Competitive Landscape
7.1.1 Competitive Benchmarking
7.1.2 Ozone Technology Market Share by Manufacturer (2024)
7.1.3 Industry BCG Matrix
7.1.4 Heat Map Analysis
7.1.5 Mergers and Acquisitions
7.2 APPLE (U.S.)
7.2.1 Company Overview
7.2.2 Key Executives
7.2.3 Company Snapshot
7.2.4 Role of the Company in the Market
7.2.5 Sustainability and Social Responsibility
7.2.6 Operating Business Segments
7.2.7 Product Portfolio
7.2.8 Business Performance
7.2.9 Key Strategic Moves and Recent Developments
7.2.10 SWOT Analysis
7.3 SAMSUNG ELECTRONICS (SOUTH KOREA)
7.4 FITBIT (U.S.)
7.5 MOTOROLA (U.S.)
7.6 MICROSOFT (U.S.)
7.7 JAWBONE (U.S.)
7.8 UNDER ARMOUR (U.S.)
7.9 PEBBLE (U.S.)
7.10 LG (SOUTH KOREA)
7.11 LENOVO (CHINA)
7.12 WITHINGS (FRANCE)
7.13 GARMIN (SWITZERLAND)
7.14
Chapter 8: Global Ozone Technology Market By Region
8.1 Overview
8.2. North America Ozone Technology Market
8.2.1 Key Market Trends, Growth Factors and Opportunities
8.2.2 Top Key Companies
8.2.3 Historic and Forecasted Market Size by Segments
8.2.4 Historic and Forecasted Market Size by Technology Type
8.2.4.1 Corona Discharge Ozone Generation
8.2.4.2 UV Ozone Generation
8.2.4.3 Electrolytic Ozone Generation
8.2.4.4 Cold Plasma Ozone Generation
8.2.4.5 Other Ozone Generation Technologies
8.2.5 Historic and Forecasted Market Size by Component
8.2.5.1 Ozone Generator Units
8.2.5.2 Sensors
8.2.5.3 Controllers
8.2.5.4 Others
8.2.6 Historic and Forecasted Market Size by End-User
8.2.6.1 Municipal
8.2.6.2 Healthcare
8.2.6.3 Food & Beverage
8.2.6.4 Agriculture
8.2.6.5 Textile
8.2.6.6 Semiconductor Manufacturing
8.2.6.7 Others
8.2.7 Historic and Forecast Market Size by Country
8.2.7.1 US
8.2.7.2 Canada
8.2.7.3 Mexico
8.3. Eastern Europe Ozone Technology Market
8.3.1 Key Market Trends, Growth Factors and Opportunities
8.3.2 Top Key Companies
8.3.3 Historic and Forecasted Market Size by Segments
8.3.4 Historic and Forecasted Market Size by Technology Type
8.3.4.1 Corona Discharge Ozone Generation
8.3.4.2 UV Ozone Generation
8.3.4.3 Electrolytic Ozone Generation
8.3.4.4 Cold Plasma Ozone Generation
8.3.4.5 Other Ozone Generation Technologies
8.3.5 Historic and Forecasted Market Size by Component
8.3.5.1 Ozone Generator Units
8.3.5.2 Sensors
8.3.5.3 Controllers
8.3.5.4 Others
8.3.6 Historic and Forecasted Market Size by End-User
8.3.6.1 Municipal
8.3.6.2 Healthcare
8.3.6.3 Food & Beverage
8.3.6.4 Agriculture
8.3.6.5 Textile
8.3.6.6 Semiconductor Manufacturing
8.3.6.7 Others
8.3.7 Historic and Forecast Market Size by Country
8.3.7.1 Russia
8.3.7.2 Bulgaria
8.3.7.3 The Czech Republic
8.3.7.4 Hungary
8.3.7.5 Poland
8.3.7.6 Romania
8.3.7.7 Rest of Eastern Europe
8.4. Western Europe Ozone Technology Market
8.4.1 Key Market Trends, Growth Factors and Opportunities
8.4.2 Top Key Companies
8.4.3 Historic and Forecasted Market Size by Segments
8.4.4 Historic and Forecasted Market Size by Technology Type
8.4.4.1 Corona Discharge Ozone Generation
8.4.4.2 UV Ozone Generation
8.4.4.3 Electrolytic Ozone Generation
8.4.4.4 Cold Plasma Ozone Generation
8.4.4.5 Other Ozone Generation Technologies
8.4.5 Historic and Forecasted Market Size by Component
8.4.5.1 Ozone Generator Units
8.4.5.2 Sensors
8.4.5.3 Controllers
8.4.5.4 Others
8.4.6 Historic and Forecasted Market Size by End-User
8.4.6.1 Municipal
8.4.6.2 Healthcare
8.4.6.3 Food & Beverage
8.4.6.4 Agriculture
8.4.6.5 Textile
8.4.6.6 Semiconductor Manufacturing
8.4.6.7 Others
8.4.7 Historic and Forecast Market Size by Country
8.4.7.1 Germany
8.4.7.2 UK
8.4.7.3 France
8.4.7.4 The Netherlands
8.4.7.5 Italy
8.4.7.6 Spain
8.4.7.7 Rest of Western Europe
8.5. Asia Pacific Ozone Technology Market
8.5.1 Key Market Trends, Growth Factors and Opportunities
8.5.2 Top Key Companies
8.5.3 Historic and Forecasted Market Size by Segments
8.5.4 Historic and Forecasted Market Size by Technology Type
8.5.4.1 Corona Discharge Ozone Generation
8.5.4.2 UV Ozone Generation
8.5.4.3 Electrolytic Ozone Generation
8.5.4.4 Cold Plasma Ozone Generation
8.5.4.5 Other Ozone Generation Technologies
8.5.5 Historic and Forecasted Market Size by Component
8.5.5.1 Ozone Generator Units
8.5.5.2 Sensors
8.5.5.3 Controllers
8.5.5.4 Others
8.5.6 Historic and Forecasted Market Size by End-User
8.5.6.1 Municipal
8.5.6.2 Healthcare
8.5.6.3 Food & Beverage
8.5.6.4 Agriculture
8.5.6.5 Textile
8.5.6.6 Semiconductor Manufacturing
8.5.6.7 Others
8.5.7 Historic and Forecast Market Size by Country
8.5.7.1 China
8.5.7.2 India
8.5.7.3 Japan
8.5.7.4 South Korea
8.5.7.5 Malaysia
8.5.7.6 Thailand
8.5.7.7 Vietnam
8.5.7.8 The Philippines
8.5.7.9 Australia
8.5.7.10 New Zealand
8.5.7.11 Rest of APAC
8.6. Middle East & Africa Ozone Technology Market
8.6.1 Key Market Trends, Growth Factors and Opportunities
8.6.2 Top Key Companies
8.6.3 Historic and Forecasted Market Size by Segments
8.6.4 Historic and Forecasted Market Size by Technology Type
8.6.4.1 Corona Discharge Ozone Generation
8.6.4.2 UV Ozone Generation
8.6.4.3 Electrolytic Ozone Generation
8.6.4.4 Cold Plasma Ozone Generation
8.6.4.5 Other Ozone Generation Technologies
8.6.5 Historic and Forecasted Market Size by Component
8.6.5.1 Ozone Generator Units
8.6.5.2 Sensors
8.6.5.3 Controllers
8.6.5.4 Others
8.6.6 Historic and Forecasted Market Size by End-User
8.6.6.1 Municipal
8.6.6.2 Healthcare
8.6.6.3 Food & Beverage
8.6.6.4 Agriculture
8.6.6.5 Textile
8.6.6.6 Semiconductor Manufacturing
8.6.6.7 Others
8.6.7 Historic and Forecast Market Size by Country
8.6.7.1 Turkiye
8.6.7.2 Bahrain
8.6.7.3 Kuwait
8.6.7.4 Saudi Arabia
8.6.7.5 Qatar
8.6.7.6 UAE
8.6.7.7 Israel
8.6.7.8 South Africa
8.7. South America Ozone Technology Market
8.7.1 Key Market Trends, Growth Factors and Opportunities
8.7.2 Top Key Companies
8.7.3 Historic and Forecasted Market Size by Segments
8.7.4 Historic and Forecasted Market Size by Technology Type
8.7.4.1 Corona Discharge Ozone Generation
8.7.4.2 UV Ozone Generation
8.7.4.3 Electrolytic Ozone Generation
8.7.4.4 Cold Plasma Ozone Generation
8.7.4.5 Other Ozone Generation Technologies
8.7.5 Historic and Forecasted Market Size by Component
8.7.5.1 Ozone Generator Units
8.7.5.2 Sensors
8.7.5.3 Controllers
8.7.5.4 Others
8.7.6 Historic and Forecasted Market Size by End-User
8.7.6.1 Municipal
8.7.6.2 Healthcare
8.7.6.3 Food & Beverage
8.7.6.4 Agriculture
8.7.6.5 Textile
8.7.6.6 Semiconductor Manufacturing
8.7.6.7 Others
8.7.7 Historic and Forecast Market Size by Country
8.7.7.1 Brazil
8.7.7.2 Argentina
8.7.7.3 Rest of SA
Chapter 9 Analyst Viewpoint and Conclusion
9.1 Recommendations and Concluding Analysis
9.2 Potential Market Strategies
Chapter 10 Research Methodology
10.1 Research Process
10.2 Primary Research
10.3 Secondary Research
|
Global Ozone Technology Market |
|||
|
Base Year: |
2023 |
Forecast Period: |
2024-2032 |
|
Historical Data: |
2017 to 2023 |
Market Size in 2023: |
USD 1.57 Bn. |
|
Forecast Period 2024-32 CAGR: |
8.50% |
Market Size in 2032: |
USD 13.27 Bn. |
|
Segments Covered: |
By Technology Type |
|
|
|
By Component |
|
||
|
By End-User |
|
||
|
By Region |
|
||
|
Key Market Drivers: |
|
||
|
Key Market Restraints: |
|
||
|
Key Opportunities: |
|
||
|
Companies Covered in the report: |
|
||


