


Geotourism Market Synopsis
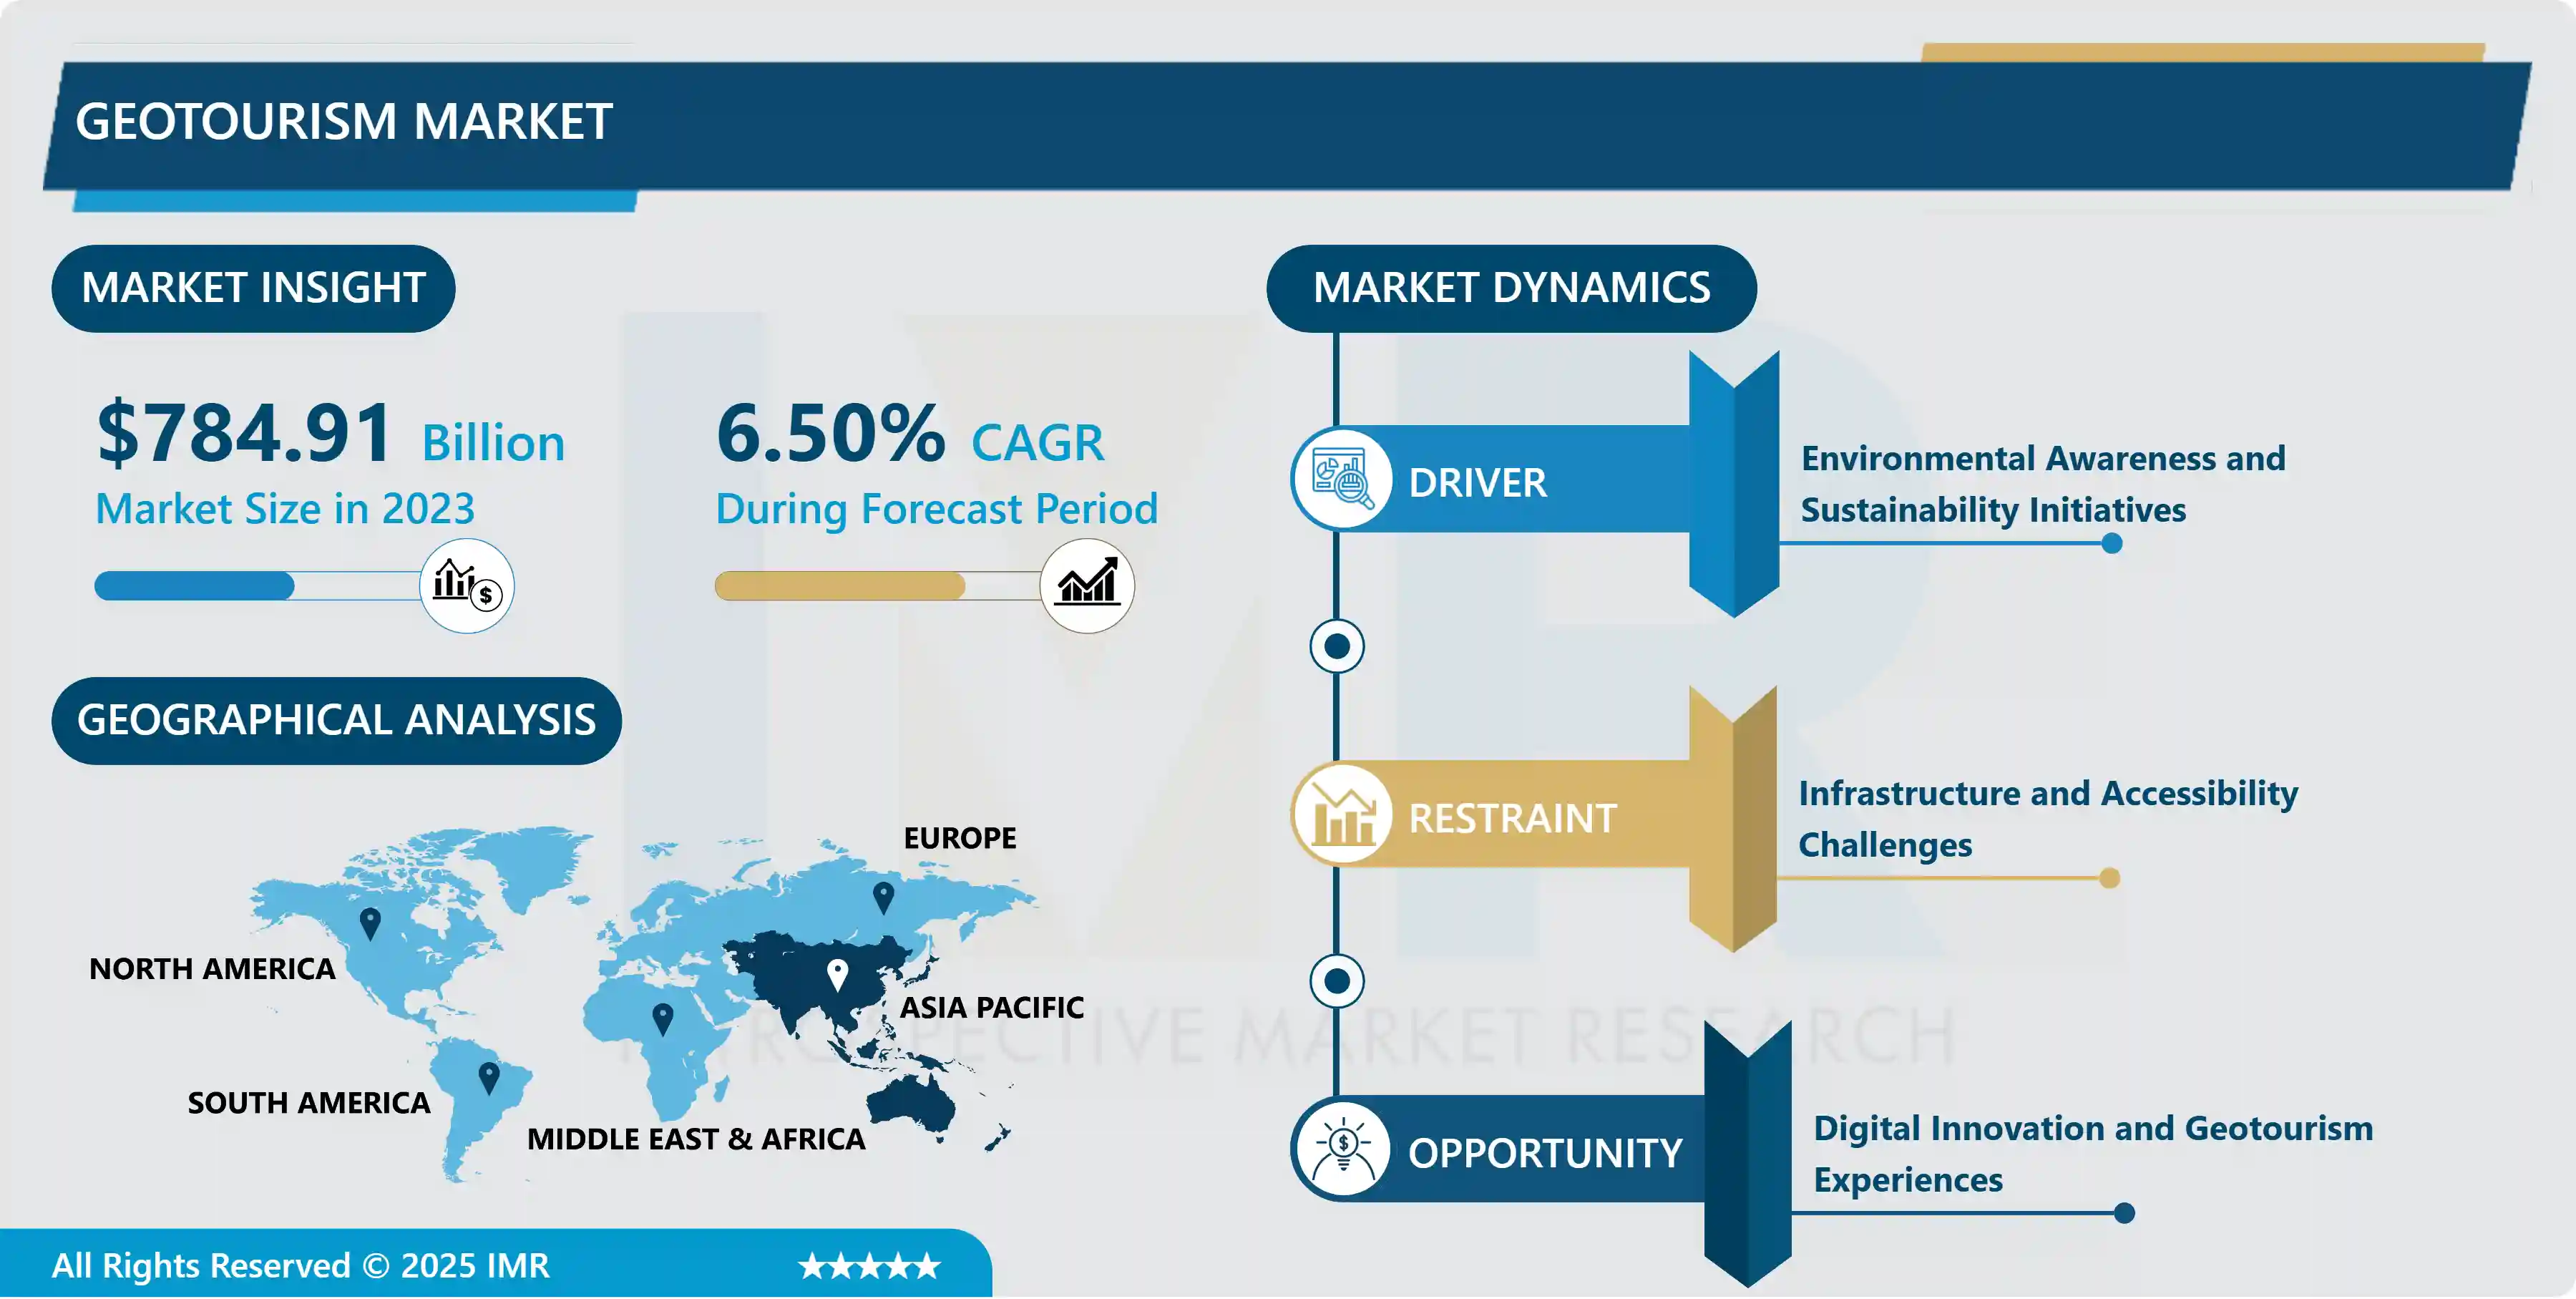
Geotourism Market Size Was Valued at USD 784.91 Billion in 2023, and is Projected to Reach USD 1,299.01 Billion by 2032, Growing at a CAGR of 6.50% From 2024-2032.
Geotourism refers to tourism that focuses on the unique geological features and landscapes of a destination, as well as the cultural and environmental aspects associated with them. It emphasizes responsible travel practices that contribute to the conservation of natural resources and the well-being of local communities. Geotourism encourages visitors to appreciate the geological heritage of an area while promoting sustainable development and preserving its natural and cultural identity.
Geotourism, a relatively new concept in the realm of travel and tourism, emphasizes the preservation and appreciation of a destination's unique geological and cultural heritage. Unlike traditional mass tourism, which often prioritizes commercialization and exploitation of natural resources, geotourism seeks to promote sustainable practices that benefit local communities while conserving the environment. The geotourism market has been steadily growing as travelers become more conscious of their environmental impact and seek authentic experiences that connect them with the natural world and diverse cultures.
The key drivers of the geotourism market is the increasing awareness and concern for environmental sustainability. As travelers become more conscious of their ecological footprint, there is a growing demand for destinations that prioritize conservation efforts and minimize negative impacts on the environment. Geotourism destinations often offer opportunities for visitors to engage in activities such as hiking, wildlife observation, and responsible ecotourism, allowing them to experience the natural beauty of the area while supporting local conservation initiatives.
Geotourism appeals to travelers seeking unique and authentic experiences. In a world where many destinations are becoming increasingly homogenized due to globalization, geotourism offers a refreshing alternative by celebrating the distinctiveness of each location's geological and cultural heritage. Whether it's exploring ancient geological formations, learning about indigenous traditions, or sampling local cuisine, geotourism allows travelers to immerse themselves in the rich tapestry of human history and natural wonders.
The rise of digital technology has played a significant role in driving the growth of the geotourism market. With the proliferation of smartphones and social media platforms, travelers now have unprecedented access to information about geotourism destinations and can easily share their experiences with others. This has led to increased visibility and awareness of geotourism as a viable travel option, attracting a broader audience of eco-conscious travelers.
The geotourism sector is characterized by a diverse range of offerings, catering to different interests and preferences. Some geotourism destinations may focus primarily on geological attractions, such as volcanoes, caves, or rock formations, while others may highlight cultural heritage sites, archaeological ruins, or indigenous communities. This diversity ensures that there is something for everyone in the geotourism market, appealing to a broad spectrum of travelers, from nature enthusiasts to history buffs to adventure seekers.
Despite its many benefits, the geotourism market also faces several challenges. One of the primary concerns is the need for responsible management and sustainable development of geotourism destinations. As the popularity of geotourism continues to grow, there is a risk of overdevelopment and degradation of natural and cultural resources if not properly managed. Therefore, it is essential for stakeholders, including governments, local communities, and tour operators, to work together to establish effective policies and practices that ensure the long-term sustainability of geotourism destinations.
The geotourism market presents exciting opportunities for both travelers and destination communities alike. By embracing principles of sustainability, authenticity, and preservation, geotourism offers a pathway towards a more responsible and enriching form of travel that celebrates the unique beauty and heritage of our planet's landscapes. As awareness of environmental issues continues to grow, the demand for geotourism experiences is likely to increase, driving further growth and innovation in this dynamic and evolving market.

Geotourism Market Trend Analysis
Sustainable Travel Practices Drive Geotourism Growth
- Sustainable travel practices are increasingly becoming the driving force behind the growth of geotourism. As awareness of environmental and social impacts of tourism grows, travelers are seeking experiences that not only allow them to explore natural and cultural wonders but also contribute positively to local communities and ecosystems. Geotourism, which focuses on responsible travel to destinations that conserve the environment, preserve cultural heritage, and benefit local communities, aligns well with this trend.
- Travelers are now more inclined to choose destinations and activities that minimize their carbon footprint, support local economies, and promote conservation efforts. This shift in mindset has led to a surge in demand for geotourism experiences, driving the development of sustainable tourism initiatives worldwide. By prioritizing sustainable practices, geotourism not only offers travelers unique and enriching experiences but also plays a crucial role in safeguarding our planet's natural and cultural treasures for future generations.
Digital Innovation and Geotourism Experiences
- Digital innovation has significantly transformed the landscape of geotourism experiences, offering travelers immersive and interactive ways to explore geological wonders around the world. Advancements in technology, such as augmented reality (AR) and virtual reality (VR), have allowed tourists to engage with geological sites in unprecedented ways, virtually transporting them to remote locations or providing in-depth educational experiences from the comfort of their homes. Mobile applications equipped with GPS navigation and multimedia content offer enhanced guidance and storytelling, enriching visitors' understanding of the geological significance and cultural heritage of various destinations.
- The integration of geotourism with social media platforms enables travelers to share their experiences instantly, fostering a sense of community and inspiring others to embark on similar adventures. This digital revolution in geotourism not only enhances the visitor experience but also contributes to the sustainable management and conservation of geological sites by raising awareness and promoting responsible travel practices. As the digital landscape continues to evolve, the potential for innovative geotourism experiences to captivate and educate travelers is boundless, further cementing the market's position as a dynamic and immersive sector within the tourism industry.
Geotourism Market Segment Analysis:
Geotourism Market is Segmented based on Tourism Type, Direct Suppliers, Indirect Suppliers, Age, Demographic, Nationality, Booking Channel , and Tour Type.
By Tourism Type , Natural Tourism segment is expected to dominate the market during the forecast period
- Sustainable Tourism: This type of tourism focuses on minimizing the negative impact on the environment and local cultures while promoting conservation efforts and supporting local communities.
- Urban Geo-Tourism: Urban geotourism involves exploring geological features within urban environments, such as geological landmarks, building materials, and geological history incorporated into city landscapes.
- Rural Geo-Tourism: Rural geotourism centers around exploring geological features in rural areas, including natural landscapes, geological formations, and their significance to local communities and ecosystems.
- Natural Tourism: Natural tourism encompasses activities focused on experiencing and appreciating natural environments, such as national parks, wildlife reserves, and scenic landscapes, often with an emphasis on conservation and preservation.
- Eco Geo-tourism: Eco geotourism combines elements of ecological and geological tourism, emphasizing sustainable practices and promoting understanding of the interconnectedness between geological processes and ecosystems.
- Others: This category could include niche forms of geotourism, such as adventure geotourism, cultural geotourism, or heritage geotourism, which may focus on specific aspects of geology and their relation to cultural or historical contexts.
By Booking Channel, Online Booking segment held the largest share in 2023
- Geotourism, as a growing sector within the tourism industry, offers various booking channels to cater to the diverse preferences of travelers. These channels include phone booking, online booking, and in-person booking. Phone booking allows travelers to connect with tour operators or accommodation providers directly, providing a personalized touch and the opportunity to address specific inquiries or requests. Online booking, on the other hand, has become increasingly popular due to its convenience and accessibility.
- Through websites or mobile apps, travelers can browse through a wide range of geotourism offerings, compare prices, and make reservations with just a few clicks. This digital platform not only streamlines the booking process but also provides detailed information about destinations, activities, and accommodations, empowering travelers to make well-informed decisions. Lastly, in-person booking remains relevant, especially for those who prefer face-to-face interactions or seek local expertise. Tourist information centers, travel agencies, or on-site booking offices offer assistance and recommendations, enhancing the overall travel experience. Each booking channel caters to different preferences and needs, contributing to the accessibility and popularity of geotourism destinations worldwide.
Geotourism Market Regional Insights:
Asia-Pacific is Expected to Dominate the Market Over the Forecast period
- The Asia-Pacific region is poised to emerge as a dominant force in the geotourism market over the forecast period. With its diverse landscapes, rich cultural heritage, and increasing focus on sustainable tourism practices, countries across the Asia-Pacific region are attracting a growing number of travelers seeking unique geological experiences. From the towering peaks of the Himalayas to the stunning beaches of Southeast Asia, the region offers a plethora of geological wonders waiting to be explored.
- Initiatives aimed at preserving natural and cultural heritage sites, coupled with advancements in infrastructure and accessibility, are further bolstering the appeal of geotourism in the region. As travelers increasingly seek authentic and immersive experiences, the Asia-Pacific's blend of natural beauty and cultural heritage positions it as a key player in the global geotourism market for the foreseeable future.
Active Key Players in the Geotourism Market
- Expedia Group(US)
- Priceline Group(US)
- China Travel (China)
- China CYTS Tours Holding( China)
- American Express Global Business Travel (US)
- Carlson Wagonlit Travel(US)
- BCD Travel (Netherlands)
- HRG North America(UK)
- Travel Leaders Group(US)
- Fareportal/Travelong(US)
- AAA Travel(US)
- Travel and Transport(US)
- Altour(US)
- World Travel Inc.(US)
- Omega World Travel(US)
- Frosch (Germany)
- JTB Americas Group(US)
- Mountain Travel Sobek (California)
- TUI AG(Germany)
- Other Key Players
Key Industry Developments in the Geotourism Market
- In March 2022, Prime Minister Imran Khan announced his plan to unveil the first ecotourism village. It will be launched in Kaghan Valley. It will be used for generating funds to initiate economic uplift and ecological conservation. The ecotourism village is known for its natural environment, wildlife, and greenery. It would help to attract foreign and local tourists.
|
Geotourism Market |
|||
|
Base Year: |
2023 |
Forecast Period: |
2024-2032 |
|
Historical Data: |
2017 to 2023 |
Market Size in 2023: |
USD 784.91 Bn. |
|
Forecast Period 2024-32 CAGR: |
6.50% |
Market Size in 2032: |
USD 1,299.01 Bn. |
|
Segments Covered: |
By Tourism Type |
|
|
|
By Direct Suppliers |
|
||
|
By Indirect Suppliers |
|
||
|
By Age |
|
||
|
By Demographic |
|
||
|
By Nationality |
|
||
|
By Booking Channel |
|
||
|
By Tour Type |
|
||
|
By Region |
|
||
|
Key Market Drivers: |
|
||
|
Key Market Restraints: |
|
||
|
Key Opportunities: |
|
||
|
Companies Covered in the report: |
|
||
Chapter 1: Introduction
1.1 Scope and Coverage
Chapter 2:Executive Summary
Chapter 3: Market Landscape
3.1 Market Dynamics
3.1.1 Drivers
3.1.2 Restraints
3.1.3 Opportunities
3.1.4 Challenges
3.2 Market Trend Analysis
3.3 PESTLE Analysis
3.4 Porter's Five Forces Analysis
3.5 Industry Value Chain Analysis
3.6 Ecosystem
3.7 Regulatory Landscape
3.8 Price Trend Analysis
3.9 Patent Analysis
3.10 Technology Evolution
3.11 Investment Pockets
3.12 Import-Export Analysis
Chapter 4: Geotourism Market by Tourism Type (2018-2032)
4.1 Geotourism Market Snapshot and Growth Engine
4.2 Market Overview
4.3 Sustainable Tourism
4.3.1 Introduction and Market Overview
4.3.2 Historic and Forecasted Market Size in Value USD and Volume Units
4.3.3 Key Market Trends, Growth Factors, and Opportunities
4.3.4 Geographic Segmentation Analysis
4.4 Urban Geo-Tourism
4.5 Rural Geo-Tourism
4.6 Natural Tourism
4.7 Eco Geo-tourism
4.8 Others
Chapter 5: Geotourism Market by Direct Suppliers (2018-2032)
5.1 Geotourism Market Snapshot and Growth Engine
5.2 Market Overview
5.3 Airlines
5.3.1 Introduction and Market Overview
5.3.2 Historic and Forecasted Market Size in Value USD and Volume Units
5.3.3 Key Market Trends, Growth Factors, and Opportunities
5.3.4 Geographic Segmentation Analysis
5.4 Hotel Companies
5.5 Car Rental
5.6 Train
5.7 Tour Operators
5.8 Government Bodies
Chapter 6: Geotourism Market by Indirect Suppliers (2018-2032)
6.1 Geotourism Market Snapshot and Growth Engine
6.2 Market Overview
6.3 Online Travel Agency (OTA)
6.3.1 Introduction and Market Overview
6.3.2 Historic and Forecasted Market Size in Value USD and Volume Units
6.3.3 Key Market Trends, Growth Factors, and Opportunities
6.3.4 Geographic Segmentation Analysis
6.4 Traditional Travel Agencies
6.5 Travel Management Companies (TMCs)
6.6 Corporate Buyers
6.7 Aggregators
Chapter 7: Geotourism Market by Age (2018-2032)
7.1 Geotourism Market Snapshot and Growth Engine
7.2 Market Overview
7.3 Under 15
7.3.1 Introduction and Market Overview
7.3.2 Historic and Forecasted Market Size in Value USD and Volume Units
7.3.3 Key Market Trends, Growth Factors, and Opportunities
7.3.4 Geographic Segmentation Analysis
7.4 16 to 25
7.5 26 to 35
7.6 36 to 45
7.7 46 to 55
7.8 Over 55
Chapter 8: Geotourism Market by Demographic (2018-2032)
8.1 Geotourism Market Snapshot and Growth Engine
8.2 Market Overview
8.3 Male
8.3.1 Introduction and Market Overview
8.3.2 Historic and Forecasted Market Size in Value USD and Volume Units
8.3.3 Key Market Trends, Growth Factors, and Opportunities
8.3.4 Geographic Segmentation Analysis
8.4 Female
8.5 Kids
Chapter 9: Geotourism Market by Nationality (2018-2032)
9.1 Geotourism Market Snapshot and Growth Engine
9.2 Market Overview
9.3 Domestic
9.3.1 Introduction and Market Overview
9.3.2 Historic and Forecasted Market Size in Value USD and Volume Units
9.3.3 Key Market Trends, Growth Factors, and Opportunities
9.3.4 Geographic Segmentation Analysis
9.4 International
Chapter 10: Company Profiles and Competitive Analysis
10.1 Competitive Landscape
10.1.1 Competitive Benchmarking
10.1.2 Geotourism Market Share by Manufacturer (2024)
10.1.3 Industry BCG Matrix
10.1.4 Heat Map Analysis
10.1.5 Mergers and Acquisitions
10.2 META PLATFORMS INC. (US)
10.2.1 Company Overview
10.2.2 Key Executives
10.2.3 Company Snapshot
10.2.4 Role of the Company in the Market
10.2.5 Sustainability and Social Responsibility
10.2.6 Operating Business Segments
10.2.7 Product Portfolio
10.2.8 Business Performance
10.2.9 Key Strategic Moves and Recent Developments
10.2.10 SWOT Analysis
10.3 OCULUS VR
10.4 LLC (US)
10.5 VALVE CORPORATION (US)
10.6 GOOGLE LLC (US)
10.7 MICROSOFT CORPORATION (US)
10.8 NVIDIA CORPORATION (US)
10.9 UNITY TECHNOLOGIES (US)
10.10 APPLE INC. (US)
10.11 ADVANCED MICRO DEVICES INC. (US)
10.12 INTEL CORPORATION (US)
10.13 QUALCOMM INCORPORATED (US)
10.14 ELECTRONIC ARTS INC. (US)
10.15 EPIC GAMES INC. (US)
10.16 ACTIVISION BLIZZARD INC. (US)
10.17 MAGIC LEAP INC. (US)
10.18 GOOGLE STADIA (US)
10.19 SIXENSE ENTERTAINMENT INC. (US)
10.20 SLIGHTLY MAD STUDIOS (UK)
10.21 UBISOFT ENTERTAINMENT SA (FRANCE)
10.22 LENOVO GROUP LIMITED (CHINA)
10.23 SONY INTERACTIVE ENTERTAINMENT LLC (JAPAN)
10.24 NINTENDO COLTD. (JAPAN)
10.25 SAMSUNG ELECTRONICS COLTD. (SOUTH KOREA)
10.26 HTC CORPORATION (TAIWAN)
10.27
Chapter 11: Global Geotourism Market By Region
11.1 Overview
11.2. North America Geotourism Market
11.2.1 Key Market Trends, Growth Factors and Opportunities
11.2.2 Top Key Companies
11.2.3 Historic and Forecasted Market Size by Segments
11.2.4 Historic and Forecasted Market Size by Tourism Type
11.2.4.1 Sustainable Tourism
11.2.4.2 Urban Geo-Tourism
11.2.4.3 Rural Geo-Tourism
11.2.4.4 Natural Tourism
11.2.4.5 Eco Geo-tourism
11.2.4.6 Others
11.2.5 Historic and Forecasted Market Size by Direct Suppliers
11.2.5.1 Airlines
11.2.5.2 Hotel Companies
11.2.5.3 Car Rental
11.2.5.4 Train
11.2.5.5 Tour Operators
11.2.5.6 Government Bodies
11.2.6 Historic and Forecasted Market Size by Indirect Suppliers
11.2.6.1 Online Travel Agency (OTA)
11.2.6.2 Traditional Travel Agencies
11.2.6.3 Travel Management Companies (TMCs)
11.2.6.4 Corporate Buyers
11.2.6.5 Aggregators
11.2.7 Historic and Forecasted Market Size by Age
11.2.7.1 Under 15
11.2.7.2 16 to 25
11.2.7.3 26 to 35
11.2.7.4 36 to 45
11.2.7.5 46 to 55
11.2.7.6 Over 55
11.2.8 Historic and Forecasted Market Size by Demographic
11.2.8.1 Male
11.2.8.2 Female
11.2.8.3 Kids
11.2.9 Historic and Forecasted Market Size by Nationality
11.2.9.1 Domestic
11.2.9.2 International
11.2.10 Historic and Forecast Market Size by Country
11.2.10.1 US
11.2.10.2 Canada
11.2.10.3 Mexico
11.3. Eastern Europe Geotourism Market
11.3.1 Key Market Trends, Growth Factors and Opportunities
11.3.2 Top Key Companies
11.3.3 Historic and Forecasted Market Size by Segments
11.3.4 Historic and Forecasted Market Size by Tourism Type
11.3.4.1 Sustainable Tourism
11.3.4.2 Urban Geo-Tourism
11.3.4.3 Rural Geo-Tourism
11.3.4.4 Natural Tourism
11.3.4.5 Eco Geo-tourism
11.3.4.6 Others
11.3.5 Historic and Forecasted Market Size by Direct Suppliers
11.3.5.1 Airlines
11.3.5.2 Hotel Companies
11.3.5.3 Car Rental
11.3.5.4 Train
11.3.5.5 Tour Operators
11.3.5.6 Government Bodies
11.3.6 Historic and Forecasted Market Size by Indirect Suppliers
11.3.6.1 Online Travel Agency (OTA)
11.3.6.2 Traditional Travel Agencies
11.3.6.3 Travel Management Companies (TMCs)
11.3.6.4 Corporate Buyers
11.3.6.5 Aggregators
11.3.7 Historic and Forecasted Market Size by Age
11.3.7.1 Under 15
11.3.7.2 16 to 25
11.3.7.3 26 to 35
11.3.7.4 36 to 45
11.3.7.5 46 to 55
11.3.7.6 Over 55
11.3.8 Historic and Forecasted Market Size by Demographic
11.3.8.1 Male
11.3.8.2 Female
11.3.8.3 Kids
11.3.9 Historic and Forecasted Market Size by Nationality
11.3.9.1 Domestic
11.3.9.2 International
11.3.10 Historic and Forecast Market Size by Country
11.3.10.1 Russia
11.3.10.2 Bulgaria
11.3.10.3 The Czech Republic
11.3.10.4 Hungary
11.3.10.5 Poland
11.3.10.6 Romania
11.3.10.7 Rest of Eastern Europe
11.4. Western Europe Geotourism Market
11.4.1 Key Market Trends, Growth Factors and Opportunities
11.4.2 Top Key Companies
11.4.3 Historic and Forecasted Market Size by Segments
11.4.4 Historic and Forecasted Market Size by Tourism Type
11.4.4.1 Sustainable Tourism
11.4.4.2 Urban Geo-Tourism
11.4.4.3 Rural Geo-Tourism
11.4.4.4 Natural Tourism
11.4.4.5 Eco Geo-tourism
11.4.4.6 Others
11.4.5 Historic and Forecasted Market Size by Direct Suppliers
11.4.5.1 Airlines
11.4.5.2 Hotel Companies
11.4.5.3 Car Rental
11.4.5.4 Train
11.4.5.5 Tour Operators
11.4.5.6 Government Bodies
11.4.6 Historic and Forecasted Market Size by Indirect Suppliers
11.4.6.1 Online Travel Agency (OTA)
11.4.6.2 Traditional Travel Agencies
11.4.6.3 Travel Management Companies (TMCs)
11.4.6.4 Corporate Buyers
11.4.6.5 Aggregators
11.4.7 Historic and Forecasted Market Size by Age
11.4.7.1 Under 15
11.4.7.2 16 to 25
11.4.7.3 26 to 35
11.4.7.4 36 to 45
11.4.7.5 46 to 55
11.4.7.6 Over 55
11.4.8 Historic and Forecasted Market Size by Demographic
11.4.8.1 Male
11.4.8.2 Female
11.4.8.3 Kids
11.4.9 Historic and Forecasted Market Size by Nationality
11.4.9.1 Domestic
11.4.9.2 International
11.4.10 Historic and Forecast Market Size by Country
11.4.10.1 Germany
11.4.10.2 UK
11.4.10.3 France
11.4.10.4 The Netherlands
11.4.10.5 Italy
11.4.10.6 Spain
11.4.10.7 Rest of Western Europe
11.5. Asia Pacific Geotourism Market
11.5.1 Key Market Trends, Growth Factors and Opportunities
11.5.2 Top Key Companies
11.5.3 Historic and Forecasted Market Size by Segments
11.5.4 Historic and Forecasted Market Size by Tourism Type
11.5.4.1 Sustainable Tourism
11.5.4.2 Urban Geo-Tourism
11.5.4.3 Rural Geo-Tourism
11.5.4.4 Natural Tourism
11.5.4.5 Eco Geo-tourism
11.5.4.6 Others
11.5.5 Historic and Forecasted Market Size by Direct Suppliers
11.5.5.1 Airlines
11.5.5.2 Hotel Companies
11.5.5.3 Car Rental
11.5.5.4 Train
11.5.5.5 Tour Operators
11.5.5.6 Government Bodies
11.5.6 Historic and Forecasted Market Size by Indirect Suppliers
11.5.6.1 Online Travel Agency (OTA)
11.5.6.2 Traditional Travel Agencies
11.5.6.3 Travel Management Companies (TMCs)
11.5.6.4 Corporate Buyers
11.5.6.5 Aggregators
11.5.7 Historic and Forecasted Market Size by Age
11.5.7.1 Under 15
11.5.7.2 16 to 25
11.5.7.3 26 to 35
11.5.7.4 36 to 45
11.5.7.5 46 to 55
11.5.7.6 Over 55
11.5.8 Historic and Forecasted Market Size by Demographic
11.5.8.1 Male
11.5.8.2 Female
11.5.8.3 Kids
11.5.9 Historic and Forecasted Market Size by Nationality
11.5.9.1 Domestic
11.5.9.2 International
11.5.10 Historic and Forecast Market Size by Country
11.5.10.1 China
11.5.10.2 India
11.5.10.3 Japan
11.5.10.4 South Korea
11.5.10.5 Malaysia
11.5.10.6 Thailand
11.5.10.7 Vietnam
11.5.10.8 The Philippines
11.5.10.9 Australia
11.5.10.10 New Zealand
11.5.10.11 Rest of APAC
11.6. Middle East & Africa Geotourism Market
11.6.1 Key Market Trends, Growth Factors and Opportunities
11.6.2 Top Key Companies
11.6.3 Historic and Forecasted Market Size by Segments
11.6.4 Historic and Forecasted Market Size by Tourism Type
11.6.4.1 Sustainable Tourism
11.6.4.2 Urban Geo-Tourism
11.6.4.3 Rural Geo-Tourism
11.6.4.4 Natural Tourism
11.6.4.5 Eco Geo-tourism
11.6.4.6 Others
11.6.5 Historic and Forecasted Market Size by Direct Suppliers
11.6.5.1 Airlines
11.6.5.2 Hotel Companies
11.6.5.3 Car Rental
11.6.5.4 Train
11.6.5.5 Tour Operators
11.6.5.6 Government Bodies
11.6.6 Historic and Forecasted Market Size by Indirect Suppliers
11.6.6.1 Online Travel Agency (OTA)
11.6.6.2 Traditional Travel Agencies
11.6.6.3 Travel Management Companies (TMCs)
11.6.6.4 Corporate Buyers
11.6.6.5 Aggregators
11.6.7 Historic and Forecasted Market Size by Age
11.6.7.1 Under 15
11.6.7.2 16 to 25
11.6.7.3 26 to 35
11.6.7.4 36 to 45
11.6.7.5 46 to 55
11.6.7.6 Over 55
11.6.8 Historic and Forecasted Market Size by Demographic
11.6.8.1 Male
11.6.8.2 Female
11.6.8.3 Kids
11.6.9 Historic and Forecasted Market Size by Nationality
11.6.9.1 Domestic
11.6.9.2 International
11.6.10 Historic and Forecast Market Size by Country
11.6.10.1 Turkiye
11.6.10.2 Bahrain
11.6.10.3 Kuwait
11.6.10.4 Saudi Arabia
11.6.10.5 Qatar
11.6.10.6 UAE
11.6.10.7 Israel
11.6.10.8 South Africa
11.7. South America Geotourism Market
11.7.1 Key Market Trends, Growth Factors and Opportunities
11.7.2 Top Key Companies
11.7.3 Historic and Forecasted Market Size by Segments
11.7.4 Historic and Forecasted Market Size by Tourism Type
11.7.4.1 Sustainable Tourism
11.7.4.2 Urban Geo-Tourism
11.7.4.3 Rural Geo-Tourism
11.7.4.4 Natural Tourism
11.7.4.5 Eco Geo-tourism
11.7.4.6 Others
11.7.5 Historic and Forecasted Market Size by Direct Suppliers
11.7.5.1 Airlines
11.7.5.2 Hotel Companies
11.7.5.3 Car Rental
11.7.5.4 Train
11.7.5.5 Tour Operators
11.7.5.6 Government Bodies
11.7.6 Historic and Forecasted Market Size by Indirect Suppliers
11.7.6.1 Online Travel Agency (OTA)
11.7.6.2 Traditional Travel Agencies
11.7.6.3 Travel Management Companies (TMCs)
11.7.6.4 Corporate Buyers
11.7.6.5 Aggregators
11.7.7 Historic and Forecasted Market Size by Age
11.7.7.1 Under 15
11.7.7.2 16 to 25
11.7.7.3 26 to 35
11.7.7.4 36 to 45
11.7.7.5 46 to 55
11.7.7.6 Over 55
11.7.8 Historic and Forecasted Market Size by Demographic
11.7.8.1 Male
11.7.8.2 Female
11.7.8.3 Kids
11.7.9 Historic and Forecasted Market Size by Nationality
11.7.9.1 Domestic
11.7.9.2 International
11.7.10 Historic and Forecast Market Size by Country
11.7.10.1 Brazil
11.7.10.2 Argentina
11.7.10.3 Rest of SA
Chapter 12 Analyst Viewpoint and Conclusion
12.1 Recommendations and Concluding Analysis
12.2 Potential Market Strategies
Chapter 13 Research Methodology
13.1 Research Process
13.2 Primary Research
13.3 Secondary Research
|
Geotourism Market |
|||
|
Base Year: |
2023 |
Forecast Period: |
2024-2032 |
|
Historical Data: |
2017 to 2023 |
Market Size in 2023: |
USD 784.91 Bn. |
|
Forecast Period 2024-32 CAGR: |
6.50% |
Market Size in 2032: |
USD 1,299.01 Bn. |
|
Segments Covered: |
By Tourism Type |
|
|
|
By Direct Suppliers |
|
||
|
By Indirect Suppliers |
|
||
|
By Age |
|
||
|
By Demographic |
|
||
|
By Nationality |
|
||
|
By Booking Channel |
|
||
|
By Tour Type |
|
||
|
By Region |
|
||
|
Key Market Drivers: |
|
||
|
Key Market Restraints: |
|
||
|
Key Opportunities: |
|
||
|
Companies Covered in the report: |
|
||


