


Plant Milk Market Synopsis
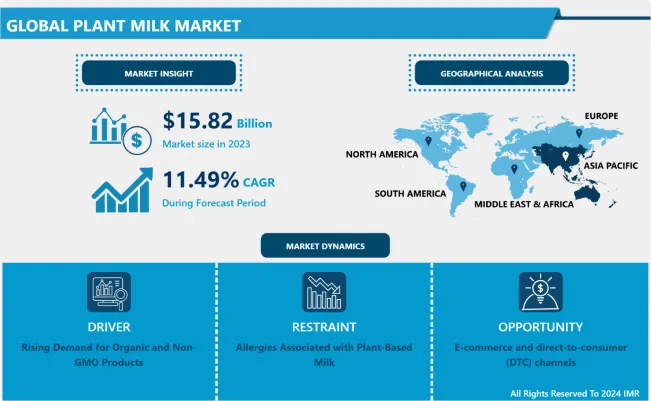
Plant Milk Market Size Was Valued at USD 17.64 Billion in 2024 and is Projected to Reach USD 42.1 Billion by 2032, Growing at a CAGR of 11.49% From 2025-2032.
The term "plant milk" describes a liquid that is derived from plants and used in the food and beverage sector. It takes the form of a juice that has the color and flavor of milk. Furthermore, known as plant-based liquid, vegan milk, nut milk, faux milk, and alternative milk. Additionally, plant-based milk is becoming more and more popular, which has spurred market expansion over the projected period. This is because plant-based milk is employed in the food and beverage industry as a milk alternative to satisfy consumers' growing demand for vegan meals.
Health-conscious consumers are drawn to plant milk options due to their perceived health benefits. Plant-based milk alternatives are often lower in saturated fat and calories compared to traditional cow's milk, making them an attractive option for those looking to manage their weight or address specific health concerns. Additionally, plant milks are free from lactose, making them suitable for individuals who are lactose intolerant.
Environmental sustainability is another significant factor propelling the growth of the plant milk market. Concerns about the environmental impact of the dairy industry, including deforestation, greenhouse gas emissions, and water usage, have led consumers to seek eco-friendly alternatives. Plant-based milk production generally has a lower environmental footprint, making it a more sustainable choice.
The market's expansion is also fueled by a surge in innovation and product development within the plant-based sector. Manufacturers are continuously introducing new and improved plant milk varieties, such as almond, soy, oat, coconut, and pea milk, to meet diverse consumer preferences and dietary needs. This variety not only caters to different taste preferences but also addresses specific nutritional requirements, further widening the consumer base.
Plant Milk Market Trend Analysis
Rising Demand for Organic and Non-GMO Products
- The rising demand for organic and non-GMO (Genetically Modified Organism) products is a prominent trend in the plant milk market, reflecting a broader shift towards healthier and more sustainable food choices. This trend is driven by a growing awareness among consumers about the impact of their dietary choices on personal health and the environment.
- Organic plant milk is produced without the use of synthetic pesticides, herbicides, and fertilizers. Consumers are increasingly drawn to organic options due to concerns about the potential health risks associated with conventional farming practices, including pesticide residues in food. Organic plant milk is perceived as a cleaner and more natural alternative, appealing to those seeking a purer and less processed product. ?
- Similarly, the demand for non-GMO plant milk has surged as consumers express a desire for transparency and control over the ingredients in their food. Genetically modified organisms are often a source of controversy, with some studies suggesting potential health and environmental risks. As a result, consumers are actively seeking products that are labeled as non-GMO, as it aligns with their preferences for natural and unmodified ingredients. ?
- The preference for organic and non-GMO plant milk is closely linked to the broader movement towards sustainable and ethical consumption. Consumers are increasingly concerned about the environmental impact of food production, and they view organic and non-GMO options as more eco-friendly choices. Supporting sustainable agricultural practices and avoiding genetically modified ingredients are seen as ways to contribute to a healthier planet.
E-commerce and direct-to-consumer (DTC) channels creates an opportunity for Plant Milk Market
- E-commerce and direct-to-consumer (DTC) channels have emerged as significant opportunities within the plant milk market, capitalizing on evolving consumer preferences, technological advancements, and changing retail landscapes. Plant milk, derived from sources such as soy, almond, oat, and coconut, has gained immense popularity as a dairy alternative due to its perceived health benefits, environmental sustainability, and ethical considerations.
- E-commerce plays a pivotal role in the growth of the plant milk market by providing a convenient and accessible platform for consumers to explore and purchase a diverse range of plant-based products. Online retailing allows consumers to browse through a plethora of options, compare brands, read reviews, and make informed choices from the comfort of their homes. The global reach of e-commerce platforms facilitates the distribution of plant milk to consumers worldwide, transcending geographical barriers and enabling niche products to find a broader audience.
- Direct-to-consumer channels, on the other hand, involve brands selling their products directly to consumers without intermediaries. This approach provides several advantages for plant milk producers. Firstly, it allows brands to establish a direct relationship with their customers, fostering brand loyalty and trust. Secondly, it provides greater control over the customer experience, from product presentation to post-purchase interactions. Thirdly, DTC models often enable companies to collect valuable consumer data, facilitating personalized marketing strategies and product development.
Plant Milk Market Segment Analysis:
Plant Milk Market Segmented on the basis of type, application, nature, and distribution channels.
By Type, Oat segment is expected to dominate the market during the forecast period
- Oat milk stands out for its creamy texture, versatility, and nutritional benefits. It is often perceived as a sustainable and environmentally friendly alternative to traditional dairy, appealing to eco-conscious consumers. Additionally, oat milk is naturally lactose-free, making it suitable for individuals with lactose intolerance. The surge in demand for plant-based options, coupled with the rising awareness of health and sustainability issues, has fueled the popularity of oat milk, leading to its robust growth within the plant milk market.
By Application, Food & Beverage Industry segment held the largest share
- The Food & Beverage Industry application segment of the Plant Milk Market is experiencing robust growth due to shifting consumer preferences towards plant-based alternatives. As health and sustainability concerns gain prominence, more individuals are opting for plant milk as a substitute for traditional dairy products. This trend is particularly evident in the food and beverage sector, where plant milk is increasingly being incorporated into various products such as dairy-free beverages, desserts, and other culinary offerings.
Plant Milk Market Regional Insights:
Asia Pacific is Expected to Dominate the Market Over the Forecast period
- Asia Pacific now holds a dominant share of the global market for plant milk, owing to factors such as a big population, a growing demand for lactose-free milk, an abundance of raw materials, and a tendency toward veganism. The post-pandemic rise of this field is also attributed to the increasing public awareness of organic and plant-based foods.
- The projected period is expected to witness growth in the number of vegans, changing dietary patterns, and fast-paced lifestyles in North America and Europe. It is anticipated that in the next years, Latin America's knowledge of organic food will rise. Low income disposal also has an impact on market expansion in the Middle East and Africa, where there is still a dearth of knowledge regarding alternatives to milk.
Plant Milk Market Top Key Players:
- HAIN CELESTIAL GROUP, INC. (U.S)
- Kaslink Foods Oy Ltd (Finland)
- Living Harvest Foods Inc. (U.S)
- Alpina Foods (U.S)
- Blue Diamond Growers, Inc. (U.S)
- Elden Foods Inc. (U.S)
- Groupe Danone (France)
- Döhler Gmbh (Germany)
- Earth’s Own Food Company Inc. (Canada)
- Freedom Foods Group Ltd (Australia)
- Goya Foods (U.S)
- Groupe Danone (Netherlands)
- Liwayway Holdings Company Limited (China)
- Mc Cormick & Co. (U.S)
- Natura Foods (U.S)
- Nutriops Sl (Spain)
- Other Active Player
Key Industry Developments in the Plant Milk Market:
- In August 2023 - Organic EDEN Barley & Brown Rice Miso was selected by Men’s Health magazine as a Best Foods for Men 2023. This is the eleventh time EDEN food items have been honored in multiple categories by Men’s Health.
- In May 2023 - Eden Foods, a natural foods company established in 1968, adds another unrefined vegetable oil to its line. EDEN Black Sesame Oil is from the first pressing of whole, raw, real organic black sesame seed. After mechanical pressing, the oil is simply cotton canvas filtered and bottled. The oil has less than 1% free fatty acid and the sweet taste characteristic of sesame. No chemicals or additives are used in organic EDEN unrefined oils.
|
Plant Milk Market |
||||
|
Base Year: |
2024 |
Forecast Period: |
2025-2032 |
|
|
Historical Data: |
2018 to 2023 |
Market Size in 2024: |
USD 17.64 Bn. |
|
|
CAGR (2024-2032) : |
11.49% |
Market Size in 2032: |
USD 42.1 Bn. |
|
|
Segments Covered: |
By Type |
|
|
|
|
By Application |
|
|
||
|
By Nature |
|
|
||
|
By Distribution Channels |
|
|
||
|
By Region |
|
|
||
|
Key Market Drivers: |
|
|||
|
Key Market Restraints: |
|
|||
|
Key Opportunities: |
|
|||
|
Companies Covered in the Report: |
|
|||
Chapter 1: Introduction
1.1 Scope and Coverage
Chapter 2:Executive Summary
Chapter 3: Market Landscape
3.1 Market Dynamics
3.1.1 Drivers
3.1.2 Restraints
3.1.3 Opportunities
3.1.4 Challenges
3.2 Market Trend Analysis
3.3 PESTLE Analysis
3.4 Porter's Five Forces Analysis
3.5 Industry Value Chain Analysis
3.6 Ecosystem
3.7 Regulatory Landscape
3.8 Price Trend Analysis
3.9 Patent Analysis
3.10 Technology Evolution
3.11 Investment Pockets
3.12 Import-Export Analysis
Chapter 4: Plant Milk Market by Type (2018-2032)
4.1 Plant Milk Market Snapshot and Growth Engine
4.2 Market Overview
4.3 Coconut
4.3.1 Introduction and Market Overview
4.3.2 Historic and Forecasted Market Size in Value USD and Volume Units
4.3.3 Key Market Trends, Growth Factors, and Opportunities
4.3.4 Geographic Segmentation Analysis
4.4 Soy
4.5 Almond
4.6 Rice
4.7 Oat
4.8 Others
Chapter 5: Plant Milk Market by Application (2018-2032)
5.1 Plant Milk Market Snapshot and Growth Engine
5.2 Market Overview
5.3 Food & Beverage Industry
5.3.1 Introduction and Market Overview
5.3.2 Historic and Forecasted Market Size in Value USD and Volume Units
5.3.3 Key Market Trends, Growth Factors, and Opportunities
5.3.4 Geographic Segmentation Analysis
5.4 Household
5.5 Hotels and Restaurants
5.6 Others
Chapter 6: Plant Milk Market by Nature (2018-2032)
6.1 Plant Milk Market Snapshot and Growth Engine
6.2 Market Overview
6.3 Organic
6.3.1 Introduction and Market Overview
6.3.2 Historic and Forecasted Market Size in Value USD and Volume Units
6.3.3 Key Market Trends, Growth Factors, and Opportunities
6.3.4 Geographic Segmentation Analysis
6.4 Conventional
Chapter 7: Plant Milk Market by Distribution Channels (2018-2032)
7.1 Plant Milk Market Snapshot and Growth Engine
7.2 Market Overview
7.3 Specialty Store
7.3.1 Introduction and Market Overview
7.3.2 Historic and Forecasted Market Size in Value USD and Volume Units
7.3.3 Key Market Trends, Growth Factors, and Opportunities
7.3.4 Geographic Segmentation Analysis
7.4 Supermarket/Hypermarket
7.5 Online
7.6 Others
Chapter 8: Company Profiles and Competitive Analysis
8.1 Competitive Landscape
8.1.1 Competitive Benchmarking
8.1.2 Plant Milk Market Share by Manufacturer (2024)
8.1.3 Industry BCG Matrix
8.1.4 Heat Map Analysis
8.1.5 Mergers and Acquisitions
8.2 CARGILL INCORPORATED (US)
8.2.1 Company Overview
8.2.2 Key Executives
8.2.3 Company Snapshot
8.2.4 Role of the Company in the Market
8.2.5 Sustainability and Social Responsibility
8.2.6 Operating Business Segments
8.2.7 Product Portfolio
8.2.8 Business Performance
8.2.9 Key Strategic Moves and Recent Developments
8.2.10 SWOT Analysis
8.3 ADM (ARCHER DANIELS MIDLAND
8.4 US)
8.5 PHIBRO ANIMAL HEALTH CORPORATION (US)
8.6 NOVUS INTERNATIONAL INC. (US)
8.7 PURINA ANIMAL NUTRITION LLC (US)
8.8 KEMIN INDUSTRIES INC. (US)
8.9 KENT NUTRITION GROUP (US)
8.10 ALLTECH (US)
8.11 LAND O'LAKES (US)
8.12 TYSON FOODS (US)
8.13 BASF SE (GERMANY)
8.14 EVONIK INDUSTRIES AG (GERMANY)
8.15 VETSFARMA LTD. (UK)
8.16 NUTRECO (NETHERLANDS)
8.17 DE HEUS ANIMAL NUTRITION (NETHERLANDS)
8.18 DSM (NETHERLANDS)
8.19 YARA (NORWAY)
8.20 PERSTORP (SWEDEN)
8.21 NUTREX.EU (BELGIUM)
8.22 HENRAAJH FEEDS INDIA PVT. LTD. (INDIA)
8.23 NEW HOPE GROUP (CHINA)
8.24 GUANGXI YANGXIANG COLTD. (CHINA)
8.25 WESTON STOCKFEED NEW ZEALAND (NEW ZEALAND)
8.26 JAPFA LTD (INDONESIA)
8.27 CHAROEN POKPHAND FOODS PCL (THAILAND)
8.28
Chapter 9: Global Plant Milk Market By Region
9.1 Overview
9.2. North America Plant Milk Market
9.2.1 Key Market Trends, Growth Factors and Opportunities
9.2.2 Top Key Companies
9.2.3 Historic and Forecasted Market Size by Segments
9.2.4 Historic and Forecasted Market Size by Type
9.2.4.1 Coconut
9.2.4.2 Soy
9.2.4.3 Almond
9.2.4.4 Rice
9.2.4.5 Oat
9.2.4.6 Others
9.2.5 Historic and Forecasted Market Size by Application
9.2.5.1 Food & Beverage Industry
9.2.5.2 Household
9.2.5.3 Hotels and Restaurants
9.2.5.4 Others
9.2.6 Historic and Forecasted Market Size by Nature
9.2.6.1 Organic
9.2.6.2 Conventional
9.2.7 Historic and Forecasted Market Size by Distribution Channels
9.2.7.1 Specialty Store
9.2.7.2 Supermarket/Hypermarket
9.2.7.3 Online
9.2.7.4 Others
9.2.8 Historic and Forecast Market Size by Country
9.2.8.1 US
9.2.8.2 Canada
9.2.8.3 Mexico
9.3. Eastern Europe Plant Milk Market
9.3.1 Key Market Trends, Growth Factors and Opportunities
9.3.2 Top Key Companies
9.3.3 Historic and Forecasted Market Size by Segments
9.3.4 Historic and Forecasted Market Size by Type
9.3.4.1 Coconut
9.3.4.2 Soy
9.3.4.3 Almond
9.3.4.4 Rice
9.3.4.5 Oat
9.3.4.6 Others
9.3.5 Historic and Forecasted Market Size by Application
9.3.5.1 Food & Beverage Industry
9.3.5.2 Household
9.3.5.3 Hotels and Restaurants
9.3.5.4 Others
9.3.6 Historic and Forecasted Market Size by Nature
9.3.6.1 Organic
9.3.6.2 Conventional
9.3.7 Historic and Forecasted Market Size by Distribution Channels
9.3.7.1 Specialty Store
9.3.7.2 Supermarket/Hypermarket
9.3.7.3 Online
9.3.7.4 Others
9.3.8 Historic and Forecast Market Size by Country
9.3.8.1 Russia
9.3.8.2 Bulgaria
9.3.8.3 The Czech Republic
9.3.8.4 Hungary
9.3.8.5 Poland
9.3.8.6 Romania
9.3.8.7 Rest of Eastern Europe
9.4. Western Europe Plant Milk Market
9.4.1 Key Market Trends, Growth Factors and Opportunities
9.4.2 Top Key Companies
9.4.3 Historic and Forecasted Market Size by Segments
9.4.4 Historic and Forecasted Market Size by Type
9.4.4.1 Coconut
9.4.4.2 Soy
9.4.4.3 Almond
9.4.4.4 Rice
9.4.4.5 Oat
9.4.4.6 Others
9.4.5 Historic and Forecasted Market Size by Application
9.4.5.1 Food & Beverage Industry
9.4.5.2 Household
9.4.5.3 Hotels and Restaurants
9.4.5.4 Others
9.4.6 Historic and Forecasted Market Size by Nature
9.4.6.1 Organic
9.4.6.2 Conventional
9.4.7 Historic and Forecasted Market Size by Distribution Channels
9.4.7.1 Specialty Store
9.4.7.2 Supermarket/Hypermarket
9.4.7.3 Online
9.4.7.4 Others
9.4.8 Historic and Forecast Market Size by Country
9.4.8.1 Germany
9.4.8.2 UK
9.4.8.3 France
9.4.8.4 The Netherlands
9.4.8.5 Italy
9.4.8.6 Spain
9.4.8.7 Rest of Western Europe
9.5. Asia Pacific Plant Milk Market
9.5.1 Key Market Trends, Growth Factors and Opportunities
9.5.2 Top Key Companies
9.5.3 Historic and Forecasted Market Size by Segments
9.5.4 Historic and Forecasted Market Size by Type
9.5.4.1 Coconut
9.5.4.2 Soy
9.5.4.3 Almond
9.5.4.4 Rice
9.5.4.5 Oat
9.5.4.6 Others
9.5.5 Historic and Forecasted Market Size by Application
9.5.5.1 Food & Beverage Industry
9.5.5.2 Household
9.5.5.3 Hotels and Restaurants
9.5.5.4 Others
9.5.6 Historic and Forecasted Market Size by Nature
9.5.6.1 Organic
9.5.6.2 Conventional
9.5.7 Historic and Forecasted Market Size by Distribution Channels
9.5.7.1 Specialty Store
9.5.7.2 Supermarket/Hypermarket
9.5.7.3 Online
9.5.7.4 Others
9.5.8 Historic and Forecast Market Size by Country
9.5.8.1 China
9.5.8.2 India
9.5.8.3 Japan
9.5.8.4 South Korea
9.5.8.5 Malaysia
9.5.8.6 Thailand
9.5.8.7 Vietnam
9.5.8.8 The Philippines
9.5.8.9 Australia
9.5.8.10 New Zealand
9.5.8.11 Rest of APAC
9.6. Middle East & Africa Plant Milk Market
9.6.1 Key Market Trends, Growth Factors and Opportunities
9.6.2 Top Key Companies
9.6.3 Historic and Forecasted Market Size by Segments
9.6.4 Historic and Forecasted Market Size by Type
9.6.4.1 Coconut
9.6.4.2 Soy
9.6.4.3 Almond
9.6.4.4 Rice
9.6.4.5 Oat
9.6.4.6 Others
9.6.5 Historic and Forecasted Market Size by Application
9.6.5.1 Food & Beverage Industry
9.6.5.2 Household
9.6.5.3 Hotels and Restaurants
9.6.5.4 Others
9.6.6 Historic and Forecasted Market Size by Nature
9.6.6.1 Organic
9.6.6.2 Conventional
9.6.7 Historic and Forecasted Market Size by Distribution Channels
9.6.7.1 Specialty Store
9.6.7.2 Supermarket/Hypermarket
9.6.7.3 Online
9.6.7.4 Others
9.6.8 Historic and Forecast Market Size by Country
9.6.8.1 Turkiye
9.6.8.2 Bahrain
9.6.8.3 Kuwait
9.6.8.4 Saudi Arabia
9.6.8.5 Qatar
9.6.8.6 UAE
9.6.8.7 Israel
9.6.8.8 South Africa
9.7. South America Plant Milk Market
9.7.1 Key Market Trends, Growth Factors and Opportunities
9.7.2 Top Key Companies
9.7.3 Historic and Forecasted Market Size by Segments
9.7.4 Historic and Forecasted Market Size by Type
9.7.4.1 Coconut
9.7.4.2 Soy
9.7.4.3 Almond
9.7.4.4 Rice
9.7.4.5 Oat
9.7.4.6 Others
9.7.5 Historic and Forecasted Market Size by Application
9.7.5.1 Food & Beverage Industry
9.7.5.2 Household
9.7.5.3 Hotels and Restaurants
9.7.5.4 Others
9.7.6 Historic and Forecasted Market Size by Nature
9.7.6.1 Organic
9.7.6.2 Conventional
9.7.7 Historic and Forecasted Market Size by Distribution Channels
9.7.7.1 Specialty Store
9.7.7.2 Supermarket/Hypermarket
9.7.7.3 Online
9.7.7.4 Others
9.7.8 Historic and Forecast Market Size by Country
9.7.8.1 Brazil
9.7.8.2 Argentina
9.7.8.3 Rest of SA
Chapter 10 Analyst Viewpoint and Conclusion
10.1 Recommendations and Concluding Analysis
10.2 Potential Market Strategies
Chapter 11 Research Methodology
11.1 Research Process
11.2 Primary Research
11.3 Secondary Research
|
Plant Milk Market |
||||
|
Base Year: |
2024 |
Forecast Period: |
2025-2032 |
|
|
Historical Data: |
2018 to 2023 |
Market Size in 2024: |
USD 17.64 Bn. |
|
|
CAGR (2024-2032) : |
11.49% |
Market Size in 2032: |
USD 42.1 Bn. |
|
|
Segments Covered: |
By Type |
|
|
|
|
By Application |
|
|
||
|
By Nature |
|
|
||
|
By Distribution Channels |
|
|
||
|
By Region |
|
|
||
|
Key Market Drivers: |
|
|||
|
Key Market Restraints: |
|
|||
|
Key Opportunities: |
|
|||
|
Companies Covered in the Report: |
|
|||


