


Global Functional Food Market Overview
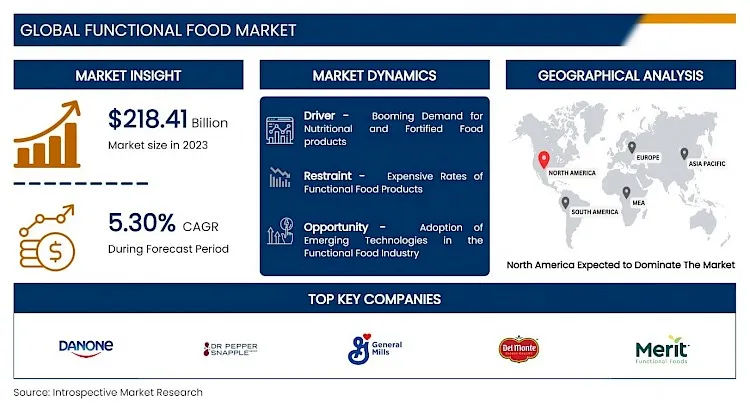
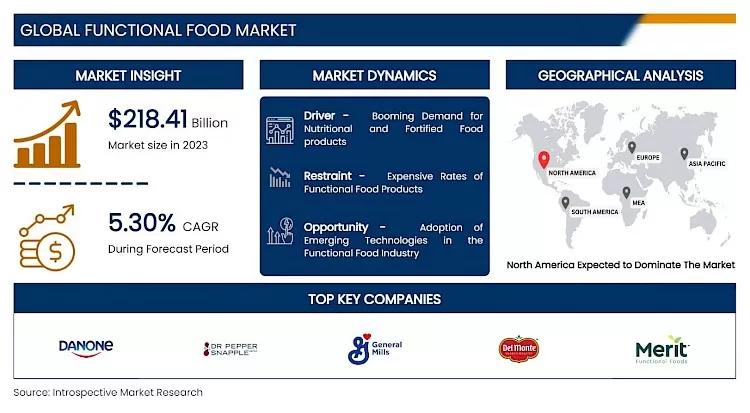
The Global Functional Food Market was estimated at USD 218.41 Billion in 2023 and is projected to reach USD 347.64 Billion by 2032, growing at a CAGR of 5.30% over the analysis period.
The global functional food market is experiencing robust growth, driven by the increasing health consciousness among consumers. These foods, fortified with additional nutrients beyond basic nutrition, offer a range of health benefits such as improved digestion, immunity, and heart health. The market encompasses a vast array of products, from fortified dairy to plant-based alternatives. With a growing emphasis on preventive healthcare and wellness, the demand for functional foods is expected to surge, creating lucrative opportunities for food manufacturers and retailers alike.
Key factors propelling market expansion include the rising prevalence of chronic diseases, aging populations, and the growing inclination towards natural and organic products. As consumer preferences evolve, the industry is witnessing continuous innovation in product development, with a focus on clean labels, taste, and convenience.
Market Dynamics And Factors For Functional Food Market
Drivers:
Rising Demand for Nutritional and Fortified Food products
In the recent years, population around several developing economies have changed their eating habits, dietary pattern and purchasing behavior owing to the rising chronic and lifestyle diseases. Increasing stress levels and hectic lifestyle have contributed to such occurrence of health diseases. This led to a drastic change in eating habits, and the replacement of meals with healthy snacking options such as protein bars and nutritional biscuits. Also, the on-going trend of consuming protein rich food products as it is considered anti-sugar, anti-fat, and a source of instant energy, will support the expansion of the market. Furthermore, to improve nutrition and add health benefits, fortified food products are high in demand. This can be attributed to the busy lifestyle and trends, where people tend to consume foods such as breakfast cereals, eggs, bread, soy milk, yogurt, juices and others. The health-conscious population all across the globe seek for meals low in carbohydrate and high in protein in order to improve their digestive health and maintain a healthy body weight. Owing to rising instances of chronic diseases and micronutrient deficiencies, there is a rapidly increasing demand for fortified and nutrition-rich food among the population thereby, driving the development of the functional food market over the estimated period.
Restraints:
Functional Food Products Are Expensive
The commerce and product development aspects of functional food ingredients are expensive, and uncertain. Functional food products and diets are high-priced as compared to regular meals as proper R&D of a strain that is to be used for the production of functional ingredients is required. Also, a substantial investment to carry out significant R&D for probiotics and prebiotics is important. The development of new product or probiotic strains need highly sterilized and technical equipment, and are produced under international food regulations. Owing to the high cost for production and manufacturing, the price of final product is also high. Further, effective marketing and distribution prices add to the final product. Despite the fact that the functional food provides high nutrition, their high prices are likely to limit or restrict consumers from buying the product; thereby hampering the growth of the functional food market over the analysis period.
Opportunities:
Adoption of Emerging Technologies in the Functional Food Industry
The introduction and adoption of emerging technologies such as high-hydrostatic pressure, encapsulation, radio-frequency drying, ultrasound-assisted and microwave-assisted extraction and bio-encapsulation drives the growth of technological innovations in the functional food ingredients industry. In addition, the newly adopted technologies such as pulsed electric field and high voltage electrical discharge supported the growth in development of functional ingredient. Further, for the overall simplification of process and fast growth, adoption of new technologies can be a lucrative opportunity. For instance, omega-3 fatty acids possess bad odour. Thus, the fragrance and taste of these ingredients are enhanced by using encapsulation technology. Also, adoption of technologies that are still under development such as nanoencapsulation and cold plasma treatment can be a major growth opportunity for functional food market in the upcoming years.
Segmentation Analysis Of Functional Food Market
By Ingredient, the carotenoids segment is expected to have the highest share of the functional food market in the analysis period. Carotenoids act as photoprotective agents and as light-harvesting pigments. Carotenoids are also essential in reducing the risk of several ailments, oxidative stress and eye-related disorders. Also, carotenoid-rich food products reduce the incidences of cancers, cardiovascular diseases and disorders related to low immune system. Owing to such health benefits, this segment is expected to grow rapidly in the upcoming years.
By Product, the dairy product segment holds the largest market share. The increasing consumer inclination towards aiding digestive health has influenced the market growth of probiotics and prebiotics dairy products. Additionally, increasing spending on healthy and cost-effective dairy products such as yogurt is most likely to drive the growth of dairy product segment.
By Application, the cardio health segment is estimated to dominate the functional food market. Owing to the rising demand for functional food in cardiovascular diseases, congestive heart failure, hardening of arteries as well as congenital heart defects, the segment will witness a rapid growth. Further, digestive health segment is also expected to witness a significant growth in the upcoming years due to great interest among women population during the course of their reproductive life along with men particularly after 40 years of age, to maintain a health digestive system.
Regional Analysis Of Functional Food Market
North America, primarily the United States, has historically been the dominant region in the global functional food market. The region boasts a mature market with well-established consumer awareness about the benefits of functional foods. Factors such as high disposable income, a prevalence of chronic diseases, and a strong focus on preventive healthcare have contributed to the region's leadership. Moreover, the presence of key market players and robust research and development activities have solidified North America's position as a global frontrunner in the functional food industry.
It's important to remember, though, that the Asia Pacific area is becoming a formidable competitor. The functional food market is expanding quickly in nations like China, India, and Japan as a result of shifting dietary preferences, growing disposable incomes, and growing health concerns. In the upcoming years, this region is anticipated to pose a threat to North America's dominance.
Top Key Players Covered In Functional Food Market
- Merit Functional Foods(Winnipeg)
- Danone SA (France)
- Del Monte Pacific Limited (DMPL) (Singapore)
- Dr Pepper Snapple Group, Inc. (USA)
- General Mills, Inc. (USA)
- Glanbia Nutritionals Limited (UK)
- MaxiNutrition (UK)
- GNC Holdings, Inc. (USA)
- Hangzhou Wahaha Group Co., Ltd. (China)
- Herbalife International, Inc. (USA)
- Kellogg Company (USA)
- Meiji Holdings Co., Ltd. (Japan)
- Natural Products, Inc. (USA)
- Nestle Nutrition (Switzerland), and other major players.
Key Industry Development In The Functional Food Market
In June 2023, Nestlé announced a new line of plant-based protein powders under its Garden of Life brand. The powders are made with a blend of pea, rice, and hemp protein and are designed to help people meet their protein needs in a convenient and delicious way.
In June 2023, Danone acquired White Rabbit, a Chinese dairy company that is known for its probiotic yogurt. The acquisition is part of Danone's strategy to expand its presence in China, the world's largest dairy market.
In July 2023, Kellogg Company announced plans to invest $50 million in a new research and development center focused on functional foods. The center will be located in Battle Creek, Michigan, and will focus on developing new products that address the growing consumer demand for healthier and more convenient foods.
|
Global Functional Food Market |
|||
|
Base Year: |
2024 |
Forecast Period: |
2024-2032 |
|
Historical Data: |
2017 to 2023 |
Market Size in 2023: |
USD 218.41 Bn. |
|
Forecast Period 2024-32 CAGR: |
5.30% |
Market Size in 2032: |
USD 347.64 Bn. |
|
Segments Covered: |
By Ingredient |
|
|
|
By Product |
|
||
|
By Application |
|
||
|
By Region |
|
||
|
Key Market Drivers: |
|
||
|
Key Market Restraints: |
|
||
|
Key Opportunities: |
|
||
|
Companies Covered in the report: |
|
||
1.1 Scope and Coverage
Chapter 2:Executive Summary
Chapter 3: Market Landscape
3.1 Market Dynamics
3.1.1 Drivers
3.1.2 Restraints
3.1.3 Opportunities
3.1.4 Challenges
3.2 Market Trend Analysis
3.3 PESTLE Analysis
3.4 Porter's Five Forces Analysis
3.5 Industry Value Chain Analysis
3.6 Ecosystem
3.7 Regulatory Landscape
3.8 Price Trend Analysis
3.9 Patent Analysis
3.10 Technology Evolution
3.11 Investment Pockets
3.12 Import-Export Analysis
Chapter 4: Functional Food Market by Ingredient (2018-2032)
4.1 Functional Food Market Snapshot and Growth Engine
4.2 Market Overview
4.3 Probiotics
4.3.1 Introduction and Market Overview
4.3.2 Historic and Forecasted Market Size in Value USD and Volume Units
4.3.3 Key Market Trends, Growth Factors, and Opportunities
4.3.4 Geographic Segmentation Analysis
4.4 Carotenoids
4.5 Minerals
4.6 Proteins & Amino Acids
4.7 Vitamins
4.8 Others
Chapter 5: Functional Food Market by Product (2018-2032)
5.1 Functional Food Market Snapshot and Growth Engine
5.2 Market Overview
5.3 Bakery
5.3.1 Introduction and Market Overview
5.3.2 Historic and Forecasted Market Size in Value USD and Volume Units
5.3.3 Key Market Trends, Growth Factors, and Opportunities
5.3.4 Geographic Segmentation Analysis
5.4 Cereals
5.5 Dairy Products
5.6 Meat
5.7 Fish
5.8 Others
Chapter 6: Functional Food Market by Application (2018-2032)
6.1 Functional Food Market Snapshot and Growth Engine
6.2 Market Overview
6.3 Sports Nutrition
6.3.1 Introduction and Market Overview
6.3.2 Historic and Forecasted Market Size in Value USD and Volume Units
6.3.3 Key Market Trends, Growth Factors, and Opportunities
6.3.4 Geographic Segmentation Analysis
6.4 Weight Management
6.5 Clinical Nutrition
6.6 Cardio Health
Chapter 7: Company Profiles and Competitive Analysis
7.1 Competitive Landscape
7.1.1 Competitive Benchmarking
7.1.2 Functional Food Market Share by Manufacturer (2024)
7.1.3 Industry BCG Matrix
7.1.4 Heat Map Analysis
7.1.5 Mergers and Acquisitions
7.2 RISHI TEA (UNITED STATES)
7.2.1 Company Overview
7.2.2 Key Executives
7.2.3 Company Snapshot
7.2.4 Role of the Company in the Market
7.2.5 Sustainability and Social Responsibility
7.2.6 Operating Business Segments
7.2.7 Product Portfolio
7.2.8 Business Performance
7.2.9 Key Strategic Moves and Recent Developments
7.2.10 SWOT Analysis
7.3 NUMI ORGANIC TEA (UNITED STATES)
7.4 STASH TEA (UNITED STATES)
7.5 REPUBLIC OF TEA (UNITED STATES)
7.6 HARNEY & SONS (UNITED STATES)
7.7 CELESTIAL SEASONINGS (UNITED STATES)
7.8 PEPSICO (UNITED STATES)
7.9 COCA-COLA COMPANY (UNITED STATES)
7.10 NESTLÉ(SWITZERLAND)
7.11 UNILEVER (UNITED KINGDOM)
7.12 JAMES FINLAY (UNITED KINGDOM)
7.13 TWININGS (UNITED KINGDOM)
7.14 TWININGS OF LONDON (UNITED KINGDOM)
7.15 TETLEY (UNITED KINGDOM)
7.16 YORKSHIRE TEA (UNITED KINGDOM)
7.17 TYPHOO (UNITED KINGDOM)
7.18 ASSOCIATED BRITISH FOODS (UNITED KINGDOM)
7.19 ITO EN (JAPAN)
7.20 KIRIN HOLDINGS (JAPAN)
7.21 SUNTORY BEVERAGE & FOOD (JAPAN)
7.22 TATA GLOBAL BEVERAGES (INDIA)
7.23 DILMAH (SRI LANKA)
7.24 YUTAKA (JAPAN)
7.25 OSULLOC (SOUTH KOREA)
7.26 TEN REN'S TEA (TAIWAN)
Chapter 8: Global Functional Food Market By Region
8.1 Overview
8.2. North America Functional Food Market
8.2.1 Key Market Trends, Growth Factors and Opportunities
8.2.2 Top Key Companies
8.2.3 Historic and Forecasted Market Size by Segments
8.2.4 Historic and Forecasted Market Size by Ingredient
8.2.4.1 Probiotics
8.2.4.2 Carotenoids
8.2.4.3 Minerals
8.2.4.4 Proteins & Amino Acids
8.2.4.5 Vitamins
8.2.4.6 Others
8.2.5 Historic and Forecasted Market Size by Product
8.2.5.1 Bakery
8.2.5.2 Cereals
8.2.5.3 Dairy Products
8.2.5.4 Meat
8.2.5.5 Fish
8.2.5.6 Others
8.2.6 Historic and Forecasted Market Size by Application
8.2.6.1 Sports Nutrition
8.2.6.2 Weight Management
8.2.6.3 Clinical Nutrition
8.2.6.4 Cardio Health
8.2.7 Historic and Forecast Market Size by Country
8.2.7.1 US
8.2.7.2 Canada
8.2.7.3 Mexico
8.3. Eastern Europe Functional Food Market
8.3.1 Key Market Trends, Growth Factors and Opportunities
8.3.2 Top Key Companies
8.3.3 Historic and Forecasted Market Size by Segments
8.3.4 Historic and Forecasted Market Size by Ingredient
8.3.4.1 Probiotics
8.3.4.2 Carotenoids
8.3.4.3 Minerals
8.3.4.4 Proteins & Amino Acids
8.3.4.5 Vitamins
8.3.4.6 Others
8.3.5 Historic and Forecasted Market Size by Product
8.3.5.1 Bakery
8.3.5.2 Cereals
8.3.5.3 Dairy Products
8.3.5.4 Meat
8.3.5.5 Fish
8.3.5.6 Others
8.3.6 Historic and Forecasted Market Size by Application
8.3.6.1 Sports Nutrition
8.3.6.2 Weight Management
8.3.6.3 Clinical Nutrition
8.3.6.4 Cardio Health
8.3.7 Historic and Forecast Market Size by Country
8.3.7.1 Russia
8.3.7.2 Bulgaria
8.3.7.3 The Czech Republic
8.3.7.4 Hungary
8.3.7.5 Poland
8.3.7.6 Romania
8.3.7.7 Rest of Eastern Europe
8.4. Western Europe Functional Food Market
8.4.1 Key Market Trends, Growth Factors and Opportunities
8.4.2 Top Key Companies
8.4.3 Historic and Forecasted Market Size by Segments
8.4.4 Historic and Forecasted Market Size by Ingredient
8.4.4.1 Probiotics
8.4.4.2 Carotenoids
8.4.4.3 Minerals
8.4.4.4 Proteins & Amino Acids
8.4.4.5 Vitamins
8.4.4.6 Others
8.4.5 Historic and Forecasted Market Size by Product
8.4.5.1 Bakery
8.4.5.2 Cereals
8.4.5.3 Dairy Products
8.4.5.4 Meat
8.4.5.5 Fish
8.4.5.6 Others
8.4.6 Historic and Forecasted Market Size by Application
8.4.6.1 Sports Nutrition
8.4.6.2 Weight Management
8.4.6.3 Clinical Nutrition
8.4.6.4 Cardio Health
8.4.7 Historic and Forecast Market Size by Country
8.4.7.1 Germany
8.4.7.2 UK
8.4.7.3 France
8.4.7.4 The Netherlands
8.4.7.5 Italy
8.4.7.6 Spain
8.4.7.7 Rest of Western Europe
8.5. Asia Pacific Functional Food Market
8.5.1 Key Market Trends, Growth Factors and Opportunities
8.5.2 Top Key Companies
8.5.3 Historic and Forecasted Market Size by Segments
8.5.4 Historic and Forecasted Market Size by Ingredient
8.5.4.1 Probiotics
8.5.4.2 Carotenoids
8.5.4.3 Minerals
8.5.4.4 Proteins & Amino Acids
8.5.4.5 Vitamins
8.5.4.6 Others
8.5.5 Historic and Forecasted Market Size by Product
8.5.5.1 Bakery
8.5.5.2 Cereals
8.5.5.3 Dairy Products
8.5.5.4 Meat
8.5.5.5 Fish
8.5.5.6 Others
8.5.6 Historic and Forecasted Market Size by Application
8.5.6.1 Sports Nutrition
8.5.6.2 Weight Management
8.5.6.3 Clinical Nutrition
8.5.6.4 Cardio Health
8.5.7 Historic and Forecast Market Size by Country
8.5.7.1 China
8.5.7.2 India
8.5.7.3 Japan
8.5.7.4 South Korea
8.5.7.5 Malaysia
8.5.7.6 Thailand
8.5.7.7 Vietnam
8.5.7.8 The Philippines
8.5.7.9 Australia
8.5.7.10 New Zealand
8.5.7.11 Rest of APAC
8.6. Middle East & Africa Functional Food Market
8.6.1 Key Market Trends, Growth Factors and Opportunities
8.6.2 Top Key Companies
8.6.3 Historic and Forecasted Market Size by Segments
8.6.4 Historic and Forecasted Market Size by Ingredient
8.6.4.1 Probiotics
8.6.4.2 Carotenoids
8.6.4.3 Minerals
8.6.4.4 Proteins & Amino Acids
8.6.4.5 Vitamins
8.6.4.6 Others
8.6.5 Historic and Forecasted Market Size by Product
8.6.5.1 Bakery
8.6.5.2 Cereals
8.6.5.3 Dairy Products
8.6.5.4 Meat
8.6.5.5 Fish
8.6.5.6 Others
8.6.6 Historic and Forecasted Market Size by Application
8.6.6.1 Sports Nutrition
8.6.6.2 Weight Management
8.6.6.3 Clinical Nutrition
8.6.6.4 Cardio Health
8.6.7 Historic and Forecast Market Size by Country
8.6.7.1 Turkiye
8.6.7.2 Bahrain
8.6.7.3 Kuwait
8.6.7.4 Saudi Arabia
8.6.7.5 Qatar
8.6.7.6 UAE
8.6.7.7 Israel
8.6.7.8 South Africa
8.7. South America Functional Food Market
8.7.1 Key Market Trends, Growth Factors and Opportunities
8.7.2 Top Key Companies
8.7.3 Historic and Forecasted Market Size by Segments
8.7.4 Historic and Forecasted Market Size by Ingredient
8.7.4.1 Probiotics
8.7.4.2 Carotenoids
8.7.4.3 Minerals
8.7.4.4 Proteins & Amino Acids
8.7.4.5 Vitamins
8.7.4.6 Others
8.7.5 Historic and Forecasted Market Size by Product
8.7.5.1 Bakery
8.7.5.2 Cereals
8.7.5.3 Dairy Products
8.7.5.4 Meat
8.7.5.5 Fish
8.7.5.6 Others
8.7.6 Historic and Forecasted Market Size by Application
8.7.6.1 Sports Nutrition
8.7.6.2 Weight Management
8.7.6.3 Clinical Nutrition
8.7.6.4 Cardio Health
8.7.7 Historic and Forecast Market Size by Country
8.7.7.1 Brazil
8.7.7.2 Argentina
8.7.7.3 Rest of SA
Chapter 9 Analyst Viewpoint and Conclusion
9.1 Recommendations and Concluding Analysis
9.2 Potential Market Strategies
Chapter 10 Research Methodology
10.1 Research Process
10.2 Primary Research
10.3 Secondary Research
|
Global Functional Food Market |
|||
|
Base Year: |
2024 |
Forecast Period: |
2024-2032 |
|
Historical Data: |
2017 to 2023 |
Market Size in 2023: |
USD 218.41 Bn. |
|
Forecast Period 2024-32 CAGR: |
5.30% |
Market Size in 2032: |
USD 347.64 Bn. |
|
Segments Covered: |
By Ingredient |
|
|
|
By Product |
|
||
|
By Application |
|
||
|
By Region |
|
||
|
Key Market Drivers: |
|
||
|
Key Market Restraints: |
|
||
|
Key Opportunities: |
|
||
|
Companies Covered in the report: |
|
||
Frequently Asked Questions :
The forecast period in the Functional Food Market research report is 2023-2030.
Merit Functional Foods (Winnipeg), Danone SA (France), Del Monte Pacific Limited (DMPL) (Singapore), Dr Pepper Snapple Group, Inc. (USA), General Mills, Inc. (USA), Glanbia Nutritionals Limited (UK), MaxiNutrition (UK), GNC Holdings Inc. (USA), Hangzhou Wahaha Group Co., Ltd. (China), Herbalife International, Inc. (USA), Kellogg Company (USA), Meiji Holdings Co., Ltd. (Japan), Natural Products, Inc. (USA), Nestle Nutrition (Switzerland), and other major players.
The Functional Food Market is segmented into Ingredients, Products, Applications and region. By Ingredients, the market is categorized into Probiotics, Carotenoids, Minerals, Proteins & Amino Acids, Prebiotics, Dietary Fibers, Vitamins. By Product, the market is categorized into Bakery, Cereals, Dairy Products, Meat, Fish, Eggs, Soy Products, Fats, Oils. By Application, the market is categorized into Sports Nutrition, Weight Management Clinical Nutrition, Cardio Health. By region, it is analyzed across North America (U.S.; Canada; Mexico), Europe (Germany; U.K.; France; Italy; Russia; Spain, etc.), Asia-Pacific (China; India; Japan; Southeast Asia, etc.), South America (Brazil; Argentina, etc.), Middle East & Africa (Saudi Arabia; South Africa, etc.).
Functional foods are type of foods that offer health benefits and additional nutritional value to the human body, thereby driving the growth of functional food market.
The Global Functional Food Market was estimated at USD 218.41 Billion in 2023 and is projected to reach USD 347.64 Billion by 2032, growing at a CAGR of 5.30% over the analysis period.


