


Canned Food Market Overview
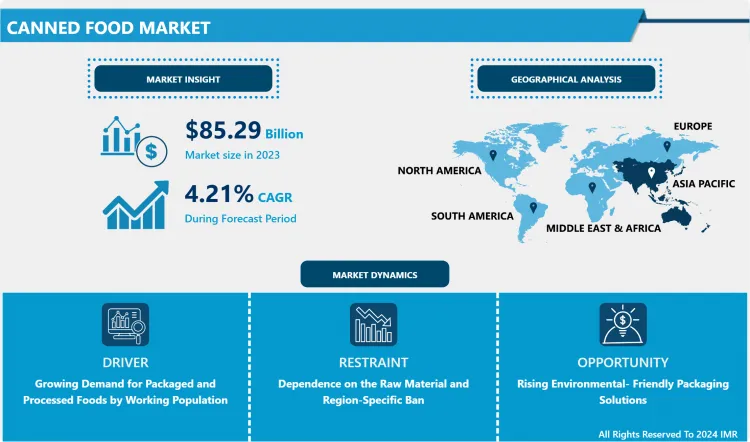
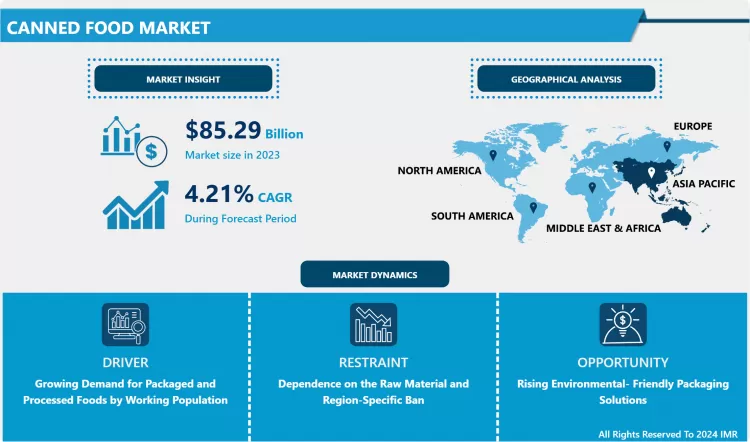
The Global Canned Food Market Size Was Valued at USD 85.29 Billion in 2023 and is Projected to Reach USD 123.62 Billion by 2032, Growing at a CAGR of 4.21% From 2024-2032.
- Canning is a method of preserving foods for longer period of time by packing them in different airtight containers. The canned food serves enriched nutrients to the health-conscious consumers. The market is mainly driven by the rising urban population that prefers healthy food rich in protein, fibers, vitamins, and omega-3 fatty acids. Consumers who are ready to spend a little more for the small, easy, ready-to-cook meat and seafood as well as organic canned fruits and vegetables are thus boosting the market sales. The rise in the trend of busy life and working population especially among millennials, consumer inclination toward the consumption of convenience food products has increased rapidly during the recent years. Due to retention of high amount of nutrients, color and flavor, canned foods have become one of the most preferred choices of preserved foods among consumers. The growing number of food retail outlets with increasing urbanization, R&D and marketing strategies used by the players in the canned food market is expected to have a positive effect for the Canned Food Market growth in the projected years.
Market Dynamics And Factors For Canned Food Market
Drivers:
Growing Demand for Packaged and Processed Foods by Working Population
- Growing number of working women has thereby increased the dependency of consumers on the easily available ready meals and convenience foods. This has led to the drastic growth in demand for nutritious and shelf stable packaged and processed food, which ultimately fuels growth of the canned food market. Furthermore, rapid surge in number of large retail platforms worldwide, including supermarkets or hypermarkets and e-commerce channels, cushions the demand for canned food products. Also, some of the canned food products contain more vitamins and minerals, as compared to the fresh products which thereby leads to rise in demand for processed foods. Such processed and packaged products have longer shelf lives and are also ready to eat as well as easy to use while meal preparation. The rise in the number of working populations especially in the developed urban area is increasing the dependency of the consumers on convenient and easy to use ready meals which leading to an increase in the demand for canned food market in the projected years.
Restraints:
Dependence on The Raw Material and Region-Specific Ban
- Canned food market is continuously attaining a height in the global market due to its characteristic features. Nevertheless, the dependence on the raw material for the packaging purpose, region-specific ban and various limitations on the consumption of canned food in various regions is restraining the expansion of the canned food market. For instance, the growing awareness about fitness and health among consumers is shifting the consumers' demand towards fresh food which is negatively impacting the market of the canned food. Unavailability of the raw materials required for the preparation of canned food at proper time may also restrict the market and worsen the growth in the forecasted years.
Opportunity:
Rising Environmental- Friendly Packaging Solutions
- Consumers are understanding the impact of plastic packaging on the environment and are demanding sustainable and recyclable solutions. The canned food meets all the concerns of the consumers which have been further driving the market of the canned food. Manufacturers are focusing on offering the varieties of the canned food products along with high quality, taste, and nutritional value to maintain their position in the competitive market. Thus, such rising awareness of the plastic packaging and the rising demand for a sustainable solution and increasing recycling rates globally have been further creating an opportunity and driving the market.
Challenges:
Product Recalls May Hamper the Growth
- Product recalls are very important to ensure safe supply to the consumers, so that any harm or risk can be avoided. However, the continuous rise in product recalls will further challenge the global canned food market growth during the projected period. These product recalls are a result of improper handling of raw materials or supplies during transportation and production. Over the last few years, many products have been recalled owing to the presence of allergens, use of contaminated raw materials and incorrect labelling. If such situation not resolved quickly, may cause a challenge in the global canned food market over the upcoming years.
Segmentation Analysis Of Canned Food Market
- By Product Type, the canned meat & seafood segment is expected to dominate the global canned food market in the projected years. Canned meat & seafood has been the widely preferred segment of canned food among consumers owing to the growing demand for meat and seafood products worldwide, coupled with increase in demand for high protein foods in the market. Owing to this demand for convenience food products, the market for ready meals is likely to grow at pace during the canned food market forecasted period.
- By Distribution Channel, the supermarket/hypermarket segment is estimated to dominate the canned food market, and is expected to retain its dominance throughout the forecast period. Supermarkets/hypermarkets are most preferred for purchasing canned foods in bulk volumes. Hence, owing to the remarkable presence of independent and chained supermarkets/hypermarkets in developed economic countries and growing penetration of supermarket/hypermarkets in developing countries, the growth of canned food market is substantial.
- By Type, Organic canned food product segment is anticipated to dominate over the forecasted years. Due to the increase in health concerns among the consumers, the consumers are willing to switch their preference and are demanding more organic food products. Also, due to the changing lifestyle and trends, the organic canned food segment is attaining a rapid growth. This is further motivating the manufacturers of the canned food market and is creating opportunities for organic canned food products in the upcoming years.
Regional Analysis of Canned Food Market
- The Asia Pacific region is expected to dominate the global canned food market in the projected years. Owing to growing disposable income and the busy lifestyle of consumers due to rising employment rate, the Asia Pacific region is retaining its dominance vastly. The growth in this region is derived from the rise in consumption practices of processed and packaged food products and beverages. The high consumer base as well as high population of working professionals in this region are most likely to boost the market growth over the projected time. Furthermore, the rapid urbanization as well as wide acceptance of westernized culture leads to a significant canned food market growth. In addition to this, the rise in millennial population, evolving dietary patterns and growing exposure to internet is expected to boost the rapid growth over the projected time.
- Europe is the prominent market and is accounted for the maximum share in the global canned food market in the upcoming years. This is attributed to high consumption of canned food products in majority of the European countries including the UK, Germany, France, and Italy. Consumers in this region are majorly attracted by canned food products with new textures, flavors, and higher nutritional value, which leads to the canned food market growth in this region. Also, the wide utilization of meat and meat products as well as vegetables in various cuisines have further contributed to the gradual growth of canned food market in the European region.
- North America is projected to have a substantial growth in canned food market sector over the projected time. The rapid improvement in supply chain and logistics and the improved infrastructure in this region is propelling the market growth of canned food. The rising popularity through online media and changing lifestyle trends in various regions of North America has contributed to the growth of the market. Also, the rise in ready to drink, and ready to eat food products and beverages is expected to dominate the canned food market in this region over the estimated period.
Top Key Players Covered In Canned Food Market
- Bolton Group Srl (Italy)
- Campbell Soup Co (US)
- ConAgra Brands Inc (US)
- Del Monte Pacific Ltd (California)
- General Mills Inc. (Minnesota, US)
- Nestle SA (Switzerland)
- Princes Ltd (UK)
- The Hain Celestial Group Inc (New York)
- The J.M. Smucker Co (Ohio, US)
- The Kraft Heinz Co (Chicago, US)
- Danish Crown (Denmark)
- CHB Group (Cheltenham, UK)
- AYAM SARL. (Singapore)
- JBS S.A (Greeley, US), and other major players.
Key Industry Development In The Canned Food Market
- In June 2024, Bull Brand, one of South Africa’s most beloved food brands, recently introduced three new ready-to-eat canned mince meals: Bolognaise Mince, Chilli Mince, and Savoury Mince. These additions joined the popular Curried Mince, launched last year, offering South Africans four versatile options to pair with their favorite starch. The launch aimed to meet the growing demand for affordable, nutritious, and convenient meal solutions, especially during challenging economic times.
- In January, 2022, As Growers of Good, Del Monte Foods, Inc. is to reduce the footprint of packaging by investing in new materials and redesigning existing materials. They further continued that, since 2009, they have been reducing use of plastics and metal, and today, only 4% of their packaging by weight contains any plastics; the rest is fully recyclable steel, glass or paper based.
|
Canned Food Market |
|||
|
Base Year: |
2023 |
Forecast Period: |
2024-2032 |
|
Historical Data: |
2017 to 2023 |
Market Size in 2023: |
USD 85.29 Bn. |
|
Forecast Period 2024-32 CAGR: |
4.21% |
Market Size in 2032: |
USD 123.62 Bn. |
|
Segments Covered: |
By Product Type |
|
|
|
By Distribution Channel |
|
||
|
By Nature |
|
||
|
By Region |
|
||
|
Key Market Drivers: |
|
||
|
Key Market Restraints: |
|
||
|
Key Opportunities: |
|
||
|
Companies Covered in the report: |
|
||
1.1 Scope and Coverage
Chapter 2:Executive Summary
Chapter 3: Market Landscape
3.1 Market Dynamics
3.1.1 Drivers
3.1.2 Restraints
3.1.3 Opportunities
3.1.4 Challenges
3.2 Market Trend Analysis
3.3 PESTLE Analysis
3.4 Porter's Five Forces Analysis
3.5 Industry Value Chain Analysis
3.6 Ecosystem
3.7 Regulatory Landscape
3.8 Price Trend Analysis
3.9 Patent Analysis
3.10 Technology Evolution
3.11 Investment Pockets
3.12 Import-Export Analysis
Chapter 4: Canned Food Market by Product Type (2018-2032)
4.1 Canned Food Market Snapshot and Growth Engine
4.2 Market Overview
4.3 Canned Meat Products
4.3.1 Introduction and Market Overview
4.3.2 Historic and Forecasted Market Size in Value USD and Volume Units
4.3.3 Key Market Trends, Growth Factors, and Opportunities
4.3.4 Geographic Segmentation Analysis
4.4 Canned Fish/Seafood
4.5 Canned Vegetables
4.6 Canned Fruits
Chapter 5: Canned Food Market by Distribution Channel (2018-2032)
5.1 Canned Food Market Snapshot and Growth Engine
5.2 Market Overview
5.3 Supermarkets/Hypermarkets
5.3.1 Introduction and Market Overview
5.3.2 Historic and Forecasted Market Size in Value USD and Volume Units
5.3.3 Key Market Trends, Growth Factors, and Opportunities
5.3.4 Geographic Segmentation Analysis
5.4 Convenience Stores
5.5 Online Retail Channels
Chapter 6: Canned Food Market by Nature (2018-2032)
6.1 Canned Food Market Snapshot and Growth Engine
6.2 Market Overview
6.3 Organic
6.3.1 Introduction and Market Overview
6.3.2 Historic and Forecasted Market Size in Value USD and Volume Units
6.3.3 Key Market Trends, Growth Factors, and Opportunities
6.3.4 Geographic Segmentation Analysis
6.4 Conventional
Chapter 7: Company Profiles and Competitive Analysis
7.1 Competitive Landscape
7.1.1 Competitive Benchmarking
7.1.2 Canned Food Market Share by Manufacturer (2024)
7.1.3 Industry BCG Matrix
7.1.4 Heat Map Analysis
7.1.5 Mergers and Acquisitions
7.2 NEW HOPE LIUHE CO. LTD. (CHINA)
7.2.1 Company Overview
7.2.2 Key Executives
7.2.3 Company Snapshot
7.2.4 Role of the Company in the Market
7.2.5 Sustainability and Social Responsibility
7.2.6 Operating Business Segments
7.2.7 Product Portfolio
7.2.8 Business Performance
7.2.9 Key Strategic Moves and Recent Developments
7.2.10 SWOT Analysis
7.3 CARGILL INC. (UNITED STATES)
7.4 GUANGDONG HAID GROUP (CHINA)
7.5 CHAROEN POKPHAND FOODS PUBLIC COMPANY LIMITED (THAILAND)
7.6 NUTRECO NV (NETHERLANDS)
7.7 CJ CHEILJEDANG CORPORATION (SOUTH KOREA)
7.8 TIANJIN MUYUAN BIO-TECHNOLOGY COLTD. (CHINA)
7.9 JILIN HAILI FEED GROUP COLTD. (CHINA)
7.10 FAMSUN COLTD. (CHINA)
7.11 DALI FOODS GROUP COLTD. (CHINA)
7.12 COFCO INTERNATIONAL LTD. (CHINA)
7.13 EWOS(NORWAY)
7.14 LANDUS COOPERATIVE (UNITED STATES)
7.15 BIG DUTCHMAN INTERNATIONAL GMBH (GERMANY)
7.16 ALLTECH INC. (UNITED STATES)
7.17 ADM NUTRITION (UNITED STATES)
7.18 AB AGRI LTD. (UNITED KINGDOM)
7.19 FORFARMERS N.V. (NETHERLANDS)
7.20 BASU GROUP (INDIA)
7.21 VENKY'S (INDIA)
Chapter 8: Global Canned Food Market By Region
8.1 Overview
8.2. North America Canned Food Market
8.2.1 Key Market Trends, Growth Factors and Opportunities
8.2.2 Top Key Companies
8.2.3 Historic and Forecasted Market Size by Segments
8.2.4 Historic and Forecasted Market Size by Product Type
8.2.4.1 Canned Meat Products
8.2.4.2 Canned Fish/Seafood
8.2.4.3 Canned Vegetables
8.2.4.4 Canned Fruits
8.2.5 Historic and Forecasted Market Size by Distribution Channel
8.2.5.1 Supermarkets/Hypermarkets
8.2.5.2 Convenience Stores
8.2.5.3 Online Retail Channels
8.2.6 Historic and Forecasted Market Size by Nature
8.2.6.1 Organic
8.2.6.2 Conventional
8.2.7 Historic and Forecast Market Size by Country
8.2.7.1 US
8.2.7.2 Canada
8.2.7.3 Mexico
8.3. Eastern Europe Canned Food Market
8.3.1 Key Market Trends, Growth Factors and Opportunities
8.3.2 Top Key Companies
8.3.3 Historic and Forecasted Market Size by Segments
8.3.4 Historic and Forecasted Market Size by Product Type
8.3.4.1 Canned Meat Products
8.3.4.2 Canned Fish/Seafood
8.3.4.3 Canned Vegetables
8.3.4.4 Canned Fruits
8.3.5 Historic and Forecasted Market Size by Distribution Channel
8.3.5.1 Supermarkets/Hypermarkets
8.3.5.2 Convenience Stores
8.3.5.3 Online Retail Channels
8.3.6 Historic and Forecasted Market Size by Nature
8.3.6.1 Organic
8.3.6.2 Conventional
8.3.7 Historic and Forecast Market Size by Country
8.3.7.1 Russia
8.3.7.2 Bulgaria
8.3.7.3 The Czech Republic
8.3.7.4 Hungary
8.3.7.5 Poland
8.3.7.6 Romania
8.3.7.7 Rest of Eastern Europe
8.4. Western Europe Canned Food Market
8.4.1 Key Market Trends, Growth Factors and Opportunities
8.4.2 Top Key Companies
8.4.3 Historic and Forecasted Market Size by Segments
8.4.4 Historic and Forecasted Market Size by Product Type
8.4.4.1 Canned Meat Products
8.4.4.2 Canned Fish/Seafood
8.4.4.3 Canned Vegetables
8.4.4.4 Canned Fruits
8.4.5 Historic and Forecasted Market Size by Distribution Channel
8.4.5.1 Supermarkets/Hypermarkets
8.4.5.2 Convenience Stores
8.4.5.3 Online Retail Channels
8.4.6 Historic and Forecasted Market Size by Nature
8.4.6.1 Organic
8.4.6.2 Conventional
8.4.7 Historic and Forecast Market Size by Country
8.4.7.1 Germany
8.4.7.2 UK
8.4.7.3 France
8.4.7.4 The Netherlands
8.4.7.5 Italy
8.4.7.6 Spain
8.4.7.7 Rest of Western Europe
8.5. Asia Pacific Canned Food Market
8.5.1 Key Market Trends, Growth Factors and Opportunities
8.5.2 Top Key Companies
8.5.3 Historic and Forecasted Market Size by Segments
8.5.4 Historic and Forecasted Market Size by Product Type
8.5.4.1 Canned Meat Products
8.5.4.2 Canned Fish/Seafood
8.5.4.3 Canned Vegetables
8.5.4.4 Canned Fruits
8.5.5 Historic and Forecasted Market Size by Distribution Channel
8.5.5.1 Supermarkets/Hypermarkets
8.5.5.2 Convenience Stores
8.5.5.3 Online Retail Channels
8.5.6 Historic and Forecasted Market Size by Nature
8.5.6.1 Organic
8.5.6.2 Conventional
8.5.7 Historic and Forecast Market Size by Country
8.5.7.1 China
8.5.7.2 India
8.5.7.3 Japan
8.5.7.4 South Korea
8.5.7.5 Malaysia
8.5.7.6 Thailand
8.5.7.7 Vietnam
8.5.7.8 The Philippines
8.5.7.9 Australia
8.5.7.10 New Zealand
8.5.7.11 Rest of APAC
8.6. Middle East & Africa Canned Food Market
8.6.1 Key Market Trends, Growth Factors and Opportunities
8.6.2 Top Key Companies
8.6.3 Historic and Forecasted Market Size by Segments
8.6.4 Historic and Forecasted Market Size by Product Type
8.6.4.1 Canned Meat Products
8.6.4.2 Canned Fish/Seafood
8.6.4.3 Canned Vegetables
8.6.4.4 Canned Fruits
8.6.5 Historic and Forecasted Market Size by Distribution Channel
8.6.5.1 Supermarkets/Hypermarkets
8.6.5.2 Convenience Stores
8.6.5.3 Online Retail Channels
8.6.6 Historic and Forecasted Market Size by Nature
8.6.6.1 Organic
8.6.6.2 Conventional
8.6.7 Historic and Forecast Market Size by Country
8.6.7.1 Turkiye
8.6.7.2 Bahrain
8.6.7.3 Kuwait
8.6.7.4 Saudi Arabia
8.6.7.5 Qatar
8.6.7.6 UAE
8.6.7.7 Israel
8.6.7.8 South Africa
8.7. South America Canned Food Market
8.7.1 Key Market Trends, Growth Factors and Opportunities
8.7.2 Top Key Companies
8.7.3 Historic and Forecasted Market Size by Segments
8.7.4 Historic and Forecasted Market Size by Product Type
8.7.4.1 Canned Meat Products
8.7.4.2 Canned Fish/Seafood
8.7.4.3 Canned Vegetables
8.7.4.4 Canned Fruits
8.7.5 Historic and Forecasted Market Size by Distribution Channel
8.7.5.1 Supermarkets/Hypermarkets
8.7.5.2 Convenience Stores
8.7.5.3 Online Retail Channels
8.7.6 Historic and Forecasted Market Size by Nature
8.7.6.1 Organic
8.7.6.2 Conventional
8.7.7 Historic and Forecast Market Size by Country
8.7.7.1 Brazil
8.7.7.2 Argentina
8.7.7.3 Rest of SA
Chapter 9 Analyst Viewpoint and Conclusion
9.1 Recommendations and Concluding Analysis
9.2 Potential Market Strategies
Chapter 10 Research Methodology
10.1 Research Process
10.2 Primary Research
10.3 Secondary Research
|
Canned Food Market |
|||
|
Base Year: |
2023 |
Forecast Period: |
2024-2032 |
|
Historical Data: |
2017 to 2023 |
Market Size in 2023: |
USD 85.29 Bn. |
|
Forecast Period 2024-32 CAGR: |
4.21% |
Market Size in 2032: |
USD 123.62 Bn. |
|
Segments Covered: |
By Product Type |
|
|
|
By Distribution Channel |
|
||
|
By Nature |
|
||
|
By Region |
|
||
|
Key Market Drivers: |
|
||
|
Key Market Restraints: |
|
||
|
Key Opportunities: |
|
||
|
Companies Covered in the report: |
|
||
Frequently Asked Questions :
The forecast period in the Canned Food Market research report is 2023-2032.
Bolton Group Srl (Italy), Campbell Soup Co (US), ConAgra Brands Inc (US), Del Monte Pacific Ltd (California), General Mills Inc. (Minnesota, US), Nestle SA (Switzerland), Princes Ltd (UK), The Hain Celestial Group Inc (New York), The J.M. Smucker Co (Ohio, US), The Kraft Heinz Co (Chicago, US), Danish Crown (Denmark), CHB Group (Cheltenham, UK), AYAM SARL. (Singapore), JBS S.A (Greeley, US), and other major players.
The Canned Food Market is segmented into Product type, Distribution Channel, Type and region. By Product Type, the market is categorized into Meat Products, Fish/Sea Food, Vegetables, Fruits. By Distribution Channel, the market is categorized into Supermarkets/Hypermarkets, Convenience stores and Online Retail Channels. By Type, the market is categorized into Organic and Conventional. By region, it is analyzed across North America (U.S.; Canada; Mexico), Europe (Germany; U.K.; France; Italy; Russia; Spain, etc.), Asia-Pacific (China; India; Japan; Southeast Asia, etc.), South America (Brazil; Argentina, etc.), Middle East & Africa (Saudi Arabia; South Africa, etc.).
Canning is a method of preserving foods for longer period of time by packing them in different airtight containers. The market is mainly driven by the rising urban population that prefers healthy food rich in protein, fibers, vitamins, and omega-3 fatty acids.
The Global Canned Food Market Size Was Valued at USD 85.29 Billion in 2023 and is Projected to Reach USD 123.62 Billion by 2032, Growing at a CAGR of 4.21% From 2024-2032.


